Watch how to order a trading robot
Read the Rules before you post an order or execute it
How to Order a Trading Robot in MQL5 and MQL4
See a sample Requirements Specification to order a robot
New orders in the category:
100+ USD
30 - 50 USD
30 - 50 USD
300+ USD
Job finished
Execution time 42 days
Specification
Hi,
I'm seeking an experienced coder with advanced mathematical understanding to let him programm a complex custom indicator that will later be part of the corresponding final EA. Budget is $ 90.00 (only for the indicator) here on mql5.com. Who can do this accurately?Best,
Ben
PS: Here's the description of the requested indicator SupRes_v1:
Concept:
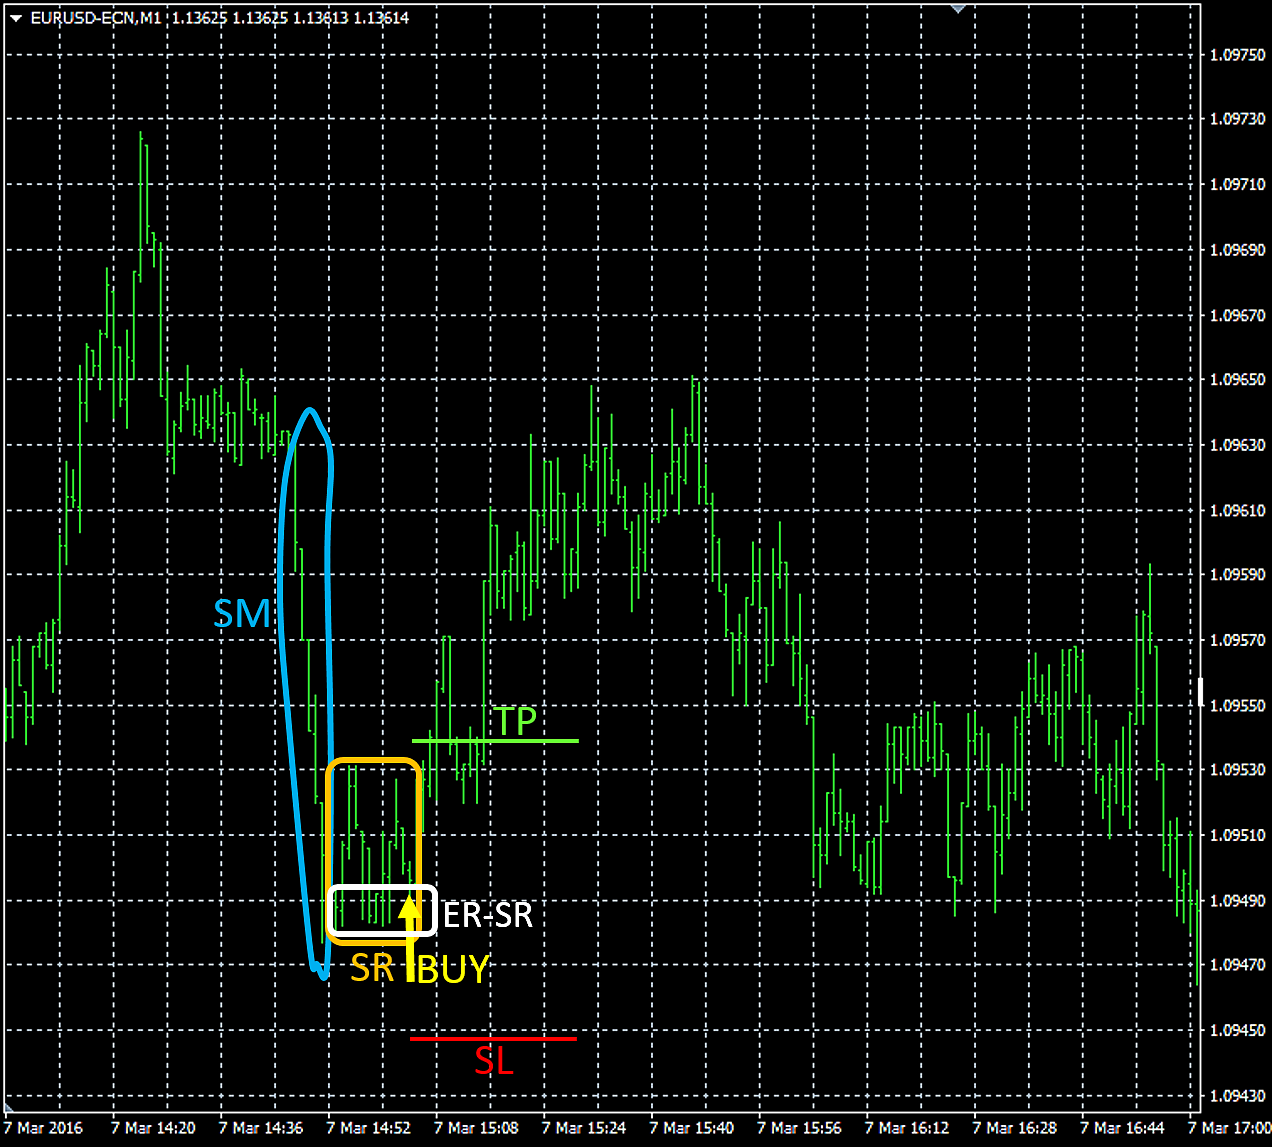
SupRes_v1 detects strong up/down price movements followed by a support/resistance area and draws a down(sell.order) / up(buy.order) arrow contrary to said strong movement. The requested indicator also plots lines for suggested fixed SL/TP levels along with said arrows that symbolize the recommended trading direction.
It is recommended to open the attached image resp. figure in a separate browser tab etc. for a better understanding when reading the detailed description below.
Description in detail:
Stage 1:
The fx chart resp. price makes a strong up(sell.order) / down(buy.order) movement for at least n bars. A strong movement (SM) must be calculated as follows:
SM = [(Difference in points between the highest high and the lowest low of the last n closed bars)/n]/[SUM(length of n bars)]
In the Indis GUI the user must also be able to define the minimum value for SM:
-> Minimum value of SM: 0.55 [etc.]
-> Minimum number n of SM bars: 5 [etc.]
If e.g. SM = 0.60, the strong movements bars overlapping value must be averagely maximum 40 %.
If e.g. SM = 1.00, the strong movement consist of consecutive, averagely non-overlapping bars.
If e.g. SM > 1.00, the strong movements bars MUST have partly gaps between each other.
The indi must permanently scan the charts last n closed bars and recognize if all conditions for a valid SM are fulfilled.
Once a SM is detected the indi must note the value resp. price of SMs lowest low and highest high and their positions (time/date). From then on the indi must continually check resp. recalculate if the movement stays strong (definition see above) when including the follow-up bars n+1, n+2, n+3, , n+x (instead of calculating only with n) and ONLY IN THIS CASE update the values/dates for SMs lowest low and highest high (see above).
Furthermore a potential SM(n) resp. SM(n+x) must be ignored by the indi if it exceeds maximum points of distance SM or undercuts minimum points of distance SM, whereby distance = difference between the highest high and the lowest low of all SM valid closed bars (n+x):
-> Maximum points of distance SM: 300 [etc. (if TF = M1)]
-> Minimum points of distance SM: 70 [etc. (if TF = M1)]
Stage 2:
The strong movement slows down. This means that the Minimum value for SMs n bars: 0.55 [etc.] is undercut by the currently closed n+x+1 bar e.g. SMs calculated current actual value shrinks from >0.55 to 0.54 or 0.43 etc. In this case the indi must make the final notation of SMs lowest low / highest high (see above) BUT EXCLUDING the last closed bar that caused the end of SM!
Now the bars of SM consist of the initial bar (IB) followed by n-1 bars + x bars that let the movement stay strong (x can also be 0!) including the final SM bar (FB), before SM is terminated by the terminating bar (TB) which already belongs to the support/resistance area (SR), see below.
Stage 3:
The strong movement (SM) is per definition followed by a support/resistance area (SR). Now the indi must check if at least the next k closed bars within SR starting with TB (see above) are fulfilling the following conditions:
1.) The difference of SRs k bars highest high and lowest low must be a maximum percentage (SR-MP) in relation to SM:
-> Maximum value for SR-MP: 0.35 [etc.]
-> Minimum number k of SR bars: 5 [etc.]
If e.g. SR-MP = 0.35, the k bars in the support/resistance area (SR) are all swinging within a range of maximum 35 % in relation to the strong movements (SM) distance [calculated according to Stage 1).
2.) At least e bars of the k closed bars (within SR, see above) have a high(sell.order) / low(buy.order) that is close to the highest.high(sell.order) / lowest.low(buy.order) of SM-SR, whereby SM-SR includes ALL closed bars starting with IB (initial bar of SM) and ending with the last closed CURRENT bar. Said e bars upper/bottom extrema [high(sell.order) / low(buy.order)] must be in a specified range [in points]; for example 2 bars out of 5 within SR are close to each other AND close to said extremum of SM-SR:
-> Maximum range of SRs e bars: 10 [etc.]
-> Minimum number e of SR bars with similar extrema: 2 [etc.]
If Minimum number e of SR bars with similar extrema = 0, there MUST NOT be any couple/triplet etc. of bars with similar extrema but CAN BE.
3.) At least the l last closed bars of k are lower(sell.order) / higher(buy.order) OR EQUAL to the corresponding extremum of SM-SR:
-> Minimum number l of SRs last bars with lower/higher extremum: 2 [etc.]
If Minimum number l of SRs last bars with lower/higher extremum = 0, the last closed bars within k have no further restriction at this point.
NOTE:
If not all conditions of Stage 3 are fulfilled at the close of bar k, the indi must continually check resp. recalculate them with bars k+1 (instead of k), then k+2 (instead of k+1), then k+3 (instead of k+2), and so on. This process will end if
a) all conditions are fulfilled
or
b) Maximum value for SR-MP is exceeded by the currently processed bar.
If b) occurs the indi must go back to resp. start again with Stage 1.
If a) occurs the indi must proceed with Stage 4 (see below).
Stage 4:
If all conditions of Stage 3 are fulfilled the indi must wait until the current price reaches the end region of SR = ER-SR. The ER-SR is per definition located in the upper(sell.order) / bottom(buy.order) area of SR and finally ending with the SRs highest.high(sell.order) / lowest.low(buy.order). ER-SR must be set in the GUI by the user as a percentage of the distance between the highest high and the lowest low of SR:
-> ER-SRs percentage for entry price level: 0.25 [etc.]
In this case the current price must reach the top(sell.order) / bottom(buy.order) 25% of SR to fulfill this condition.
If said value is set to e.g. 1.25 (= 125%) the current price must exceed(sell.order) / undercut(buy.order) SRs highest.high(sell.order) / lowest.low(buy.order) with a distance of at least 25% SR, whereby distance of SR = highest.high - lowest.low of the current/actual SR in points.
This means that all values above 1.00 result in an price must exceed(sell.order) / undercut(buy.order) a special price level that lies OUTSIDE SR. This calculation is NOT the same as for values between 0.00 and 1.00, because the latter values result in an price must reach specific area.
NOTE:
Its very important that all follow-up bars after Stage 3 resp. while Stage 4 must apart from that ALSO be in the range of Maximum value for SR-MP [see Stage 3: 1.)], even the currently processed (not closed) bar!
As soon as a (current) follow-up bar of Stage 4 exceeds Maximum value for SR-MP before reaching ER-SR (see above) the indi must go back resp. start again with Stage 1.
Stage 5:
If all conditions of Stage 4 are fulfilled the indi must draw a colored down(sell.order) / up(buy.order) arrow above/below the current price reaching ER-SR (see above):
-> Color of the up/buy arrow: yellow [etc.]
-> Color of the down/sell arrow: yellow [etc.]
Furthermore the indi must calculate and draw suggested fixed SL/TP levels (horizontal thin and dotted lines with a length of 20 bars):
-> Color of the fixed SL line: red [etc.]
-> Color of the fixed TP line: lime [etc.]
The value resp. price level of SL/TP must be calculated as follows:
A user defined percentage of the difference highest.high and lowest.low of the whole movement IB->ArrowBar is converted to points and
for SL added(sell.order) to / subtracted(buy.order) from the arrows price level
resp.
for TP subtracted(sell.order) from / added(buy.order) to the arrows price level:
-> SM-SRs percentage for calculating SL buy: 0.35 [etc.]
-> SM-SRs percentage for calculating TP buy: 0.25 [etc.]
-> SM-SRs percentage for calculating SL sell: 0.40 [etc.]
-> SM-SRs percentage for calculating TP sell: 0.20 [etc.]
Furthermore the final SL/TP levels must ALWAYS be expanded by a user set spread (in points) that best represents the brokers average:
-> Spread added to expand TP/SL: 12 [etc.]
Stage 6:
After an arrow and its corresponding TP/SL lines were drawn by the indi the latter must pause all further calculations for the current signal triggering bar AND for r (recess) follow-up bars. After r bars it starts again with Stage 1:
-> Number of recess bars after signal: 10 [etc.]
NOTE: The indi must be 100 % non-repaint and every arrow resp. TP/SL line will stay forever!
Extra filter:
If enabled, all potential sell/buy signals will be skipped if not at least b bars BEFORE SM have a lower.high(sell.order) / higher.low(buy.order) than the highest.high(sell.order) / lowest.low(buy.order) of SM-SR with at least p points difference:
-> Enable extra filter: true/false
-> Minimum number of lower/higher bars b before SM: 100 [etc.]
-> Minimum points of lower/higher bars before SM: 120 [etc.]
!! Please optimize the indicator for the lowest possible CPU usage thx !!
Responded
1
Rating
Projects
149
36%
Arbitration
29
3%
/
55%
Overdue
35
23%
Free
2
Rating
Projects
120
34%
Arbitration
17
18%
/
41%
Overdue
51
43%
Free
3
Rating
Projects
395
28%
Arbitration
69
19%
/
49%
Overdue
120
30%
Free
4
Rating
Projects
301
30%
Arbitration
54
24%
/
56%
Overdue
98
33%
Free
Similar orders
Supertrend + Heikin ashi indicator for mt5
35 - 45 USD
I need someone the create a supertrend indicator based on Heikin Ashi candles instead of normal candles. Needs to be exactly the same as the supertrend (original one) + ha from tradingview. In m1,m5,m15 the indicator must have the same values found with the tradingview. Work that meets this requirement will be accepted ( depending on the broker and spread, however, a few pips of difference will be accepted)
Here is a detailed instruction for the coder to implement the vertical lines based on the BrainTrainSignalAlert indicator: --- **Task: Implement Vertical Lines for Alerts from BrainTrainSignalAlert Indicator** **Objective:** Create a system that adds vertical lines on specified timeframes (M5 or M30) whenever an alert is generated by the BrainTrainSignalAlert indicator on the H1, H4, and D1 timeframes. The lines
Fixing MT4 Indicator
40+ USD
Hello Guys! I want to modify/fix the indicator that uses sequential type of entries (it calculates from 1 to 9) and if the conditions are met it provides an arrow (signal) with alert. The problem is that, sometimes (for unknown for me reasons) it repaints arrow signal. Like on the picture: Signal 1 - correct signal Signal 2 - correct signal Signal 3 - correct signal Signal 4 - repaints (signal 3 arrow dissapeared
Two indicator merge
30+ USD
Merge 2 ZickZack indicators to 1 indicator. Indicator 1 is a ZickZack Pointer. Indicator 2 is based on 3 level ZickZack semaphore. Indicator source codes will be provided to the selected developer
Hi, I have a Live Data feature for my trading accounts that lets me check details like total open positions, number of lots, profits, etc. I need someone to add the number of pending orders to this live data. This is important for me to ensure that all accounts have the same number of pending orders, since I use a copy trading system. Also, there is a website where I check all the data. In this case, you would need
Convert 3 Indicators from MQL4 -> MQL5
50 - 100 USD
Hello, i am searching for an experienced, professional software engineer, who can convert three Indicators from MQL4 to MQL5. This may sound like an easy job, but one indicator is like a trading system and therefore a bit complex. So you need to have a very good understanding of both languages. You should also be able to code MQL5 classes ( https://www.mql5.com/en/docs/basis/oop ). The intention is to code MQL5
I came across an indicator that's perfectly good in catching spikes in boom amd crash but i would want it to be modified and to improve accuracy As a professional you will have to go through the indicator and explain to me the strategy with which the indicator was buid and tell me the possibility of improving it better
An EA that executes when the 21 and 55 SMA Cross on certain time frame also the EA will understand supply and demand levels and executes when price reacts on this levels specified and target/stoploss levels will be predetermined...also the robot will also comprise stochastic oscillator
Need a devoloper for( personal)
30+ USD
I have a full code ,, There are some errors in this.It does not add to the chart, does not show arrow marks, does not alert ,, fix this problem and work properly,, Contact on telegram @Gw_rakib1
Starting from scratch, I need a solution to develop my own crypto trading and exchange platform. This platform should compare prices across various exchanges like Coinbase, Binance, KuCoin, and Unocoin, as well as different cryptocurrencies. The solution must identify opportunities to buy on one platform and sell on another for a profit, transferring funds to my personal wallet instantly for security. The bot should
Project information
Budget
40 - 90 USD
VAT (19%):
7.6
- 17.1
USD
Total:
47.6
- 107.1
USD
For the developer
36
- 81
USD
Deadline
from 1 to 4 day(s)