트레이딩 로봇 주문 방법을 보십시오
주문을 실행하거나 포스트하기 전에 규칙을 읽으십시오
MQL5 및 MQL 4의 트레이딩 로봇을 주문하는 방법
로봇을 주문하기 위해샘플 요구 사항을 보십시오
카테고리의 새로운 주문:
50 - 150 USD
30 - 200 USD
30 - 50 USD
30 USD
작업 종료됨
실행 시간 42 일
명시
Hi,
I'm seeking an experienced coder with advanced mathematical understanding to let him programm a complex custom indicator that will later be part of the corresponding final EA. Budget is $ 90.00 (only for the indicator) here on mql5.com. Who can do this accurately?Best,
Ben
PS: Here's the description of the requested indicator SupRes_v1:
Concept:
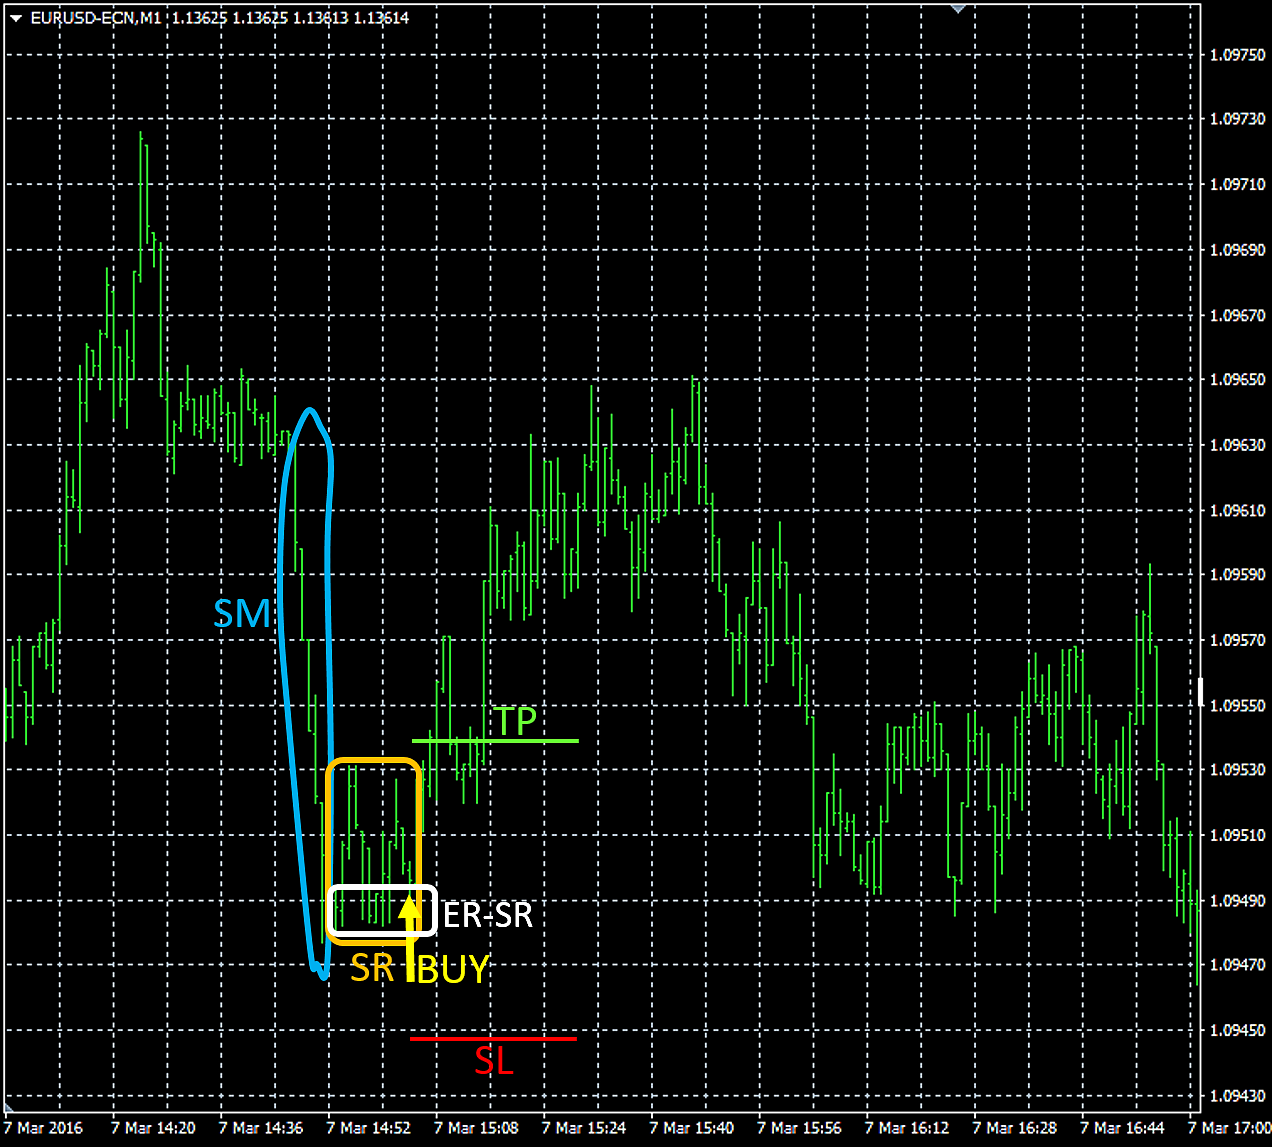
SupRes_v1 detects strong up/down price movements followed by a support/resistance area and draws a down(sell.order) / up(buy.order) arrow contrary to said strong movement. The requested indicator also plots lines for suggested fixed SL/TP levels along with said arrows that symbolize the recommended trading direction.
It is recommended to open the attached image resp. figure in a separate browser tab etc. for a better understanding when reading the detailed description below.
Description in detail:
Stage 1:
The fx chart resp. price makes a strong up(sell.order) / down(buy.order) movement for at least n bars. A strong movement (SM) must be calculated as follows:
SM = [(Difference in points between the highest high and the lowest low of the last n closed bars)/n]/[SUM(length of n bars)]
In the Indis GUI the user must also be able to define the minimum value for SM:
-> Minimum value of SM: 0.55 [etc.]
-> Minimum number n of SM bars: 5 [etc.]
If e.g. SM = 0.60, the strong movements bars overlapping value must be averagely maximum 40 %.
If e.g. SM = 1.00, the strong movement consist of consecutive, averagely non-overlapping bars.
If e.g. SM > 1.00, the strong movements bars MUST have partly gaps between each other.
The indi must permanently scan the charts last n closed bars and recognize if all conditions for a valid SM are fulfilled.
Once a SM is detected the indi must note the value resp. price of SMs lowest low and highest high and their positions (time/date). From then on the indi must continually check resp. recalculate if the movement stays strong (definition see above) when including the follow-up bars n+1, n+2, n+3, , n+x (instead of calculating only with n) and ONLY IN THIS CASE update the values/dates for SMs lowest low and highest high (see above).
Furthermore a potential SM(n) resp. SM(n+x) must be ignored by the indi if it exceeds maximum points of distance SM or undercuts minimum points of distance SM, whereby distance = difference between the highest high and the lowest low of all SM valid closed bars (n+x):
-> Maximum points of distance SM: 300 [etc. (if TF = M1)]
-> Minimum points of distance SM: 70 [etc. (if TF = M1)]
Stage 2:
The strong movement slows down. This means that the Minimum value for SMs n bars: 0.55 [etc.] is undercut by the currently closed n+x+1 bar e.g. SMs calculated current actual value shrinks from >0.55 to 0.54 or 0.43 etc. In this case the indi must make the final notation of SMs lowest low / highest high (see above) BUT EXCLUDING the last closed bar that caused the end of SM!
Now the bars of SM consist of the initial bar (IB) followed by n-1 bars + x bars that let the movement stay strong (x can also be 0!) including the final SM bar (FB), before SM is terminated by the terminating bar (TB) which already belongs to the support/resistance area (SR), see below.
Stage 3:
The strong movement (SM) is per definition followed by a support/resistance area (SR). Now the indi must check if at least the next k closed bars within SR starting with TB (see above) are fulfilling the following conditions:
1.) The difference of SRs k bars highest high and lowest low must be a maximum percentage (SR-MP) in relation to SM:
-> Maximum value for SR-MP: 0.35 [etc.]
-> Minimum number k of SR bars: 5 [etc.]
If e.g. SR-MP = 0.35, the k bars in the support/resistance area (SR) are all swinging within a range of maximum 35 % in relation to the strong movements (SM) distance [calculated according to Stage 1).
2.) At least e bars of the k closed bars (within SR, see above) have a high(sell.order) / low(buy.order) that is close to the highest.high(sell.order) / lowest.low(buy.order) of SM-SR, whereby SM-SR includes ALL closed bars starting with IB (initial bar of SM) and ending with the last closed CURRENT bar. Said e bars upper/bottom extrema [high(sell.order) / low(buy.order)] must be in a specified range [in points]; for example 2 bars out of 5 within SR are close to each other AND close to said extremum of SM-SR:
-> Maximum range of SRs e bars: 10 [etc.]
-> Minimum number e of SR bars with similar extrema: 2 [etc.]
If Minimum number e of SR bars with similar extrema = 0, there MUST NOT be any couple/triplet etc. of bars with similar extrema but CAN BE.
3.) At least the l last closed bars of k are lower(sell.order) / higher(buy.order) OR EQUAL to the corresponding extremum of SM-SR:
-> Minimum number l of SRs last bars with lower/higher extremum: 2 [etc.]
If Minimum number l of SRs last bars with lower/higher extremum = 0, the last closed bars within k have no further restriction at this point.
NOTE:
If not all conditions of Stage 3 are fulfilled at the close of bar k, the indi must continually check resp. recalculate them with bars k+1 (instead of k), then k+2 (instead of k+1), then k+3 (instead of k+2), and so on. This process will end if
a) all conditions are fulfilled
or
b) Maximum value for SR-MP is exceeded by the currently processed bar.
If b) occurs the indi must go back to resp. start again with Stage 1.
If a) occurs the indi must proceed with Stage 4 (see below).
Stage 4:
If all conditions of Stage 3 are fulfilled the indi must wait until the current price reaches the end region of SR = ER-SR. The ER-SR is per definition located in the upper(sell.order) / bottom(buy.order) area of SR and finally ending with the SRs highest.high(sell.order) / lowest.low(buy.order). ER-SR must be set in the GUI by the user as a percentage of the distance between the highest high and the lowest low of SR:
-> ER-SRs percentage for entry price level: 0.25 [etc.]
In this case the current price must reach the top(sell.order) / bottom(buy.order) 25% of SR to fulfill this condition.
If said value is set to e.g. 1.25 (= 125%) the current price must exceed(sell.order) / undercut(buy.order) SRs highest.high(sell.order) / lowest.low(buy.order) with a distance of at least 25% SR, whereby distance of SR = highest.high - lowest.low of the current/actual SR in points.
This means that all values above 1.00 result in an price must exceed(sell.order) / undercut(buy.order) a special price level that lies OUTSIDE SR. This calculation is NOT the same as for values between 0.00 and 1.00, because the latter values result in an price must reach specific area.
NOTE:
Its very important that all follow-up bars after Stage 3 resp. while Stage 4 must apart from that ALSO be in the range of Maximum value for SR-MP [see Stage 3: 1.)], even the currently processed (not closed) bar!
As soon as a (current) follow-up bar of Stage 4 exceeds Maximum value for SR-MP before reaching ER-SR (see above) the indi must go back resp. start again with Stage 1.
Stage 5:
If all conditions of Stage 4 are fulfilled the indi must draw a colored down(sell.order) / up(buy.order) arrow above/below the current price reaching ER-SR (see above):
-> Color of the up/buy arrow: yellow [etc.]
-> Color of the down/sell arrow: yellow [etc.]
Furthermore the indi must calculate and draw suggested fixed SL/TP levels (horizontal thin and dotted lines with a length of 20 bars):
-> Color of the fixed SL line: red [etc.]
-> Color of the fixed TP line: lime [etc.]
The value resp. price level of SL/TP must be calculated as follows:
A user defined percentage of the difference highest.high and lowest.low of the whole movement IB->ArrowBar is converted to points and
for SL added(sell.order) to / subtracted(buy.order) from the arrows price level
resp.
for TP subtracted(sell.order) from / added(buy.order) to the arrows price level:
-> SM-SRs percentage for calculating SL buy: 0.35 [etc.]
-> SM-SRs percentage for calculating TP buy: 0.25 [etc.]
-> SM-SRs percentage for calculating SL sell: 0.40 [etc.]
-> SM-SRs percentage for calculating TP sell: 0.20 [etc.]
Furthermore the final SL/TP levels must ALWAYS be expanded by a user set spread (in points) that best represents the brokers average:
-> Spread added to expand TP/SL: 12 [etc.]
Stage 6:
After an arrow and its corresponding TP/SL lines were drawn by the indi the latter must pause all further calculations for the current signal triggering bar AND for r (recess) follow-up bars. After r bars it starts again with Stage 1:
-> Number of recess bars after signal: 10 [etc.]
NOTE: The indi must be 100 % non-repaint and every arrow resp. TP/SL line will stay forever!
Extra filter:
If enabled, all potential sell/buy signals will be skipped if not at least b bars BEFORE SM have a lower.high(sell.order) / higher.low(buy.order) than the highest.high(sell.order) / lowest.low(buy.order) of SM-SR with at least p points difference:
-> Enable extra filter: true/false
-> Minimum number of lower/higher bars b before SM: 100 [etc.]
-> Minimum points of lower/higher bars before SM: 120 [etc.]
!! Please optimize the indicator for the lowest possible CPU usage thx !!
응답함
1
등급
프로젝트
149
36%
중재
29
3%
/
55%
기한 초과
35
23%
무료
2
등급
프로젝트
120
34%
중재
17
18%
/
41%
기한 초과
51
43%
무료
3
등급
프로젝트
395
28%
중재
69
19%
/
49%
기한 초과
120
30%
무료
4
등급
프로젝트
301
30%
중재
54
24%
/
56%
기한 초과
98
33%
무료
비슷한 주문
Hi, I have 2 indicators which are based on the super trend , the alerts on indicator (1) does not work at all , and on the other indicator the alerts do not come on time on time, which is kind of delayed. see attached file below
Looking for an experienced developer to modify my existing TDI strategy , want to add filter for Buy and Sell Signals, Arrows are displayed on chart and what only to leave high accurate arrows Source code to be provided
I have the mq5 file, I need a buffer adding to the indicator, so it appears in the data window so I can reference it later in an EA. As the below screenshot shows, there is a median ray line from yesterday (the dashed horizontal line) - I want this value in the data window called Median Ray. I want this to be a single value per day, so todays Median Ray would be 17868, and so on each day. So I want all the Developing
Creating an indicator for metatrader 4
30 - 50 USD
I would like to develop my own indicator on metatrader 4 and tradingview. We would start with a basic version that we would improve later. It is an indicator based on several analyses and which would provide several indications. I am looking for someone who can develop on MT4 and Mt5, initially I would like to do it on mt4 and then on mt5. If you have expertise in pinescript it is a plus because I would like to
Indicator Conversion
30+ USD
I urgently require swift assistance to convert a complex indicator into a fully functional scanner, capable of automatically sending real-time data, alerts, and notifications via email, ensuring seamless integration and prompt delivery of critical information to facilitate informed decision-making and timely action
Make indicator lighter/faster
30+ USD
I need to improve the code of an indicator that is too heavy and slow when running and when used with iCustom in an EA. No other changes to the indicator are requested: the original features of the indicator should remain as theay are. I'll provide the indicator after job acceptance. I request final source code mq5 file. Thank you Regards
I have a mt5 indicator that is working perfectly but I will like to make it an expert advisor to have an automated trade. I will be glad if I can get a well experienced developer to execute this project. Thanks
O TRABALHO CONSISTE NA MUDANÇA DO HISTOGRAMA DO INDICADOR TREDN DIRECTION AND FORCE DSEMA SMOOTHED PARA O HISTOGRAMA DA FOTO ANEXA, OBEDECENDO AS TRES CORES VERDE (UP, VERMELHOR(DOWN) E CINZA(TREND). O MESMO TEM QUE ODECER O MESMO CALCULO E COLORIR DA MESMA FORMA POREM COM HISTOGRAMA DDE FORMATO DIFERENTE
I need someone who knows how to integrate hedging strategy to my simple existing EA for mt5
30 - 50 USD
If you are knowledgeable in hedging strategy we can chat. I created my simple EA using Fxdreema , so you only need to modify it for me. There are two parts of the EA , 1. Is the execution strategy 2. Is the money management strategy (hedging). I already created number 1 which is the execution of trades , I only need someone who can implement hedging in every orders the EA create. Additional Parameters needed. Trade
We are interested in a TradingView indicator
100 - 150 USD
We are interested in a TradingView indicator that reads candlestick pattern shapes and shows the location of entry and exit points on a candlestick chart. What services do you provide related to this
프로젝트 정보
예산
40 - 90 USD
VAT (19%):
7.6
- 17.1
USD
총:
47.6
- 107.1
USD
개발자에게
36
- 81
USD
기한
에서 1 로 4 일