Conheça o Mercado MQL5 no YouTube, assista aos vídeos tutoriais
Como comprar um robô de negociação ou indicador?
Execute seu EA na
hospedagem virtual
hospedagem virtual
Teste indicadores/robôs de negociação antes de comprá-los
Quer ganhar dinheiro no Mercado?
Como apresentar um produto para o consumidor final?
Expert Advisors e Indicadores para MetaTrader 5 - 59

The indicator is getting the four most important trading sessions: New York London Sydney
Tokyo The indicator auto calculate the GMT time. The indicator has buffers that can be used to get the current session and the GMT.
You can use it as stand alone indicator and you can turn the draw off and call it from your EA. INPUTS Max Day: Max days back to get/draw. London Session On: Show/Hide London Session. New York Session On: Show/Hide New York Session. Sydney Session On: Show/Hide Sydney Sessi
FREE

Upon launching the script, you will need to specify three parameters: the desired Take Profit, an acceptable Loss level, and a Magic number. Following this, a panel with five buttons is generated: Close all trades - regardless of profit or loss. Close only BUY trades. Close only SELL trades. Close trades with profits greater than Take Profit. Close trades with losses exceeding Loss. All closures are performed ONLY based on the specified Magic number. The panel can be moved within the chart windo
FREE

The Oscar, one of my favorite indicators. This is my enhanced Version of it with more options and better visuals. Many different averaging methods Oscar changes color on signal cross, but not too volatile (3% extra threshold) Adaptable Divisor, higher numbers lead to more signals, due to higher fluctuations. Its a fast but quite accurate trend direction indicator. Play around with the settings and make it match to your setup. GL trading Please follow me on Twitter https://twitter.com/semager and
FREE

This indicator draws a price area in which the volume percentage was traded the day before. The chart shows the days with vertical lines and two horizontal lines to indicate the upper price and the lower price of the percentage of volume was traded the day before. The upper/lower lines start and end with the day calculated. But they are referred with the values of the day before. NOT the day in which are. With this indicator you can see where the volume moved in the day before. It uses percenti
FREE

Utilities for MetaTrader 5 - Average Price Calculator Maximize your trading analysis without breaking the bank with our Utilities for MetaTrader 5 - Average Price Calculator, available to you completely free of cost. This tool is meticulously crafted to provide traders with a convenient solution for calculating average prices within the MetaTrader 5 platform. Key Features: Efficient Calculation : Quickly compute average prices to streamline your trading analysis, saving you valuable time and eff
FREE

This indicator emulates volume delta (buy trades vs sell trades) based on per candle volume and candle shape (direction, size of body and wicks). Artificially separated buy and sell volumes then accumulated for specified number of bars. The indicator shows a histogram of volume delta per bar, as well as a sum of the delta for the given period. What is more important, the indicator allows you to combine current symbol quotes/volumes with quotes/volumes of other related symbols (futures, indices,
FREE

THIS IS A CONSTRUCTOR. YOU CONTRUCT YOUR OWN SIGNALS WITH USING THE INPUTS AND THE OPTIMIZER. YOU FIND YOUR OWN VALUES; I DO NOT PROVIDE INPUTS OR FILES. ONLY BUY IF YOU HAVE TESTED AND OPTIMIZED YOURSELF. THIS REQUIRES YOU TO DO SO.
In the labyrinth of the trading world, there existed an algorithmic entity known only as Market Agent Smith. Much like its cinematic counterpart, Market Agent Smith operated with a cold, calculated efficiency that bordered on the surreal. Armed with a complex

Highly configurable Demarker indicator.
Features: Highly customizable alert functions (at levels, crosses, direction changes via email, push, sound, popup) Multi timeframe ability Color customization (at levels, crosses, direction changes) Linear interpolation and histogram mode options Works on strategy tester in multi timeframe mode (at weekend without ticks also) Adjustable Levels Parameters:
Demarker Timeframe: You can set the lower/higher timeframes for Demarker. Demarker Bar Shift: Y
FREE

The MWC COX indicator shows the extreme zones of net short/long positions of the Commitments of Traders Report released by the CFTC once a week for four periods of time. Default settings are periods of 12, 26, 52 and 156 weeks.
Additional Features Displays the sum of all 4 periods in one line MA, MOM and RSI indicators are integrated ( not in the MQL5 Version 1.0 ) Please make sure that you download the MWC_Demo.zip file and unpack it into [...]/MQL5/Files folder. -> www.myweeklycot.com/
FREE

Features
All Ichimoku Signals (Selectable) : Display all reliable signals generated by the Ichimoku indicator. You can choose which signals to view based on your preferences. Filter by Signal Strength : Sort signals by their strength—whether they are weak, neutral, or strong. Live Notifications : Receive real-time notifications for Ichimoku signals.
Transparent Cloud : Visualize the Ichimoku cloud in a transparent manner.
Available Signals
Tenkensen-Kijunsen Cross Price-Kijunsen Cross Pri

The key to success is always good optimisation.
The system has a number of variables and in this case its simplicity is the key to its success. The system looks for the different "Gaps" as market entry failures and then debugs them through a stochastic analysis, i.e. the analysis of two moving averages to see if the price is overvalued or undervalued, and once this is done, the expert advisor will decide whether to perform an action or refrain from performing it. It is a very simple but power
FREE

Tape Reading, monitoramento de fluxo.
FabFlowInPrice é um poderoso indicador para quem gosta de Tape Reading (Times & Trades). Ele apresenta os volumes negociados em cada nível de preço, considerando para cada nível as agressões de compra, de venda e dos diretos. Excelente ferramenta para análise do fluxo de mercado. Pensou em fluxo então monitore quem está agredindo mais, compradores, vendedores ou trocas diretas. O indicador apresenta as informações em 4 períodos distintos e fixos, em qualq

The DYJ SignalSourceOfMACD is based on the MACD indicator. Generally, signals are generated when crossing the MACD and SIGNAL lines of the MACD indicator. Signals to buy are generated if the MACD line crosses over the SIGNAL line in the negative area below the MACD open level. The negative area is where the values of MACD and SIGNAL lines are below zero. The MACD open level parameter is set in pips. However, in the code it is converted as follows: MACD Open level * Instrument.PipSize. For exa

MT4 Version Available Here: https://www.mql5.com/en/market/product/43438
Telegram Channel & Group : https://t.me/bluedigitsfx
V.I.P Group Access: Send Payment Proof to our Inbox
Recommended Broker: https://eb4.app/BDFXOsprey
* Breakthrough Solution For Reversal Trading And Filtering With All Important Features Built Inside One Tool! BlueDigitsFx Spike And Strike Reversal is a mixed oscillator that mixes the readings of a number of indicators, which makes it potential to preci

1. The Expert Adviser is built with a basic, simple and stable trading strategy with a touch of Price Action Principle that is highly effective and accurate for a sniper entry system. The EA have a good money management System.. 2. The expert advisor works best as from 5minutes time frame and above, The higher the time frame, the more accurate is the signal.... 3. The expert advisor work with all broker all currency pair and synthetic indices... 4. Use a reasonable lot size and correct settings
FREE
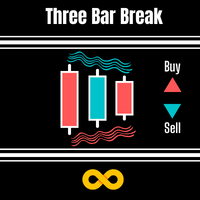
DESCRIPTION 3 Bar Break is based on one of Linda Bradford Raschke's trading methods that I have noticed is good at spotting potential future price volatility. It looks for when the previous bar's High is less than the 3rd bar's High as well as the previous bar's Low to be higher than the 3rd bar's Low. It then predicts the market might breakout to new levels within 2-3 of the next coming bars. Must also be traded during the active hours of the market you want to trade. EG EURUSD 7am - 5pm This
FREE

Introducing “Pass The Prop Firm” EA – Your ace for trading challenges, now with machine learning precision! PropFirmSettings : Safeguard your balance and aim for the stars with tailored profit targets. Prop Firm Balance : Ensure your equity never dips below this threshold. Close All Trades at Profit Target : Automatically secure profits when your goal is reached. Profit Target Percentage : Set your sights on a specific profit ratio. Daily Loss Percentage : Limit daily losses to protect y
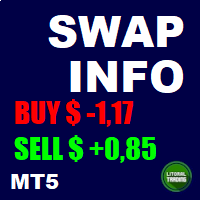
Esta é uma ferramenta em forma de script que informa o swap de todos os pares de moedas (inclusive ouro e prata). É possível destacar os pares com uma moeda específica e se o swap é positivo ou negativo. Além disso é possível complementar o nome dos ativos dependendo da corretora. As informações são exibidas na aba Experts da Caixa de Ferramentas (Ctrl+T). Se tiver alguma dúvida ou sugestão, por favor, contate-nos. Faça bom uso!
FREE

This indicator is a basic RSI but comes up with a useful feature.
You can set zones within the RSI and these zones can be displayed with different background colours. (You can see on the pictures below) You need to set the zone ranges and their colours at the input parameters. Six different zones can be set.
Should you have any questions or comments, feel free to contact me.
FREE
This is a demo version, only 0.01 lot is alowed Full version: https://www.mql5.com/pt/market/product/73259 EA uses the value of the ATR indicator as a decision to open a trade, very useful to trade in the first moment of a big movement, because the ATR indicator is able to track the size of the movements in the period chosen by the user. The user includes the period of the indidacor ATR and the value/size that it is of interest to open a trade, the operation will take place in same direction o
FREE

Are you having trouble with too many events in the economic calendar? This reduces to the minimum number you need. You can filter by country code importance any key words and you can receive alerts before the set time of the event. ++++++++++++++ If country code is blank, display available code on the expert tab. You need to turn off the automatic calendar update setting in MT5. Any sound file of .wav format in Sounds directory. The length of keyword characters is limited by MT5.
FREE

Você é do tipo que gosta de proteger suas operações movendo o stop loss para o ponto de entrada e também usando Trail Stop? Show de bola! Esse EA vai te ajudar nesse sentido. E mais, ele também fecha parcialmente a operação quando oTrail Stop é ativado. É isso aí! Além de tudo isso ele mostra a projeção do stop loss (que você pode mover) e notifica você quando ele é ativado. O EA pode ser usado configurando a janela padrão ou utilizando uma janela personalizada , que facilita a mudança das confi

Nueva entrega en la familia de los Baby EAs: Baby RSI es un EA Experto basado en el indicador RSI. No usa martingala ni grilla, estrategia basada en RSI, Estrategia conservadora. La oscilación relativa del indice del precio o RSI detecta sobrecompras y sobreventas, si estas revierten o hacen Pullback Baby RSI se posicionará a favor de esa corrección de precio, solo si esto ocurre, si no, no. Baby RSI es un Ea muy simple, no necesita mucho más y es una de mis favoritas estrategias automatizadas
FREE

This Tradepanel is an Utility for Traders Who want ot use Basic MoneyManagement for Calculation of Lotsize I have created the basic edition only to give an Overview with Limited Functionality Full Features are available with Auto TradePanel Pro. (This is Only Because it can not be Tested in Strategy Tester ). Complete Description is available at "Auto TradePanel Pro". in This Version Basic Functionality ( Calculation of Lotsize ) open /close Positions is working in the same way as in Pro
FREE
If you prefer manual trading and open multiple trades then this utility is just made for you. This is a simple utility which will close all your open trades at TP1, TP2 and TP3 by the given input percentage. NOTE: - This utility is helpful for multiple trades only (not for a single trade). You can set three Take Profit levels/targets at three Percentages to close trades partially. Inputs Explained: 1. TP 1 Pips - here you can set the first Take Profit Target in Pips for all trades combined. 2.

Arguably THE MOST PROFITABLE SYSTEM..... WITH EXTREMELY ::::::::::TIGHT STOPLOSS::::::: Introduction PRICE of only 399/- (Only the first month)
- Extremely TIGHT STOP LOSS on EVERY TRADE - EXTREMELY HIGH WIN RATIO STILL :::::::::: 90% ::::::::::::: - SUPER HIGH PROFITS ::::::::::: BACK TEST 13 years :::::::::::: See screenshots for Backtest results - QUICK SCALPING ... TIGHT SCALPING...
IS THE HOLY GRAIL of All Systems as it has EVERYTHING - 90% WIN RATE - Super high return -
This indicator will identify when Fast Moving Averages (EMA, SMA, or LW) cross Slow Moving Average lines on any timeframe and with any symbol.
When the moving averages cross and price close above or below the crossing, the User will receive an alert via pop-up, push, or email.
Choose any two Moving Averages to cross to receive an alert and the Indicator will also paint the Moving Average Lines and Arrows.
You can choose Exponential Moving Averages (EMA). Simple Moving Averages (SMA) or Lin

The Commitments of Traders Ratio Indicator is one of these things you never thought about it before you really see the magic behind it. The indicator shows the Ratio of long/short positions released by the CFTC once a week.
If you have a look on the Sreenshot you can see two (three) zones of interest. Important note: MAs are not available in version 1.0. Zone 1: The Switches (Red -> Green, Green -> Red) Zone 2: MA cross Zone 3: If you combine this with the COX indicator an additional zone will
FREE
As traders, we all know that risk management is the most important aspect of profitable trading. So, we need to determine the lot size, every time we need to open a new trade. The FX lot size calculator is a simple tool that will help you to determine your lot size easily without using any third-party service but you will be able to do that by your MetaTrader terminal. LIMITED TIME OFFER: 30$ FOR 10 ACTIVATION.
Inputs:
Maximum_Risk_Prc: To determine your preferred risk%. For example, if your r
FREE

Whether you're a seasoned forex trader or just starting, Telegram Signal Sender is a must-have tool for anyone looking to start their telegram channel as a forex signal provider. With its user-friendly interface and advanced features, you can easily set up your signals and watch as your followers start to grow. So, what are you waiting for?
Comprehensive Trading Solution:
With Telegram Signal Sender, you get a complete trading solution that generates stop loss and three target levels for y

This is a trading EA on M1 Chart for currency pair GBPUSD. I don't recommend you to use in other charts or currency pairs. Backtests are performed at mt5 and my Broker is FxPro. "Works On M1 Chart"; // GBPUSD Strategy Properties Parameters are, LessOrderMoreProfitFactor_Flag = false; // Less Order More Profit Factor (trade is very rare but profit factor is high Entry_Amount = 0.01; // __Amount for a new position [lot] Take_Profit = 800; // __Take Profit [point] Stop_Loss = 650; // __Stop L
FREE

This is a demo version of the Candle Absorption Full indicator. It has limitations on operation. This indicator detects the Engulfing candlestick pattern and draws the corresponding market entry signal.
Features It works only with EURUSD on timeframes M1 and M5. The indicator analyzes a combination of 2 or 3 candlesticks depending on settings. The number of pre-calculated bars (signals) is configurable. The indicator can send an alert to notify of a found signal. Signal can be filtered by sett
FREE

This indicator allows you to visually identify with a different color the candlesticks that exceed a certain limit of the ATR.
Just drag and drop it on the chart.
The user must enter the value of the ATR period.
The user must enter the value of the ATR limit with which he wants to identify the candlesticks.
In the colors tab, the user can select the colors with which to repaint the candles.
It is recommended that the first color always be None.
The second color corresponds to b
FREE

This is a regression tree indicator for MT4/MT5.
This indicator classificate nodes on the time period so that the deviation becomes smaller,
and displays regression line and channel for each node.
It's free!
Attached CartDemo.ex4 and CartDemo.ex5 is a Demo version and has the following limitations:
Method is RandomForest only
Maximum number of bars is 200
Maximum number of trees is 2
Maximum tree depth is 2
Calculated waste lines are shown
Not display correlation coefficients
Fu
FREE

Certainly! Let me provide descriptions for the News Filter tools available on both MetaTrader 4 (MT4) and MetaTrader 5 (MT5) platforms: News Filter for MT4 : Description : The News Filter for MT4 is an expert advisor (EA) template that allows traders to manage their positions during news events. It downloads news data from investing.com without using any external DLLs (Dynamic Link Libraries). Traders can customize their actions based on news releases. Features : Automatic News Detection : The

This powerful tool is designed to help traders identify key reversal patterns in their charts, including the hammer and star bar formations. With this indicator, you can quickly and easily spot these patterns as they form, allowing you to make well-informed trades and potentially increase your profits. The Hammer Start indicator is customizable, allowing you to set your own parameters for identifying patterns and alerts. Whether you're a seasoned trader or just starting out, the Hammer and Star

The value of the MMCCI indicator is calculated based on the "Minors" and "Majors" currency pairs and is based on the original CCI algorithm. This gives us a more accurate result than if we only observed the value of the current currency pair. You can request alerts when the CCI value crosses or returns from the specified level or crosses zero. All settings can be saved in a template. Setting options:
Basic signals that can be enabled separately for the current and the previous candle: Overbou
FREE

Hello and welcome ladies & gentlemen :) this is the MT5 version of this free tool for my lovely people :) It's very simple tool to set Stoploss for your orders or positions within milliseconds whatever how much this orders count , Just drop the EA on the chart that you want to modify the SL for it's orders and fill the INPUTS as the following : - ( Order_Type ) Select the orders or positions types . - ( StopLoss ) Write the SL you want . - ( MagicNumber ) Use magic number 0 for manual cre
FREE

backtester buttons for testing strategies in the MT5 strategy tester.
load up strategy tester then click on visual test and once visual tester opened apply any chart template you'd like. To update the chart pause the visual tester and apply templates, colors and such like the normal chart. On the settings you can choose lot size and take profit and stop loss.
Enjoy
FREE

The indicator is based on the concept of price channels, which are formed by plotting the highest high and lowest low prices over a specified period of time. The Donchian Channel Indicator consists of three lines: an upper channel line, a lower channel line, and a middle channel line. The upper channel line represents the highest high over a specified period, while the lower channel line represents the lowest low. The middle channel line is the average of the two and can be used as a reference f
FREE

The CandleStick Scanner is a tool that allow you to perform a market scan and search any candlestick pattern that you already created in the current chart, You can perform a quick search in the current chart (500 bars will be scanned), This is a lite version of CandleStick Factory for MT5 . The full version video can be found here : https://www.youtube.com/watch?v=fq7pLXqVO94 The full version can be purchased here: https://www.mql5.com/en/market/product/75434
How it works You ca
FREE

A arte do Forex é um novo Expert Advisor complexo que negoceia continuamente em ambas as direcções. Uma série de ordens será aberta para obter o melhor preço médio até que o lucro do take seja atingido. É ideal para obter lucros num mercado imprevisível. Um sistema de cobertura de perdas é integrado para permitir a recuperação das ordens que estão demasiado distantes do preço actual. The best results are on EUR/USD H1 but you can use it on any forex pair and timeframe . Live results

Média Móvel Colorida
Um indicador bastante simples, mas que não pode falta na hora de realizar suas operações. Considerado um dos indicadores mais antigos e indispensáveis para ter no seu gráfico agora com coloração para facilitar ainda mais suas operações. Parâmetros de Configuração: Período Método da Média
Venha conhecer também nossos sinais mql5 https://www.mql5.com/pt/signals/914535?
FREE

This is a Price Projection for Current Candle from Time Frame M15 To Weekly, It's shows Market Trends Teji (Bullish) Or Mandi (Berries). It's Show Teji High & Low for Bullish Market and Mandi High & Low for Berries Market. We can Plan Our Trade in Well Advance for our Current Open Trade. It's Generate New Data for Every New Candle. You are requested to Please Test it with demo Ac before Use in Real Trade. Please Save it to your Mql\Indicator folder and attache to your chart. if any quay Please
FREE

With this indicator you have displayed on the chart the optimal lot size for the forex pair. No need for manual calculations or losing time on websites where you have to input the values to get the optimal lot size. The indicator values are preset for maximum percentage risk is 2% and for maximum pips loss is 50. For a customizable version you can buy using the this LINK . ATTENTION: This only works with forex pairs and it doesn't work on account deposits in YENS!!!!!!
FREE

" Outro " is an expert in automated " multi-symbol " trading that requires the trader to test on the pair of his choice and modify the entries according to his convenience. This Expert Advisor has been designed with non-optimized inputs, and uses a Martingale system for risk management. It is very important to read the blog post before you start. Enter to the private group . Outro uses two main indicators, Relative Strength Index and Stochastic Oscillator , for input decision making
FREE
"All in One" panel. You can simultaneously control: up to 3 symbols; up to 6 periods; up to 31 popular signals. You can see the sum for all signals taking into account the weight of the signal Version for MetaTrader 4: https://www.mql5.com/ru/market/product/27880 Version for MetaTrader 5: https://www.mql5.com/ru/market/product/27830
Parameters NUM_BAR - number of the bar to analyze (set a value greater than 0 to work on closed bars). timeframe_1....timeframe_6 - working timeframes (if set to "
FREE
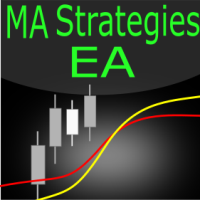
MA strategies EA is a moving average cross EA that can support multiple MA cross strategies that involve two or three moving averages. Purchasing this EA can save you the time taken to automate your existing MA strategy through coding a custom EA and it also helps you discover profitable moving average strategies as its fully compatible with the strategy tester and all settings are editable. The EA supports both scalping, short term and long term strategies. The various supported settings are ex

This EA has been developed, tested and traded live on GOLD (XAUUSD) H4 TF. Everything is ready for immediate use on real account. Very SIMPLE STRATEGY with only FEW PARAMETERS. Strategy is based on TRIPLE EMA BREAKOUT . It enters if volatility raise after some time of consolidation . It uses STOP pending orders with ATR STOP LOSS and TAKE PROFIT. EA has been backtested on more than 15-year long tick data with 99% quality of modeling and verified on 30-year long M1 FUTURES data. Every

The indicator automatically plots significant trend lines and displays buy and sell signals. Signals are generated for reflection and breakdown from support and resistance lines. When a signal appears, the indicator displays it as an arrow of the specified color and also sends the message type specified in the input parameters. In the indicator settings, you can set the signal type, the maximum distance to the trend line, the type of notifications, as well as the settings for lines and ar

Note : i only sell this EA on MQL5, any other sellers is fake. Orbit Rage Final, a cutting-edge trading strategy meticulously designed around the bull/bear candle approach and divergence analysis. This powerful tool is engineered to empower you to shape the life you desire. To embark on this transformative journey, simply download and seamlessly integrate it into your MetaTrader 4 platform by placing it in the experts advisors folder. Orbit Rage Final revolutionizes trading by offering a risk-f

Welcome to the Alone Trading Top!
100% Swing Trading
Build on the very succesfull Gold Trading successful for 10 years.The EA uses multiple confirmation algorithms to find the best entry price and runs multiple strategies internally to spread the risk of the trades. All trades have a stoploss and takeprofit, but also use a trailing stoploss and trailing takeprofit to minimize the risk, and maximize the potential of each trade. The system is build on the very popular and proven strategy: tradi

Daily Range Breakout EA is a breakout strategy with buys when close of current bar is lowest in past N bars and price of next bar is greater than close of previous bar. Condition for sell trades are the opposite. The idea is based on Larry Williams Smash Day strategy. I trade this strategy live and it works in multiple markets. It works best in Daily timeframe. Not Martingale/Grid Strategy. Real result with stop loss. You can reproduce the result for Gold using the default parameters. IMPORTANT!

The Relative Strength Index indicator drawn using a tick chart. After launching it, wait for enough ticks to come. Parameters: RSI Period - period of averaging. overbuying level - overbought level. overselling level - oversold level. calculated bar - number of bars on the chart for the indicator calculation. The following parameters are intended for adjusting the weight of RSI signals (from 0 to 100). You can find their description in the Signals of the Oscillator Relative Strength Index section

A ferramenta é destinada a auxiliar traders que não podem olhar o grafico o tempo todo, ou que utilizam vários gráficos, o trader pode marcar regiões de interesse como suportes e resistencias e assim que o preço se aproximar destas regiões um aviso sonoro e na tela serão apresentados para que o trader tome alguma atitude, além disso a ferramenta pode marcar automaticamente as máximas e mínimas no dia e na hora.
FREE

Dashboard, TP line and Profit/Loss labels are set to false by default for speeding up the optimization. Switch them to True before you start. There are many strategies inside this EA as follows: - Entry based on indicator signal "as shown on the trend indicator " - Opposite to trade entry with opposite martingale - Entries based on " support and resistance indicator ". - Normal martingale - Normal martingale with distance multiplier - Normal martingale with volatility index - Opposite martingal

Abydos B3 é um Expert Advisor do MetaTrader 5 que pode operar em um número variável de estratégias de negociação e mercados em todo o mundo.
Atualmente, existem mais de 10 estratégias de negociação incorporadas já disponíveis para uso (mais por vir), que podem ser utilizadas em quaisquer combinações e ajustadas às suas necessidades. Essas estratégias fazem uso de diferentes indicadores e algoritmos personalizados. Está otimizado para o mercado brasileiro , mas fique à vontade para experimenta

C300 SYNTHETIC INDICATOR 1MIN CHART Update V2 No repaint
*The indicator will not give a sell sign if the market conditions are not in place. *With all 3 strategy criteria in place the strategy based indicator signals 1-3 trades per day. *The drawdown can range to very high you need to place your own target profit and stop loss according to your risk management system . *The indicator is designed for only C300 and the 1min chart .
NB :Note this strategy based indicator will be free only f

This indicator is a zero-lag indicator and displays exact trend as is. True Trend Moving Average Pro works best in combination with True Trend Oscillator Pro that displays strength of trend change.
True Trend Oscillator Pro: https://www.mql5.com/en/market/product/103589
If you set PERIOD input parameter to 1 this indicator becomes a sharpshooter for binary options.
Default input parameters: TT_Period = 10; TT_Meth = MODE_SMA; TT_Price = PRICE_MEDIAN;
Before you buy this product, please
FREE

"Sentiments of traders" in the financial markets is a topic that has been of interest to us for a long time. In time, we could not find the right formula to define these sentiments. We went through many stages in the search for the right methodology - from taking data from external sources to calculate open positions of buyers and sellers to calculating tick volumes, but still we were not satisfied with the results. The calculation of open positions of buyers and sellers from external sources ha
A "simple design" trading panel, which is characterized by small byte size, low CPU usage, simple steps, and quick operation, 1 to 2 clicks to complete a functional operation,
saving time and increasing efficiency . The panel is easy to use, and it is not complicated to set parameters, which is in line with traders' habits. At the same time, its compact-
design, clear at a glance, and comprehensive functions are a powerful tool for manual trading! Key features of the panel:
Click "Bid/Ask

This indicator, It can be applied to any financial assets: forex, cryptocurrencies, metals, stocks, indices . And This indicator base on Golden cross with custom length signal
Settings
FastSignalLength : Length of Fast Signal SlowSignalLength : Length of Slow Signal TimeFrame : Choose time frame to calculate ShowDeadCrossOnly : Show Dead Cross Channel Only ShowSignalMedianOnly : Show signal median line only when ShowDeadCrossOnly set to false alertOn : Send alert alertsOnCurrent : Alert

Hello Gold Seeker , We have a new strategy for finding opportunities in the gold market . This strategy has two system options: non-martingale or martingale . This strategy already includes a stop loss to minimize losses .
Notes for traders: Backtest from the beginning of 2023 until yesterday (08/07/2024) before this EA is released. Backtests have been conducted using "every tick-with real tick" and "random delay". The timeframe used is M5, but you are free to use any timeframe as we have loc

This is a multi-timeframe indicator that detects and displays support and resistance (S&R) lines using the ZigZag indicator.
Features
The support and resistance lines are not redrawing. The indicator is capable of adding new support and resistance levels as they appear. Each S&R line has a tooltip that displays the price level and start time. Save time for multi-timeframe analysis on trades. All types of alerts (sound, pop-up, email, mobile push notification) are available. Working with al

Baby Shark Pro EA works using a series of indicators, mainly the RSI. This is an EA that uses martingale, so use with caution. But Baby Shark Pro EA gives you the ability to change the multiplier parameter, which allows it to decrease the martingale level. Thus, you determine the risk level you want. Unlike most of the other martingale, EA’s This doesn’t place random entries, rather it is riding on market movement RSI > 50. If the market moved the opposite direction after the first entry, th

In the "Masters of Risk" trading system, one of the main concepts is related to places where markets change direction. In fact, this is a change in priority and a violation of the trend structure at the extremes of the market, where supposedly there are or would be stop-losses of "smart" participants who are outside the boundaries of the accumulation of volume. For this reason, we call them "Reversal Patterns" - places with a lot of weight for the start of a new and strong trend.
Some of the im
Master Engulfing is designed with a moving average indicator to see trends, RSI and CCI to see momentum, and engulfing candles for entry points. Master Engulfing is a very accurate expert advisor for gold and all pair currencies. This EA has a lot of tools for entry position, you can make grid/ averaging or single entry, it's your choice.
Requirements :
Currency pair: XAUUSD/GOLD and ALL PAIR CURRENCIES Timeframe: M5 Minimum deposit currencies : $250 ($500 recommended) Minimum deposit gold/

Esta é a versão MT5 Aqui estão vários indicadores que trabalham juntos. Ele basicamente funciona com médias móveis e vários níveis de ATR criando um canal dinâmico através do qual o preço é drenado. Como eu sempre recomendo, você deve experimentá-lo antes de usá-lo ao vivo para que você entenda como ele funciona. O sinal de entrada do mercado é semelhante a outros indicadores de MA, mas com este você também tem uma análise gráfica do momento em que a tendência é encontrada e níveis dinâmicos par
FREE

Santa Scalping is a fully automated Expert Advisor with no use of martingale. Night scalping strategy. The SMA indicator filter are used for entries. This EA can be run from very small accounts. As small as 50 EUR.
General Recommendations The minimum deposit is 50 USD, default settings reccomend for eurusd m5 gmt +2 . Please use max spread 10 if you will not have orders change it to -1. Use a broker with good execution and with a spread of 2-5 points. A very fast VPS is required, preferably w

使用此EA可以通过币安交易所的API连接到MT5交易端,利用MT5强大的量化功能实现交易策略的回测。 操作方法: 1、首先 必须 把( http://api2.0.mt5.vip 、 https://fapi.binance.com )这两个 地址 填写到:mt5——工具——选项——EA交易下的WebRequest列表中,否则所有数据无法同步。 2、在导航栏找到EA,双击之后添加币安的API KEY ,保存后KEY自动保存; 3、KEY保存后会出现交易面板,通过MT5下的订单可以实时展现在面板,同事也可以监控币安交易所是否有同样的订单; 4、交易面板只展示订单的总持仓,请仔细核对,以防止漏单; 5、API KEY会自动保存在本地,第二次打开后无需重复输入; 6、目前只能支持BTCUSDT、ETHUSDT、LTCUSDT合约产品 7、最小交易量以币安的最小交易量为准; 8、币安KEY是存储在本地,不会上传到任何第三方,请放心使用; 9、如果想更换KEY ,请直接在EA内修改即可。
FREE
O Mercado MetaTrader é um site simples e prático, onde os desenvolvedores podem vender seus aplicativos de negociação.
Nós iremos ajudá-lo a postar e explicar como descrever o seu produto para o mercado. Todos os aplicativos no Mercado são protegidos por criptografia e somente podem ser executados no computador de um comprador. Cópia ilegal é impossível.
Você está perdendo oportunidades de negociação:
- Aplicativos de negociação gratuitos
- 8 000+ sinais para cópia
- Notícias econômicas para análise dos mercados financeiros
Registro
Login
Se você não tem uma conta, por favor registre-se
Para login e uso do site MQL5.com, você deve ativar o uso de cookies.
Ative esta opção no seu navegador, caso contrário você não poderá fazer login.