Conheça o Mercado MQL5 no YouTube, assista aos vídeos tutoriais
Como comprar um robô de negociação ou indicador?
Execute seu EA na
hospedagem virtual
hospedagem virtual
Teste indicadores/robôs de negociação antes de comprá-los
Quer ganhar dinheiro no Mercado?
Como apresentar um produto para o consumidor final?
Expert Advisors e Indicadores para MetaTrader 5 - 66

This indicator watch the Fibonacci retracement for levels and timeframes selected by the trader. In the workload of day trading, having your eyes on all the timeframes to validate some information, for Fibonacci traders, is really time consuming and requires constant focus. With this in mind, this tool allows you to have your attention on other trading details while this one monitors the retracements of each timeframe in real time. In the charts, this indicator data (retracement %, age of the r

Indicator that will show your Balance , and your Equity . Really simple to use, no specific requirements to install it. However you can deeply configure it for your own wishes. The pannel has 4 buttons. Only current will display the information of the chart you linked the indicator. If this is deselected, you will have the information of the whole account. Only Buys will display only the BUY orders and Only Sells will display only the SELL orders. Show Zero will display the 0

The program is use to copy trading from MT5 to MT4 and MT5 on local PC or copy over the Internet . Now you can easy copy trades to any where or share to friends. Only run one Flash Server on VPS, also need allow the apps if you turn on Windows Firewall. Can not add more than 20 account copier to server at same time, include both MT4 and MT5 Get free Copier EA for MT4 and MT5 (only receive signal), download here Instants copy, speed smaller 0.1 seconds, easy to setup How to setup and guide
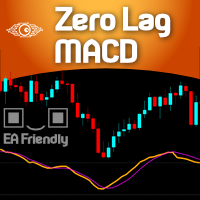
For those who are fans of the traditional MACD ( Moving Average Convergece/Divergence ) indicator, here it is a way faster indicator that could be very useful for intraday trading. Of course it could be used in higher timeframes, with the proper settings. Here at Minions Labs we always encourage traders to calibrate every single indicator you have to extract and distill every drop of good information it has for you. And this is the case with this speedy friend... This Zero Lag MACD could be used

Description The Profit and Loss Indicator by Creative Tech Solutions is a robust and comprehensive tool designed to help traders monitor their trading performance in real-time. This indicator provides detailed metrics on profits and drawdowns, ensuring traders are always informed about their trading activities and performance. With customisable alerts and display settings, this indicator is an essential tool for any serious trader. Features Real-Time Metrics : Monitor profit and drawdown percent
FREE

Um indicador simples e eficiente que plota e atualiza o 50% do dia atual, para aqueles que usam esse ponto como referência no day trade. Em dias de tendência a região de 50% tende a ser um bom ponto de resitência, ideal para realizar novas entradas. Já nos dias sem tendência (laterais) a região do 50% é ótima para realizar as posições. Além disso, para critérios de estudo ou back-testing você pode definir a quantidades de dias anteriores a serem plotados pelo indicador. Para dúvidas ou sugestões
FREE

Double Correlation indicator (free) plots two windowed correlations in a separate window. the size of window is taken as input before the two symbols to correlate to. Two symbols are taken as an input parameters as well as period length. and the two correlations are computed with the currently shown symbol ex: input GBPJPY and AUDNZD. current symbol EURUSD then the following will be computed corr(EURUSD,GBPJPY) and corr(EURUSD,AUDNZD) The indicator can be useful to run a multi-symbol pair trad
FREE

This is a classic trading strategy based on two Moving Averages crossover. customized for usdjpy with a Good risk management strategy RR 1/2 . ( Long when fast MA crosses slow MA from below and Short when fast MA crosses slow MA from above ) TF : 5MIN MAX Lot size to use : 2% e.g : Balance =100 => lot size = 0.02 Balance =1000 => lot size = 0.20 Balance =10000 => lot size = 2
------
FREE
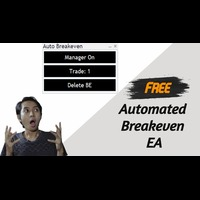
Introducing a powerful MetaTrader 5 Expert Advisor designed to enhance your trading strategy – the Auto Breakeven EA! This feature-rich EA is tailored to bring your stop-loss to breakeven, ensuring a risk-free trade once the market moves in your favor up to a specified price.
Explore the full potential of the Auto Breakeven EA. Download it for free now, and find the download link at the bottom of our page. Elevate your trading experience and take control of your risk management strategy. Happy
FREE

Consecutive candles can give us an indication as to the strength of a trend. With this indicator, you can set the number of consecutive bull or bear candles you wish to be present before achieving a valid signal of RSI crossing into overbought or oversold. With this information, you can better judge if a continuation or reversal situation is about to present. RSI has two settable levels
Interesting settings: Number of consecutive candles needed before a valid signal Overbought level of RSI Over
FREE

Описание стратегии:
Набор торгуемых валютных пар: GBPUSD, GBPAUD, GBPCAD, GBPJPY, EURUSD, EURGBP, EURAUD, EURCAD, EURJPY, AUDUSD, AUDNZD, AUDCAD, AUDJPY, NZDUSD, NZDCAD, USDCAD, USDJPY
В момент открытия рынка после выходных, определяется на каких парах из списка цена прошла от открытия до закрытия недельной свечи более 2000 пунктов и открываем позицию в противоход недельному движению с целью забрать откат в 500 пунктов. Стоп не ставится.
Если цена пошла против позиции, то через каждые 200
FREE
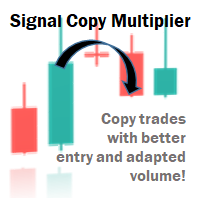
Signal Copy Multiplier automatically copies trades on the same account, for example, to get a better entry and adjusted volume on a subscribed signal. MT4-Version: https://www.mql5.com/de/market/product/67412 MT5-Version: https://www.mql5.com/de/market/product/67415 You have found a good signal, but the volume of the provider's trades is too small? With Signal Copy Multiplier you have the possibility to copy trades from any source (Expert Advisor, Signal, manual trades) and change the volume

MovingInWL O Expert Advisor é projetado para mover o stop das posições abertas para nenhuma perda quando atingem um certo nível de lucro predeterminado. Descrição das configurações do consultor: MagicNumber - identificador do pedido LevelProfit - O nível de lucro em pontos que a posição deve atingir para que seu stop seja movido para o nível sem perda. LevelWLoss - O nível sem perda de pontos, para o qual a posição de parada será transferida após seu lucro atingir o nível de LevelProfit em
FREE

** All Symbols x All Time frames scan just by pressing scanner button ** *** Contact me to send you instruction and add you in "Order Block group" for sharing or seeing experiences with other users. Introduction: The central banks and financial institutions mainly drive the market, Order block is considered a market behavior that indicates accumulation of orders from banks and institutions, then the market tends to make a sharp move(Imbalance) on either side once the order block is
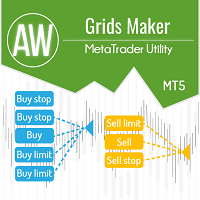
AW Grids Maker is used to build grids from pending orders. The utility is universal, has flexible settings and an intuitive panel interface. The program builds networks from STOP and LIMIT orders with the necessary step, uses the position volume multiplier.
MT4 version -> HERE / Problem solving -> HERE
Benefits: Uses pending orders of all types. Simple and flexible setup. Well-designed and multi-functional utility panel. Thoughtful information module
Features of work:
Suitable for p

The Relative Strenght Index presented to the world in 1978 by J. Welles Wilder Jr. in his book " New Concepts in Technical Trading Systems " is widely used around the world in several ways, not only with the traditional approach of Overbought and Oversold states, which in several cases and depending on the assets and timeframes it just simply doesn't work anymore . BUT, this indicator has its value when used, for instance, looking for divergences between its measuring system and the Prices appea

When creating, modifying and moving a trend line, two anchor points will be selected: high / low, open / close, median or weighted from the candlestick prices.
For high / low, open / close, if the anchor point is above the candlestick, the upper price will be taken, below the candlestick - the lower one. If the point is inside the candlestick, then if the first point is higher than the second, then the first one goes up, the second goes down. Conversely, if the second is higher than the first.
FREE
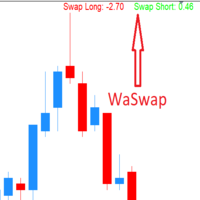
WaSwap MT5 Indicator shows the current Swap Long and current Swap Short with color.
* Set the Swap Threshold and the color to identify when the current swap is below or above the Spread Threshold.
* Set X axis and Y axis and chose the Corner and the Anchor to position the Swap Label on the chart.
* Write the font and the font size for more confort.
* Activate alert if the current Swap Long or the current Swap Short is below the swap threshold.
* The user will never swing with a negative sw
FREE

I present the well-known Moving Average indicator connected to the ATR indicator.
This indicator is presented as a channel, where the upper and lower lines are equidistant from the main line by the value of the ATR indicator.
The indicator is easy to use. The basic settings of the moving average have been saved, plus the settings for the ATR have been added.
Moving Average Parameters:
MA period Shift MA Method
Moving Average Parameters:
ATR TF - from which timeframe the values are taken A
FREE

Painel Boleta com botões BUY (COMPRA À MERCADO), SELL (VENDA À MERCADO) e CLOSE (FECHA TODAS AS OPERAÇÕES). Possui também CAIXAS de quantidade de LOTES, VALORES de STOPLOSS (PERDAS EM PONTOS) e TAKEPROFIT (GANHOS EM PONTOS). Com o Painel Boleta Flash é possivel arrastar o painel pelo gráfico, com um click do mouse, possicionando no melhor local. Para remove-lo do gráfico é só clicar no "x" do painel.
FREE

This is an OLD indicator which was rather efficient to be paired with MA Cross, Bollinger Bands, Dochian Channel and many other strategies and this provides you with market change of BEAR and BULL trends. Since there isn't much listed in MT5 Market, I would like to share my very own indicator for your usage. Please feel free to comment or criticize for better and improvement of the indicator listed.
FREE
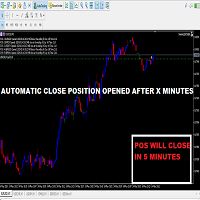
Essa ferramenta Pequena permite definir um contador de tempo em minutos
para o fechamento de suas posições de acordo com o número de minutos que você definiu.
Por exemplo, se você definir 30 Min, a ferramenta fechará cada posição aberta após 30 minutos de sua abertura.
As configurações
ATIVO: É para ativar a ferramenta e usá-la para fechar suas posições após o número de minutos definido.
GERENCIAR: você pode escolher com os símbolos gerenciados pela ferramenta.
Escolha "TODAS AS CU
FREE

The spread in trading is the difference between the purchase price and the sale price of a financial instrument on the market. The spread is a commission fee that traders pay brokers for the opportunity to trade.
It's no secret that each broker offers its own terms for trading. The size of the spread is important. There are a lot of advisors (especially scalpers) who show different results at different brokers. We have repeatedly encountered this. Therefore, using this utility, find out what s
FREE

The one minute chart has a bug, but the one-day chart can still be used after deleting the bug and reloading the indicators, This indicator can be used to determine how far the indicator goes up to place an order to buy, how far it goes down to place an order to sell, and not placing an order until it reaches this distance, which is considered oscillation, open an account gift index
FREE

Introducing our advanced Expert Advisor (EA) meticulously crafted to navigate the forex market using two prominent technical indicators: Moving Average Convergence Divergence (MACD) and Relative Strength Index (RSI). MACD is a versatile trend-following momentum indicator that highlights changes in strength, direction, momentum, and duration of a trend. Meanwhile, RSI is a popular oscillator that gauges the speed and change of price movements, identifying potential overbought or oversold conditio
FREE

A utility indicator which displays account balance of the current account on Chart.
Indicator parameters: Balance_Color : Change the color of the balance text Text_Size : Adjust the font size (8-20) Corner : Select which chart corner to display the text (0=top-left, 1=top-right, 2=bottom-left, 3=bottom-right) X_Offset/Y_Offset : Adjust the position from the selected corner Show_Background : Toggle the background rectangle Background_Color : Change the background color Show_Shadow : Add a shado
FREE

Introduction
One of the patterns in "RTM" is the "QM" pattern, also known as "Quasimodo". Its name is derived from the appearance of "Hunchback of Notre-Dame" from Victor Hugo's novel. It is a type of "Head and Shoulders" pattern.
Formation Method
Upward Trend
In an upward trend, the left shoulder is formed, and the price creates a new peak higher than the left shoulder peak . After a decline, it manages to break the previous low and move upward again. We expect the price to

BeST_Keltner Channels Strategies MT5 is an MT5 Indicator based on the original Keltner Channels Indicator and it can display in the Chart all the known Variations of Keltner Channels and also the corresponding 10 totally Strategies. Every such generally consists of a Central Moving Average Line and two Boundary Bands at a distance above and below it and can be traded mainly in a Trending Mode but also in a Ranging ReEntry Mode.
BeST_Keltner Channels Strategies Indicator Draws definite Buy

Introducing the Scalping Expert Advisor (EA) for Short Trades This Expert Advisor (EA) is meticulously designed for short trades scalping, offering a blend of precision and efficiency to maximize your trading performance. Below, we delve into the key functions and features that make this EA an essential tool for scalpers.
Key Features: Automatic Take Profit (TP) and Stop Loss (SL) Settings: Take Profit Input: Allows you to set a specific TP value, enabling precise control over your exit points
FREE
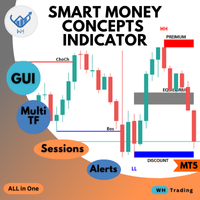
Welcome to the ultimate Smart Money Concepts indicator ,, this indicator is All-in-One package the only thing you need to empower
all the Smart Money Concepts in one place with interactive advanced gui panel with all the features and customization you need. MT4 Version : WH SMC Indicator MT4 *This Price For Limited Number of Copies.
Features: Main Section: User-Friendly Panel (GUI): Designed for traders of all experience levels, the indicator integrates seamlessly into your MT5 platform

Highly configurable Rate of Change (ROC) indicator. Features: Highly customizable alert functions (at levels, crosses, direction changes via email, push, sound, popup) Multi timeframe ability Color customization (at levels, crosses, direction changes) Linear interpolation and histogram mode options Works on strategy tester in multi timeframe mode (at weekend without ticks also) Adjustable Levels Parameters:
ROC Timeframe: You can set the current or a higher timeframes for ROC. ROC Bar Shift:
FREE

SMT (Smart Money Technique) Divergence refers to the price divergence between correlated assets or their relationship to inversely correlated assets. By analyzing SMT Divergence, traders can gain insights into the market's institutional structure and identify whether smart money is accumulating or distributing assets. Every price fluctuation should be confirmed by market symmetry, and any price asymmetry indicates an SMT Divergence, suggesting a potential trend reversal. MT4 Version - https:/

The most sensitive indicator you've ever seen . . .
POscillator is a sensitive indicator to find each trend direction change in every timeframe. It shows price variations and reveals up or down trends. POscillator makes a price curve based on frequency filters. The procedure makes two price functions by using high-frequency and low-frequency filters separately. Then it adds them together to create a smoothed price curve. The final stage of the indicator converts this smoothed curve to an oscil
FREE

Esse indicador utiliza o conceito NR7. Esse conceito diz que se a setima vela for a de menor range, isto é, menor diferença entre máxima e mínima de todas as 7 velas. O indicador marca essa vela com dois marcadores e fica aguardando o rompimento do range composto das 7 velas, isto é, a maior máxima entre as 7 velas anteriores e menor mínima entre as 7 velas anteriores. O indicador é chamado "Timeframe" porque digamos que tenhamos uma sessão de negociação que dura 9 horas, e temos a terceira vela
FREE

The "Moving Average Range Painter" is a robust MetaTrader 5 (MT5) indicator meticulously crafted to illustrate the fluctuating range between an exponential moving average (EMA) and a simple moving average (SMA) on any financial chart. This tool offers traders a comprehensive visual depiction of the price range within which an asset is oscillating. Here's a succinct interpretation of what this range signifies for technical analysis: Trend Dynamics : The range delineated by the EMA and SMA unveils
FREE

Free version. Only works on EURUSD Do you want to always know in a quick glance where price is going? Are you tired of looking back and forth between different timeframes to understand that? This indicator might just be what you were looking for. Trend Signal Multitimeframe shows you if the current price is higher or lower than N. candles ago, on the various timeframes. It also displays how many pips higher or lower current price is compared to N. candles ago. Number N. is customizable The data
FREE

Highly configurable Demarker indicator.
Features: Highly customizable alert functions (at levels, crosses, direction changes via email, push, sound, popup) Multi timeframe ability Color customization (at levels, crosses, direction changes) Linear interpolation and histogram mode options Works on strategy tester in multi timeframe mode (at weekend without ticks also) Adjustable Levels Parameters:
Demarker Timeframe: You can set the lower/higher timeframes for Demarker. Demarker Bar Shift: Y ou
FREE

MMM ADX, P. SAR & MA strategy: As requested by some experienced traders, this EA's strategy uses its 3 built-in indicators to enhance its signals and decide to open a new order at the right time, there is an ADX indicator and you may choose its signal's strength, a parabolic SAR to help and confirm the trends and a MA to check if the prices are deviating from its patterns. By joining the 3 indicators' data, it is possible to calculate a good and strong trend direction, avoiding sudden market mov

The Manual Adjust SL/TP EA streamlines your risk management by enabling you to manually specify new SL and TP price levels for your open positions. The Levels is Price value and is NOT a pips or points distance from the Entry Levels. The EA automatically validates your inputs against the broker’s stop-level requirements (minimum distance) to prevent order adjustment rejections. It offers filtering options so you can choose to apply adjustments only to Buy orders, Sell orders, or both. Key Featur
FREE

The Fractals indicator displays on the chart only fractals with the specified parameters in the indicator settings. This allows you to more accurately record a trend reversal, excluding false reversals. According to the classical definition of a fractal, it is a candlestick - an extremum on the chart, which was not crossed by the price of 2 candles before and 2 candles after the appearance of a fractal candle. This indicator provides the ability to adjust the number of candles before and after t

The profitable Breakout Trading Strategy "Turtle" is a trading strategy that enters into a position when long period highs or lows are broken and exits the position when short period highs or lows are broken. This strategy aims to capitalize on significant price movements that break through established support or resistance levels. The long period highs and lows serve as a signal for a potential breakout, while the short period highs and lows serve as a signal to exit the position before the mom

About This Indicator: RSI vs SMA Oscillator: A Comprehensive Technical Analysis Tool for Better View of Market Price
The RSI vs SMA Oscillator is a powerful technical analysis tool designed to understanding Market Price Fluctuation for buy or sell signals. This user-friendly Oscillator good for both novice and experienced traders, providing valuable insights into market trends and price movements. Key Features: - RSI Cross Alert: The indicator is based on the Relative Strength Index (RSI), a pop
FREE

Best Scalper Oscillator is an indicator for MetaTrader 5 based on mathematical calculations on the price chart. This is one of the most common and useful indicators for finding the trend reversal points. Best Scalper Oscillator is equipped with multiple types of notification (push notifications, emails, alerts), which allows opening trades in time.
Distinctive features Generates minimum false signals. Excellent for identifying trend reversals. Perfect for scalping. Suitable for working on th

A flexible BB indicator You're no longer limited to the built in default of using BB off a SMA method, now you can choose from: SMA - SMMA - EMA - LWMA - ADAPTIVE - FRACTAL ADAPTIVE - DEMA - TEMA - VARIABLE INDEX DYNAMIC
You now also have 2 standard deviation levels. A more featured version is available with 5 deviation levels, color gradients to lines and filling as well as candles, with full alerts too: Bollinger Bands Max MT5
Options: - MTF - 9 choices of MA to base the BB off
- 2 adjustabl
FREE
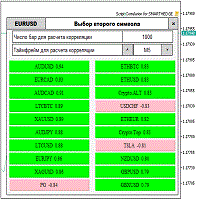
Script for quickly selecting a tool with high correlation. The script is placed on the tool to which you need to select the second correlating one. Then you can change the number of bars to calculate and the timeframe. The script iterates through all available symbols in the market overview and returns the 20 most correlated ones. You can use the selected pairs to trade with THE new SH expert Advisor
FREE

1. The Expert Adviser is built with a basic, simple and stable trading strategy with a touch of Price Action Principle that is highly effective and accurate for a sniper entry system. The EA have a good money management System.. 2. The expert advisor works best as from 5minutes time frame and above, The higher the time frame, the more accurate is the signal.... 3. The expert advisor work with all broker all currency pair and synthetic indices... 4. Use a reasonable lot size and correct settings
FREE

London Pulse EA é um Expert Advisor projetado para operar com a estratégia Daily Range London Breakout , ideal para traders que buscam aproveitar a volatilidade da sessão de Londres. Ele monitora automaticamente as maiores altas e baixas durante a sessão asiática para identificar pontos-chave de rompimento. O EA oferece um calendário semanal Forex , permitindo que os traders considerem eventos macroeconômicos ao tomar decisões de negociação. Além disso, possui um sistema flexível de gerenciament
FREE

This EA provides functions: Start Trading, End Trading, Сlose Order(Time), Pending Order Placement (Time), Tralling stop (automatically according to strategy), trading can be switched off, daily range (strategy), stop loss per day (risk management), Stop loss (risk management), take profit (money management), tracking stop and tracking step (strategy), Risk per order (risk management) and much more!
Customizable settings: At your own risk!! Use preset files from the seller!
EA settings
1: Tr
FREE

1. The principle of UnbalanceEurUsdAud2 intelligent trading system: The three currency hedge unbalanced arbitrage is the extension and continuation of the triangle arbitrage. As a common arbitrage method, triangle arbitrage has been used by many investors in foreign exchange trading. Triangle arbitrage is based on cross exchange rates, which is the basis of triangle arbitrage. The so-called cross exchange rate refers to the price of a non-US dollar currency expressed by another non-US dollar c
FREE

This indicator calculates trend via two different moving averages and draw zigzag trend lines. You can change fast and slow Moving Averages settings for customization. Inputs:
Fast MA Time Period : 64 Fast MA Shift: 0 Fast MA Method: Smoothed Fast MA Apply To: Median Price Slow MA Time Period: 32 Slow MA Shift: 0 Slow MA Method: Smoothed Slow MA Apply To: Median Price ZigZag Color: Red ZigZag Type: DashDot ZigZag Width: VeryThin
FREE

Quantas vezes você já falhou em um desafio de mesa proprietária, ou quantas contas reais você já quebrou?
Nós sabemos o quão doloroso e frustrante esse problema é para os traders. As emoções sempre forçam você a ignorar seu plano, fazem você querer descontar sua raiva no mercado, e suas perdas só aumentam. Depois de tantas experiências ruins, você se sente inseguro , incapaz e com medo de tentar novamente. Sim, nós também já passamos por isso. Hoje você veio ao lugar certo. Este é o TraderLock

Wizard Poverty Sanitizer is a moving average based indicator, using three EMA'S being 2OO EMA which is the slow EMA, the 21 EMA which is the median and the 10 EMA which is the fast. When the median and the fast EMA cross a signal is given, when the fast EMA goes above the Median EMA a buying signal is given and when the fast cross below the median a selling is given. Note that you can change the moving averages to you own choices of moving averages, allowing you to set your own MA strategy. an
FREE

O indicador Hyper Force, originalmente criado em 1984 pelo David Weis, indica em formato de ondas a força da tendência de um symbol. Quanto Maior a onda, maior é a força da tendência. Ondas pequenas quer dizer tendência fraca ou mercado sem tendência. Em uma onda, quanto maio a diferença entre uma barra e outra, mais forte é a tendência. Quando a distância entre uma barra e outra começa a diminuir, quer dizer que a onda começou a perder a força de tendência. Portanto pegar a onda com a força for
FREE

Volume Flow Binance! Já imaginou ter acesso ao times and trades da sua criptomoeda preferida, com detalhes sobre o fluxo de volumes e análise de movimentação de preços, mesmo que sua corretora não ofereça acesso ao histórico completo de negociações? Com o Volume Flow Binance , isso agora é realidade! Este script em MQL5 foi desenvolvido para traders de criptomoedas que buscam uma visão detalhada das dinâmicas do mercado em tempo real. Características Principais: Acesso direto ao t
FREE

Versão MT4: https://www.mql5.com/en/market/product/121289
Versão MT5: https://www.mql5.com/en/market/product/121290
O script "Logótipo" foi concebido para exibir um logótipo ou imagem personalizada como fundo num gráfico de negociação no MetaTrader 5 (MT5). Este script permite aos traders personalizar os seus gráficos com logótipos ou quaisquer outras imagens desejadas.
Como funciona:
Preparação da imagem:
Comece por selecionar a imagem que pretende exibir como logótipo no seu gráfico.
FREE

This is the Full Version, to get the free version please contact me.
The free version works on “AUDNZD” and “XAUUSD” charts.
All symbols and time frames scanner
Head and Shoulder
One of the most popular Price Action patterns is the Head and Shoulders pattern. The pattern has three local tops that resemble the left shoulder, head, and right shoulder. The head and shoulders chart pattern appears in all kinds of markets, including Forex, cryptocurrency, commodities, stocks, and bonds. The head

Indicador de Spread para MT5 - NS Finanças. (http://www.nsfinancas.com.br) Ferramenta auxiliar para dar visibilidade do Spread para todos os tipos de pares de moedas e também timeframes. Os labels são bem posicionados ao canto superior direito do gráfico para não atrapalhar a visualização durante o trade, porém também é possível arrastar o indicador para o melhor lugar da sua tela. Além do spread atual, este indicador também monitora o spread mínimo, máximo e média do par de moeda selecionado, a
FREE

This Price indicator aid you to read prices of a bar without using native MT5 instuments like crosshair.
The indicator gives you the OPEN HIGH LOW CLOSE and 50% bar prices of the current or one of the previous bar.
Parameter setting are: TimeShift: Used for bar selection (0 stand for current 1 for previous 2 for 2 bars ago) Other parameter are using for esthetics. Each Label can be moved away from its initial position.
FEEL FREE TO REPORT BUG AND REVIEW THIS INDICATOR. THANKS
FREE
A comprehensive MT5 trading performance indicator designed to provide real-time analytics of your trading activity on chart.
Key Features: - Dual tracking modes: Chart Symbol or Magic Numbers - Customizable display with toggle options for each metric - Adjustable font size for better visibility - Real-time updates with color-coded results
Performance Metrics: - Total Profit/Loss: Track overall performance - Total Trades: Monitor trading frequency - Win Rate: Measure trading success percentage
FREE

The Oscar, one of my favorite indicators. This is my enhanced Version of it with more options and better visuals. Many different averaging methods Oscar changes color on signal cross, but not too volatile (3% extra threshold) Adaptable Divisor, higher numbers lead to more signals, due to higher fluctuations. Its a fast but quite accurate trend direction indicator. Play around with the settings and make it match to your setup. GL trading Please follow me on Twitter https://twitter.com/semager and
FREE
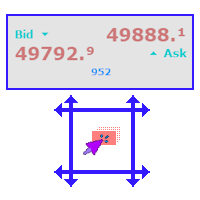
A simple and functional Current Price Panel that shows magnified Bid, Ask and spread price, that can be moved by using the mouse, to any location of the chart window. The functionality included are: Customize Current Price Panel Contents shown on Panel Width and Height, Row and Column gap. Background color, background transparency and border color. Font, its size and color. Move the panel to any location of chart window. Option to show current spread as pips or points. Highlight spread in differ
FREE
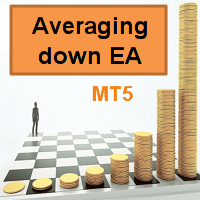
Este consultor especialista (EA) de cálculo de custo médio coloca negociações adicionais na mesma direção que a ordem original (aberta manualmente) quando o preço vai contra você. Pode ser usado como um sistema de grade ou como sistema de martingale puro (aumento exponencial do tamanho do lote) ou martingale suavizado (por exemplo, aumento linear do tamanho do lote). Devido ao risco envolvido, este EA é mais adequado para traders intermediários a avançados que estão bem cientes de como lidar com

Este indicador de vários símbolos foi projetado para identificar automaticamente quando o preço atinge os principais níveis psicológicos. Também conhecido como números redondos, números inteiros ou níveis-chave. Como um bônus, ele também pode verificar o nível do ponto de pivô em um período de tempo selecionado. Combinado com suas próprias regras e técnicas, este indicador permitirá que você crie (ou aprimore) seu próprio sistema poderoso. Recursos Pode gravar os sinais em um arquivo que pode se

FLAT ADVANCED TREND V1.5 – Identifica Tendencias con Precisión Profesional Flat Advanced Trend es tu solución definitiva, Combina el poder del ADX, ATR y RSI en una herramienta visualmente intuitiva y fácil de usar, diseñada para traders serios. Características Clave: - Detección inteligente de tendencias – Filtra el ruido del mercado usando ADX + DI/DI- y muestra solo señales confiables.
- Filtros avanzados – Incluye ATR para volatilidad y RSI para momentum (personalizab
FREE

Multi Diver EA trades symbols from Marketwatch . The strategy is based on the daily ranges and also on the RSI indicator. Risk management as well as breakeven and trailing stop accompany your positions and protect you from larger losses! You can use an indicator filter to weed out unwanted symbols. EA has been tested in EURUSD, USDCAD, USDJPY, XAUUSD and US30 H1 in the strategy tester and defaulted to these symbols. Please suggest your ideas in discussion. I will implement this as quickly as pos
FREE

SmartDataExportEa – Sua ferramenta definitiva de exportação de dados para MetaTrader 5
Explicação do EA (EA Explanation) SmartDataExportEa é uma ferramenta especializada na exportação de dados para MetaTrader 5. Este EA não realiza nenhuma operação de negociação; em vez disso, foca em exportar dados de mercado e valores de indicadores importantes em formato CSV. É ideal para traders ou desenvolvedores que desejam otimizar a análise de dados e o desenvolvimento de estratégias.
Compatibilidade
FREE

A video talks better than many images. We've back tested Fedor, our " last Emperor" Expert Advisor, on the top traded currency pairs (EURUSD, GBPUSD, JPYUSD), on Stocks Indices (Nasdaq 100, S&P 500), on single stocks and even on commodities (Gold, Oil). We've backtested 15min, 30min, 1H timeframes for the last 20 years. Download the demo version and test it Yourself. Just choose a market, a time frame and a fixed lot size per trade (eg: base_lots=0.01) or a leverage multiple of the account bala

Simple Schaff Trend Cycle System. Configurable number of trades openened on trigger. Choose to include a trade which has no Take Profit but closes with trailing candles high/lows. Trades are always opened above/below the prev. closing candle (see pending pips) RSI and EMA as a bias/confirmation. Use the strategy tester to get your own setup per market. Use of fixed fibnumbers won't let you over-optimize. Best to be used 1H / 4H depending on market. It will mark any trade with a vertical red/gre
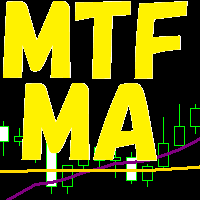
3つの時間軸を分析に使います。 3つの時間軸が、全て同じ方向になった場合、上昇方向または、下降方向になった場合 その方向にエントリーをします。 決済は、上記同様全て同じ方向になった場合、上昇方向または、下降方向になった場合 その方向に決済をかけます。
時間軸は、変数として定義されています。 移動平均も、各変数として定義されています。
基本的に、単発ポジションをもち、追加購入はしません。 途中決済は、手動で行うことも可能です。 その場合、EA内では、ポジションなしとして処理されます。
ロット数、利益確保、ストップロスも変数として設定できます。
使用する前に、最適化等を行ったほうが精度をあげてトレードできると思います。 また、100%任せきりにするのは、おすすめしません。
FREE
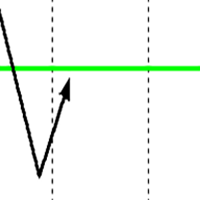
The Reversal Area EA is designed to identify likely price ranges for price to turn from. This EA is used in conjunction with other EA's that I developed and serves as filtering tool to keep from entering too early. The overall idea is to be a buyer below the green line. A seller above the green line for the sell version. The second thing to keep in mind is time. When price fluctuate over the course of a few days and move further below this zone (long bias) it offers greater likelihood of settin
FREE
O Mercado MetaTrader contém robôs de negociação e indicadores técnicos para traders, disponíveis diretamente no terminal.
O sistema de pagamento MQL5.community está disponível para todos os usuários registrados do site do MQL5.com para transações em todos os Serviços MetaTrader. Você pode depositar e sacar dinheiro usando WebMoney, PayPal ou um cartão de banco.
Você está perdendo oportunidades de negociação:
- Aplicativos de negociação gratuitos
- 8 000+ sinais para cópia
- Notícias econômicas para análise dos mercados financeiros
Registro
Login
Se você não tem uma conta, por favor registre-se
Para login e uso do site MQL5.com, você deve ativar o uso de cookies.
Ative esta opção no seu navegador, caso contrário você não poderá fazer login.