Conheça o Mercado MQL5 no YouTube, assista aos vídeos tutoriais
Como comprar um robô de negociação ou indicador?
Execute seu EA na
hospedagem virtual
hospedagem virtual
Teste indicadores/robôs de negociação antes de comprá-los
Quer ganhar dinheiro no Mercado?
Como apresentar um produto para o consumidor final?
Expert Advisors e Indicadores para MetaTrader 5 - 56

O WA Order Block FVG bos MT5 é um indicador com base no estudo de SMC (Smart Money Concepts) criado pelo ICT Inner Circle Trader, eleplota no seu gráfico as informações de Order Blocks em 3 tempos gráficos diferentes, fair Value Gaps e Regiões de Liquidez além do BOS ( Break os Structures), tudo em um só indicador. Dessa forma você não precisa colocar essas informações de forma manual. Agora você tem tudo isso de forma automática em seu gráfico.

The indicator is designed for displaying the following price levels on the chart: Previous day's high and low. Previous week's high and low. Previous month's high and low. Each of the level types is customizable. In the indicator settings, you set line style, line color, enable or disable separate levels.
Configurations ----Day------------------------------------------------- DayLevels - enable/disable previous day's levels. WidthDayLines - line width of daily levels. ColorDayLines - line
FREE
Coppy Master MT5 is a powerful and versatile copier for the MetaTrader 5 platforms, designed to support trade copying across different types of accounts: from MT5 to MT4, MT4 to MT5, as well as between MT4 and MT5 accounts. It ensures high-speed trade transfers, minimizing delay to 0.5 seconds, making it an ideal solution for synchronizing multiple trading accounts. [ DEMO ] [ Instruction ]
For the copier to work correctly, all terminals (MT4 / MT5) must be running on the same computer or V

O Índice de Força Relativa (RSI), desenvolvido por J. Welles Wilder, é um oscilador de momento que mede a velocidade e a mudança dos movimentos de preços. O RSI oscila entre zero e 100. Adicionamos ao conceituado indicator RSI vários tipos de alertas e um filtro de intervalo entre os sinais para ser incorporado em rôbos. *Funciona em todos os timeframes e instrumentos.
Funcionalidades do produto
E-mail alert Alerta Sonoro Push Notificação (Alerta pode ser enviado ao seu celular) Sinais no cha
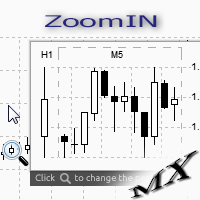
The ZoomIN MT5 indicator is designed for quickly viewing the selected bar on the smaller timeframes in a pop-up window. Once launched, the indicator works in the background, does not take up space on the chart and does not consume system resources. When the indicator is activated by the Shift + i combination (can be changed in the settings), a pop-up window with a chart of a smaller timeframe is created. The displayed timeframe can be changed by a left-click on the magnifying glass icon. To hide
FREE

O indicador imprime a linha da média longa quando as médias media e curta estão confinadas dentro dos limites de 1 ATR (average tru range) da média longa. Após períodos de congestão os preços se movimentam fortemente em uma direção. Este indicador não fornece pontos de entrada, apenas mostra que as médias estão bastante próximas. Parâmetros: Periodmalongo: Período da média longa. Periodmamedio: Período da segunda média. Periodmamedio2:Período da terceira média. Periodmacurto: Período da média cu
FREE

The Volume Spread Analysis indicator is based on the original Volume Spread Analysis method. It was designed for quick and easy recognition of VSA patterns. Even though this indicator looks very simple, it is the most sophisticated tool we've ever made. It is a really powerful analytical tool that generates very reliable trading signals. Because it is very user-friendly and understandable, it is suitable for every type of trader, regardless of his experience.
What is VSA? VSA - Volume Spread A

ESTE VOLTOU À VERSÃO SIMPLES SEM RECUPERAÇÃO DEVIDO À COMPLEXIDADE E CONFUSÃO DOS UTILIZADORES NA OTIMIZAÇÃO. SE COMPROU A VERSÃO ANTERIOR ABAIXO DE 15 COM RECUPERAÇÃO ENTÃO NÃO UTILIZE 15. TENHO DE DECIDIR ENTRE A VENDA E O FEEDBACK DOS UTILIZADORES. SE FOR MUITO COMPLEXO OS UTILIZADORES NÃO O UTILIZARÃO.
OTIMIZE EA ANTES DE TESTAR E UTILIZAR. SÓ COMPRE SE TIVER OTIMIZADO. Isto é para traders que sabem como otimizar e desejam ser rentáveis por mérito próprio. VOCÊ DEFINE OS SEUS PARÂMETROS D

Announcement: All EAs (Expert Advisors) from QuanticX are currently available for free, but only for a limited time! To enjoy a Lifetime QuanticX support and continue receiving free EAs, we kindly request you to leave a review and track the performance of our EAs on Myfxbook. Additionally, don't hesitate to reach out to us for exclusive bonuses on EAs and personalized support.
Pillartrade by QuanticX Welcome to Pillartrade - Your Long-Only Trading Ally for US500 Join the forefront of financial
FREE
The Complex Chaos EA is an automated system that uses a pair of exponential moving averages to detect the market direction and opens trades on candle open. If the market moves against a trade it will at a set distance open another trade in the same direction to move the take profit of the group of open positions closer to the current price and make the group of trades winners overall once the price reverses. If a change in direction is detected then all trades are closed and it starts trading in
FREE
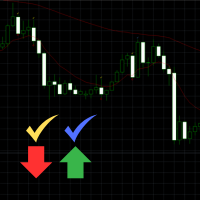
Engulfing Signal Indicator with EMA Confirmation This indicator is made to identify engulfing candlestick patterns in real-time using a mathematical approach and a constant bar-checking loop. It highlights these patterns as they occur, offering visual cues and confirmation when aligned with specific market conditions. How it works: Engulfing Pattern Detection : The indicator identifies engulfing candles using a division factor. A candle is considered engulfing if the entire range (body + wicks)
FREE

The fractal indicator shows the latest support and resistance levels. If the price breaks through the level and is fixed, the indicator draws a rhombus of yellow or crimson color signaling a possible continuation of the movement towards the breakdown.
Indicator Settings:
- BarCount: sets the minimum number of bars required to build a fractal.
It is better to use the indicator in conjunction with other indicators.
FREE

The ICT Silver Bullet indicator is inspired from the lectures of "The Inner Circle Trader" (ICT) and highlights the Silver Bullet (SB) window which is a specific 1-hour interval where a Fair Value Gap (FVG) pattern can be formed. A detail document about ICT Silver Bullet here . There are 3 different Silver Bullet windows (New York local time):
The London Open Silver Bullet (3 AM — 4 AM ~ 03:00 — 04:00)
The AM Session Silver Bullet (10 AM — 11 AM ~ 10:00 — 11:00)
The PM Session Silver Bullet (

Supply Demand Ribbon is an indicator with moving supply and demand lines that help you identify price zones more easily. The indicator helps you determine flexible entry, stop loss, and take profit areas. There are also strategies for algorithmically changing ribbon colors. From there you can come up with many trading strategies for yourself! You can explore many feature in Advanced version here !
MT4 Version: Click here! You can combine it with our indicators below to make your trading
FREE

This tool for the MetaTrader 5 trading platform allows setting the stop loss of open positions to breakeven (entry price) plus an adjustable distance in points. The stop loss is only adjusted if the position is already in profit.
Main functions:
Button: A button is displayed on the chart with the text "StopLoss to BreakEven". The color of the button can be customized, by default it is red.
User interaction: When you click the button, for all open positions that are in profit, the stop loss i
FREE

The MetaCOT 2 CFTC ToolBox Demo is a special version of the fully functional MetaCOT 2 CFTC ToolBox MT5 library. The demo version has no restrictions, however, unlike the fully functional version, it outputs data with a delay. The library provides access to the CFTC (U.S. Commodity Futures Trading Commission) reports straight from the MetaTrader terminal. The library includes all indicators that are based on these reports. With this library you do not need to purchase each MetaCOT indicator sepa
FREE

Es un indicador que no se repinta y que muestra la tendencia a corto plazo. contiene lo siguiente: Visual Mode MA Period MA Method MA Price
ATR Period Volatility Factor Offset Factor Use Break Use Envelopes Use Alert
cualquier sugerencia hagamelo saber en los comentarios y también colocar estrellas para postear más contenido, indicadores y advisor actualizadas
FREE

40% off. Original price: $50 Support and Resistance Dashboard for MT5 is a multi-timeframe and multi-symbol scanner and alert system that finds S/R zones and pivot points for all timeframes and symbols and alerts when price has interaction with them. If you are using support and resistance (or supply and demand) zones in your trading strategy, this dashboard and its alert and filtering system is a big time saver for you. Download demo version (works on M4,M5,M6,M12,H3,H8 timeframes) Full desc

This library allows you to automatically filter events by symbol. Additionally, it requires the use of "flags" to classify events based on their importance (high, low, etc.). Properties: Our library is simple and only requires the export of four functions to work properly. Requirements: The library uses OnTimer , so it is not compatible with programs that also use this event. If your bot utilizes OnTimer , this may interfere with the library’s functionality and prevent event filtering. We recomm
FREE

Telegram Controls (Telecontrol) — realiza a comunicação entre o bot Telegram e o terminal MetaTrader 5 . Ajuda a agregar dados de vários terminais e gerenciá-los usando um bot no Telegram . O serviço é conveniente para trabalhar em múltiplos terminais MT5, permitindo configurar individualmente cada terminal para uma exibição otimizada e melhor percepção das informações. Todos os dados dos terminais são reunidos em um único canal do Telegram, e o painel de configurações permite ajustes rápidos e
FREE
XXXX ATR (Average True Range) Position Manager: ATR StopLoss, ATR Target, ATR Breakeven, ATR Trailing StopLoss, with Risk % Calculation / Position.
Fully automated advanced ATR EA is now available:
https://www.mql5.com/en/market/product/94895
Key takeaways One click does it all: SELL and BUY button automatically places ATR stoploss, ATR target, ATR breakeven, ATR trailing stop and Risk % calculation of equity Entire position is calculated based on ATR No more manual position calculations
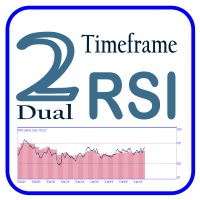
Dual Time Frame RSI with Custom Alerts & Visuals Dual Time Frame RSI is an advanced RSI (Relative Strength Index) indicator designed for traders who want to monitor multiple timeframes simultaneously and customize alerts and visuals for better trading decisions. This tool allows you to combine two RSI readings from different timeframes, helping you identify stronger trends and overbought/oversold conditions across multiple time horizons. Key Features: Two Timeframes : The lower timeframe is alwa
FREE

MyHistogram MT5 O indicador MyHistogram é uma ferramenta de análise técnica poderosa projetada para ajudar os traders a visualizar a distância entre os extremos de preço e uma média móvel. Ao calcular e exibir essa distância em um formato de histograma, o indicador MyHistogram permite que os traders avaliem rapidamente as tendências do mercado, identifiquem reversões potenciais e tomem decisões de negociação mais informadas. O indicador MyHistogram é altamente personalizável, permitindo que os u
FREE

Highly configurable Volume indicator.
Features: Highly customizable alert functions (at levels, crosses, direction changes via email, push, sound, popup) Multi timeframe ability Color customization (at levels, crosses, direction changes) Linear interpolation and histogram mode options Works on strategy tester in multi timeframe mode (at weekend without ticks also) Parameters:
Volume Timeframe: You can set the lower/higher timeframes for Volume. Volume Bar Shift: you can set the offset of the l
FREE

An expert based on artificial intelligence ( AI )
For EURUSD in time frame 15 and 30 minutes, 1 and 4 hours and daily
With Relatively large number of signals
(To receive all the signals: activate the full trade option in the settings and run the expert at the same time in several time frames)
Has a TP and a SL
Without the use of dangerous strategies such as martingales and hedges
Symbol
EURUSD
Time frames
M15 , M30 , H1 , H4 , D1
Minimum Deposit
50$
Brokers
Any broke
TradeFlow Dashboard MT5 representa uma mudança de paradigma na gestão comercial, oferecendo uma solução robusta e versátil feita sob medida para elevar suas estratégias de gestão de risco e agilizar a tomada de decisões dentro da plataforma Meta Trader 5. Com a sua interface elegante e fácil de utilizar, esta ferramenta transcende a experiência de negociação convencional, atendendo especialmente aos traders manuais que procuram amplificar o seu desempenho.
Vamos nos aprofundar nos principais d
FREE

HM (Horizontal Markup) é projetado para marcação manual de níveis horizontais. A marcação contém o nível e seu valor de preço. A espessura e a cor da linha e do valor do preço são definidas nas Configurações. Os níveis podem ser colocados localmente em timeframes ou expostos publicamente para todos os timeframes.
Seu trabalho é muito simples:
1) - Pressione a tecla que você definiu nas configurações para marcar o nível;
2) - Coloque a linha no local desejado;
3) - Clique com o botão direit
FREE

Данный индикатор показывает объем каждого бара (видимый диапазон) в пунктах. Гибкие настройки отображения значений. Возможна настройка параметров показа. Индикатор создавался для личного пользования, анализа графиков. Параметры: Color - цвет текстовых меток; Position - позиция метки: 0 - снизу, 1 - сверху; FontSize - размер шрифта; Angle - угол наклона текста; GapPoints - отступ по вертикальной оси.
FREE
The Buffer Reader will help you to check and export the custom indicators buffers data for your current chart and timeframe. You can select the number of buffer and historical bars to read/export. The data can be exported in a CSV format and the files will be stored in the folder: \MQL5\Files .
How it works Put the number of buffers to read in the Buffers_Total input parameter. Put the number of rows to display in the Rows_Total. Choose the CSV separator in the parameter. Copy the correct nam
FREE

O Indicador de Médias Móveis Exponenciais (Duplas ou Triplas) Envelopes é uma ferramenta de análise técnica projetada para ajudá-lo a identificar tendências e possíveis pontos de reversão no mercado financeiro. Este indicador oferece aos traders a flexibilidade de escolher entre dois tipos de médias móveis exponenciais: a Média Móvel Exponencial Dupla (DEMA) ou a Média Móvel Exponencial Tripla (TEMA).
Recursos Principais:
Duplas ou Triplas Exponenciais: Alterne entre DEMA e TEMA com base em sua
FREE

This is a multi-timeframe indicator that detects and displays support and resistance (S&R) lines using the ZigZag indicator.
Features
The support and resistance lines are not redrawing. The indicator is capable of adding new support and resistance levels as they appear. Each S&R line has a tooltip that displays the price level and start time. Save time for multi-timeframe analysis on trades. All types of alerts (sound, pop-up, email, mobile push notification) are available. Working with all p

King Trader EA is based on candlestick formation and trading time. King Trader EA's strategy to recognize the candle formation and position yourself approximately 5 minutes after the opening of the New York Stock Exchange. The positions that are in plus are accompanied by additional purchases and tight traillingstop! EA was tested in EURUSD, GBPUSD, USDCAD, USDJPY and XAUUSD H1 in the strategy tester and defaulted to these symbols. Please suggest your ideas in discussion. I will i
FREE

In previous products , we have published an indicator of this strategy, but now we offer you an Expert Advisor to make it easier for traders
The procedure is whenever the price or the candle (depending on entry condition in the "Inputs" section, "Touch_Line", or "Close_Candle"), hits the Moving Average, the EA will open a position buy/sell automatically based on the volume, SL and TP that you specify in the " Inputs " section.
You also can define the direction of the positions, Buy, Sell, or

Indicador Multiple Regression Indicador faz o plot da Curva de Retorno e dos canais superior e inferior de uma regressão para os preços de fechamento do ativo do gráfico. A Curva de Retorno é a linha central do indicador e representa a região de equilíbrio do preço entre vendedores e compradores. Nesse indicador o usuário escolhe o tipo da regressão podendo ser de 3 tipos: primeiro grau, segundo grau ou terceiro grau. Os plots do indicador são: Linha central – cor padrão preta; Linha superi
FREE

Smart Invest Basic (EA) employs an averaging strategy designed for long-term profitability with low risk. It operates by initiating trades and setting take profit levels. If the market quickly reaches the take profit point, it opens another trade upon the next candle's opening. Conversely, if the market moves against the trade, it employs an averaging technique to secure more favorable prices. The EA's primary approach involves using smaller lots to prevent significant drawdown during averaging,

The indicator is based on Robert Miner's methodology described in his book "High probability trading strategies" and displays signals along with momentum of 2 timeframes. A Stochastic oscillator is used as a momentum indicator.
The settings speak for themselves period_1 is the current timeframe, 'current' period_2 is indicated - the senior timeframe is 4 or 5 times larger than the current one. For example, if the current one is 5 minutes, then the older one will be 20 minutes The rest of the s
FREE

Market Heartbeat is in your hand! Introduction The Market Heartbeat indicator with a special enhanced algorithm (volume, money flow, cycle of market and a secret value) is a very repetitive trend finder with a high success rate . Interestingly, this Winner indicator indicates that the trend has changed its direction or the end of a trend retracement or even appears at the range market. The Market Heartbeat can use in scalping trading or trend trading. It finds immediately with alarm, n

Unleash Your Trading Potential with Market Maverick IV : The Intelligent Edge You've Been Waiting For! Tired of staring at charts? Overwhelmed by complex strategies? Whether you're taking your first steps into the world of trading or you're a seasoned pro seeking an undeniable advantage, Market Maverick IV is engineered to be your ultimate trading ally. Here's why traders just like you are choosing Market Maverick IV: For Trading Newcomers: Your Effortless Entry into the World of Profitabilit

Mini One for All Trend Scanner is a trend following multi-symbol indicator that can be used with any input: forex, stocks, commodities,... The panel shows three indicators and six symbols with the trend for every pair (symbol/indicator): up, down or no trend. The indicators are: Average Directional Movement Index (ADX) Moving Average Convergence Divergence (MACD) Relative Strength Index (RSI) You can change quickly the chart by clicking any one of the symbol button in the panel. This feature
FREE

//////////////////////////////////////////////// //////////////////////////////////
An improved version of the standard Bulls Power and Bears Power indicators.
Now it's two in one.
The setup is simple - you just need to specify the period. It is also very easy to understand the readings of this indicator, a signal above zero is a buy, and below it is a sell.
//////////////////////////////////////////////// ///////////////////////////////////
I hope this indicator will be very useful to you
FREE

Ao executara ordem, seja ela pela boleta do metatrader no computador ou pelo metatrader no celular, seja ordem manual ou pendente,
o Easy Trade irá posicionar os níveis de take profit e stop loss, bem como uma ordem limit e seus respectivos take profit e stop loss de forma automática.
Seguindo a estratégia de negociação para abertura de Bolsa (us30, us100,us500) porém, pode ser ultilizada em quaisquer ativo do mercado.
FREE

This indicator is a zero-lag indicator and displays exact trend as is. True Trend Moving Average Pro works best in combination with True Trend Oscillator Pro that displays strength of trend change.
True Trend Oscillator Pro: https://www.mql5.com/en/market/product/103589
If you set PERIOD input parameter to 1 this indicator becomes a sharpshooter for binary options.
Default input parameters: TT_Period = 10; TT_Meth = MODE_SMA; TT_Price = PRICE_MEDIAN;
Before you buy this product, please do t
FREE

ATR Accelerator Indicator informs you about strong price movements based on the ATR Indicator. This Indicator works for all Timeframes and Symbols, the strength of movements can be configured.
Important: Get informed about new Products, join our MQL Channel: https://www.mql5.com/en/channels/etradro
Useage This Indicator works for all Timeframes and Symbols, the strength of movements can be configured. Features works on all timeframes and forex pairs or indices. Alert and Notify function inc
FREE

Trend Reversal alert: The concept of the EA is to give you a message/alert when something happens in the market, so you will never pass a tradechance for a trendreversaltrade. The EA give you the message when the chance is higher for a trendreversal, but it is important to say that this doesn`t mean that you should trade every signal. The advantage provided by the program is that you don`t need to sit the hole time for the PC and look at the chart because you get a message when a good trendrever
FREE

'Circle Rising Point' is an indicator based on the cycle theory. No matter whether your trading cycle is short or long, you can use this indicator to find the rise and fall points of different cycles and different bands. Therefore, the signals displayed to you on charts of different cycles are different, and applicable to left side transactions. This indicator is recommended to be used together with the multi cycle window for analysis. Indicator introduction Applicable products This indicator is
FREE

Este indicador irá desenhar duas linhas para representar o valor do ajuste, podendo ser utilizado tanto no Dólar quanto no Índice. A principal vantagem desse indicador é que ele possui duas linhas, sendo uma representa o ajuste calculado do dia anterior e a outra representa o ajuste calculado justamente no dia atual. O cálculo do ajuste no dia atual é um grande diferencial, uma vez que será possível fazer operações de forma a dormir comprado ou vendido de acordo com o ajuste. Não é necessário n
FREE

BB Smart Trader - Gold Expert Advisor Overview BB Smart Trader is a powerful and fully automated Expert Advisor (EA) designed specifically for trading Gold (XAUUSD) . This EA leverages the Bollinger Bands strategy to identify high-probability trade setups, ensuring optimal risk management and profitability . With proven backtest results from 2021 until now , BB Smart Trader has demonstrated consistent performance in different market conditions. New Updates: Added Lot Type Selection : C
FREE

Introducing StochEAstic: an advanced Expert Advisor utilizing the stochastic indicator to provide precise market entry and exit signals. Engineered with sophisticated algorithms, this EA empowers traders to effectively control risk and maximize profit potential. With StochEAstic, traders can customize their trading strategies according to their individual preferences. From adjusting stochastic indicator parameters to setting specific risk levels, this EA offers flexibility and complete control o
FREE
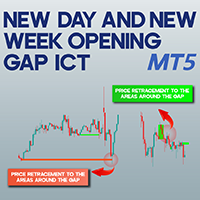
New Day and New Week Opening Gap ICT NWOG NDOG MT5 The New Day and New Week Opening Gap ICT NWOG NDOG MT5 indicator is a powerful and practical tool designed for traders using MetaTrader 5. It helps detect price gaps that emerge at the start of a new trading day or week, making them visible on the chart. When the market closes at the end of a session, the reopening price may differ from the previous close, leading to a price gap. This indicator marks weekly price gaps ( NWOG ) in red and daily p
FREE

Cybertrade Double Bollinger Bands - MT5 O indicador Bollinger Bands mostra os níveis de diferentes máximos e mínimos que um preço de segurança atingiu em uma determinada duração e também sua força relativa, onde os máximos estão próximos à linha superior e os mínimos estão próximos à linha inferior. Nosso diferencial é apresentar esse indicador de forma dupla, com disponibilização de seus valores para simplificar as automatizações.
Funciona em períodos maiores do que o período visível no gráfi
FREE

MACD Scanner provides the multi symbols and multi-timeframes of MACD signals. It is useful for trader to find the trading idea quickly and easily. User-friendly, visually clean, colorful, and readable. Dynamic dashboard display that can be adjusted thru the external input settings. Total Timeframes and Total symbols as well as the desired total rows/panel, so it can maximize the efficiency of using the chart space. The Highlight Stars on the certain matrix boxes line based on the selected Scan M
Attention: You can view the program operation in the free version IShift Lite DEMO . IShift Lite is utility for trading directly from the depth of market. IShift Lite allows: - perform trade operations directly from the DoM with a "single touch";
- easily move your orders in the DoM:
- automatically place Stop Loss and Take Profit;
- Place limit order as Take Profit;
- move position to breakeven;
- automatically move Stop Loss along the price;
- calculate the volume of an order dependi

Maximum Minimum Candle indicator is a basic indicator (but useful) that shows the highest and lowest candle in a period of time .
The indicator shows the maximum candle and the minimum candle for a defined period of time. You can choose the number of candles that make up the period The indicator will show with color points the maximum and minimum values. A message tells you when the price reaches the maximum or minimum.
Parameters number_of_candles: It is the number of candles that will be c
FREE
Protect My trades é um EA (robô) que automaticamente coloca stop loss e take profit nas operações à mercado e nas ordens pendentes. Você pode especificar se deseja que ele faça isso somente nas operações do ativo em que está aberto ou em todos os outros. Sua configuração é extremamente simples. Funções: Take profit: distância do take profit (0 = desativado, não será criado TP).
Stop loss: distância do stop loss (0 = desativado, não será criado SL).
Price type: tipo de preço em pipets/pontos ou p
FREE

TrendFriendIndi – Your Smart Trading Companion for Precise Signals! Free for the first 50 activations! Are you looking for a reliable & precise indicator to support your trades? The TrendFriendIndi combines trend analysis, confirmation signals & intelligent risk management to show you the best buy and sell opportunities directly on the chart! Features & Benefits:
Timeframes: All - The higher the more precise! Clear buy & sell signals → Green arrows for BUY , Red arrows for SELL
FREE

Based on the trend-following principle of CCI, it has been improved to become an indicator that can identify the reversal of the trend and its development direction, that is, it can identify the top and bottom attenuation of the oscillating trend in the trend market. feature The red and green columns represent the trend of bullish or bearish development under the current cycle. The blue line shows the position and attenuation of the current price trend in the current cycle. The upper and lower
FREE

O Indicador TRIXe é a combinação do indicador TRIX (Triple Exponential Moving Average) com adição de um sinal tipo EMA (Exponential Moving Average). Fornece sinais de continuidade de tendência e inicio de uma nova tendência. Os pontos de entrada e saída de operações ocorrem quando as curvas do indicador se cruzam. Tem melhor desempenho quando combinado com outros indicadores.
FREE

This utility (as an indicator) allows you to calculate the lot based on the percentage of your deposit.
How does it work? 1. Enter the percentage in the " Percent :" column. For example, you want to open 2 percent of your deposit (if your deposit is 10,000 dollars, then 2 percent is 200 dollars), then enter 2 percent. 2. In the " Stop Loss :" column, enter the stop loss price (in points) that you would specify when opening a position. 3. After all this, you will receive a LOT to open a positio
FREE

This is an EA designed to support manual trading. It can accurately calculate risk, automatically enter trades, set stop loss, and perform trailing stop loss using buttons on the chart. There are many features for risk calculation, setting stop loss, and trailing stop loss to suit various trading styles. It can also automatically manage prop firms by closing trades when reaching the target profit level or maximum daily loss. Additionally, it can perform manual backtesting using the strategy test
FREE

Have you ever wondered which currency is the strongest at any particular time? Or which currency pair is trending the most. Well, the currency strength meter helps with just that. It compares USD , EUR , AUD , CHF , GBP , CAD and NZD depending on the timeline you have chosen in settings, and ranks them on the number of pips each has moved compared to the rest. N/B: All currency charts of the above pairs must have loaded. You can do this by highlighting all major and minor currencies in
FREE
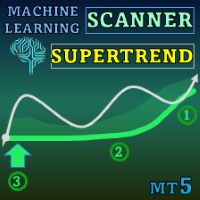
Special offer : ALL TOOLS , just $35 each! New tools will be $30 for the first week or the first 3 purchases ! Trading Tools Channel on MQL5 : Join my MQL5 channel to update the latest news from me Desbloqueie o poder do aprendizado de máquina avançado com o Machine Learning Adaptive SuperTrend , um indicador de ponta projetado para se adaptar perfeitamente às condições de mercado em mudança. Ao integrar o agrupamento k-means com a metodologia SuperTrend, este indicador permite uma

O Impulse System foi descrito pela primeira vez no livro "Come into my Trading Room". Ele usa a direção do histograma MACD e uma média móvel exponencial (MME) de preço para definir um impulso. A regra é nunca negociar contra o impulso.
Seu código de cores fornece vários sinais: Quando a MME e o histograma MACD estão subindo, as cores do sistema Impulse a cor da barra é verde (curto-circuito não é permitido). Quando a MME e o histograma MACD estão caindo, as cores do sistema Impulse a cor da ba

Este poderoso indicador analisa o gráfico e mostra zonas de Rejeição de Preços! Isto é, locais onde o preço foi, mas não foi aceito pelo mercado! A visualização desta zona de Rejeição, facilita o entendimento do trader na tomada de decisões de onde operar e como operar!
O indicador é composto por 4 linhas, sendo classificadas em 2 grupos: Linhas Vermelha e Amarela: Denotam os extremos onde o preço conseguiu chegar, mas não foi aceito! Linhas Laranja e Azul: A partir delas, denotam o Início da z
FREE

O indicador mostra divergência de alta e baixa. O próprio indicador (como o estocástico normal) é exibido em uma subjanela. Interface gráfica : Na janela principal, são criados objetos gráficos “linha de tendência” - produzidos a partir do preço “Mínimo” para o preço “Mínimo” (para divergência de alta) e produzidos a partir do preço “Alto” para o preço “Alto” (para divergência de baixa). ). O indicador desenha em sua janela exclusivamente utilizando buffers gráficos: “Principal”, “Sinal”, “Po
O Top Bottom Tracker é um indicador baseado em algoritmos sofisticados que analisa a tendência do mercado e pode detetar os altos e baixos da tendência / Versão MT4 .
O preço aumentará progressivamente até atingir 500$. Próximo preço --> $99
Características Sem repintura
Este indicador não altera os seus valores quando chegam novos dados
Pares de negociação
Todos os pares de forex
Timeframe
Todos os timeframes
Parâmetros ==== Configuração do indicador ====
Parâmetro de confi
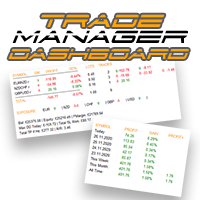
Assuma o controle de sua carteira forex. Veja instantaneamente onde você está, o que está funcionando e o que está causando dor! VERSÃO MT4 DISPONÍVEL AQUI: https://www.mql5.com/en/market/product/58375
O Painel do Trade Manager foi projetado para mostrar rapidamente onde está cada posição que você tem no mercado cambial atualmente e tornar o gerenciamento de risco e a exposição a moedas mais fáceis de entender. Para os comerciantes que escalam para o mercado gradualmente com várias posições ou

O trabalho da concessionária é analisar o trabalho de outros consultores em todos os instrumentos para ajudar a evitar o saque do depósito. Ao ultrapassar os parâmetros especificados, “Equity Protection” pode bloquear, fechar uma posição e enviar uma notificação sobre isso. "Equity Protection " pode funcionar no símbolo atual, ou em todos os símbolos, a funcionalidade integrada permite remover posições pendentes e também fechar outros consultores que trabalham em sua conta. Oportunidades:

Inicialmente este indicador foi elaborado e pensado para rastrear pontos ou velas onde há força de tendência. Como nas grandes descobertas, cheguei ao indicador que mostra principalmente velas de reversão, pontos de tensão, alta liquidez, resistência. O indicador traz simplificação ao gráfico, indicando todos os pontos onde possivelmente teríamos lta´s, ltb´s, médias móveis, bandas, ifr alto. O indicador não faz o gerenciamento de risco, apenas mostra as velas onde podem ocorrer reversão. Lembre
FREE

The Multi Strategy Ranges Indicator MT5 is a powerful tool designed to detect and visualize price consolidation zones in the market. This indicator identifies ranges and draws them on the chart, providing clear signals for efficient trading. Key Features Our indicator incorporates three essential strategies for trading within consolidation ranges: Range Breakout Strategy: A classic range breakout strategy . When the price breaks the upper or lower boundary of the range, a buy or sell signal
FREE

Bill's Williams Awesome Oscillator signal from his book "Trading chaos 2nd edition" on bars. Normally this signal is being used for 2nd entry after 1st entry by Divergent bar ----------------------------------------------------------------------------------------------------------- Please make shure that you understand Bill's Williams system before trade with real money using this indicator. Ideal entry setup is: 1) Divergence with zero line AO crossing 2) Divergent bar on top of the final 5th
FREE
O mercado MetaTrader é um espaço, sem precedentes, para negociar robôs e indicadores técnicos.
Leia o artigo Manual do usuário da MQL5.community para saber mais sobre os serviços exclusivos que oferecemos aos traders: cópia de sinais de negociação, aplicativos personalizados desenvolvidos por freelances, pagamentos automáticos através de sistema de pagamento e a rede em nuvem MQL5.
Você está perdendo oportunidades de negociação:
- Aplicativos de negociação gratuitos
- 8 000+ sinais para cópia
- Notícias econômicas para análise dos mercados financeiros
Registro
Login
Se você não tem uma conta, por favor registre-se
Para login e uso do site MQL5.com, você deve ativar o uso de cookies.
Ative esta opção no seu navegador, caso contrário você não poderá fazer login.