Regardez les tutoriels vidéo de Market sur YouTube
Comment acheter un robot de trading ou un indicateur
Exécutez votre EA sur
hébergement virtuel
hébergement virtuel
Test un indicateur/robot de trading avant d'acheter
Vous voulez gagner de l'argent sur Market ?
Comment présenter un produit pour qu'il se vende bien
Expert Advisors et indicateurs pour MetaTrader 5 - 59

Il y a probablement une augmentation des prix lorsque MACD dépasse le niveau de résistance historique de l'oscillateur. Il est recommandé de vérifier la rupture du prix en comparant la rupture de l'oscillateur, car leurs effets sont similaires aux niveaux de support et de résistance de la rupture des prix ; les transactions à découvert auront probablement la même perception. Comme avantage, la cassure de l'oscillateur précède souvent la cassure du prix en tant qu'alerte précoce d'un événement à
FREE

The ColorLine indicator shows the line of the price moving average on the chart. The line has diffrent colors (100 bars have the same color). The color settings of the line is changing every 5 ticks, there are 3 color schemes. Indicator for demonstrating the DRAW_COLOR_LINE style. Draws a line at Close prices in colored pieces of 20 bars. The thickness, style and color of the line sections are changed randomly. The indicator code is published in the MQL5 Documentation in the section Indicator S
FREE

Menora (All In One) Indicator.
This is the advanced and premium indicator for the Magic Trend, a free indicator. It has 3 output signals driven by different market conditions. This indicator has a double function of working as an indicator and utility at the same time.
Specifications
1] 3 output signals a) Slow Moving Average with color change - The MA has a non-repaint color change, which makes it perfect for entry signals. b) Fast Moving Average (the original Magic Trend line) - Gives a
FREE

Market tops are characterized by Volume Climax Up bars, High Volume Churn and Low Volume Up bars (also called Testing). Market bottoms are characterized by Volume Climax Down bars, High Volume Churn and Low Volume Down bars (Testing). Pullbacks, in either up or down trends, are similar to market topping or bottoming patterns, but shorter in duration and with simpler volume patterns.
FREE

Advanced Trade Mirror is a powerful Forex tool designed for traders who need instant, seamless trade replication across multiple terminals on the same machine. With lightning-fast execution, it ensures zero lag in copying trades, maintaining precision and efficiency in high-speed trading environments. Get the Trade Mirror Master here: https://www.mql5.com/en/market/product/133891
Specification:
Master ID: Identity value of master terminal, please use a unique value to prevent duplicated mas
FREE

You can use this tool to create as many pending orders (limit order) as you want in one button press. All inputs must be in points. You can use this useful tool when such as FED speech times. User Inputs:
MagicNumber = Magic number DeviationPoint = Deviation point number for limit orders Level = You can choise how many level do you want to create pending orders. BuyOrder = true/false SellOrder = true/false StartDistance = Distance between each level. StepDistance = Distance to be added increment
FREE

Breakout MV : This Expert Advisor offers you one of the most fundamental trading strategy, combining Moving Average and Volums indicators!
Key Features : Consistent Performance : Breakout strategy has demonstrated a robust performance across various market conditions, by capitalizing on significant price movements. Strategic Trade Execution : We select the desired range, and once the price approaches these levels and the indicators confirm our entry, we open a trade. The trade will close eit
FREE

Simple utility to help identify local time of price movements. This way you can analyze better and prepare for future movements. Just point to the candle and it will display the time of the candle in your local time zone.
See my other products in the MQL market: https://www.mql5.com/en/users/jdelgadocr/seller Thanks for checking them out. If you have a need for something not too complex, let me know.
FREE

1. The Expert Adviser is built with a basic, simple and stable trading strategy with a touch of Price Action Principle that is highly effective and accurate for a sniper entry system. The EA have a good money management System.. 2. The expert advisor works best as from 5minutes time frame and above, The higher the time frame, the more accurate is the signal.... 3. The expert advisor work with all broker all currency pair and synthetic indices... 4. Use a reasonable lot size and correct settings
FREE

A small utility displays the time in five time zones. You can customize the display of one to five time zones. For each time it is configured: show or not; name; time offset from GMT; color; In general settings, you can change: date / time format ("hh: mi", "hh: mi: ss", "yyyy.mm.dd hh: mi", "yyyy.mm.dd hh: mi: ss") font name; font size; offset from the left edge of the chart; offset from the top edge of the chart;
FREE

I’m sharing this code here for free to support the trading community. Feel free to modify it or even copy it entirely for your own use. I hope it’s helpful, and don’t hesitate to reach out if you have any questions or feedback!
https://github.com/holle112/AlgoTradingConcepts.git
Requirements
Trading pairs all trending Pairs especially USDJPY
Timeframe M1 to H6
Minimum deposit $ 100 Leverage 1:200 Brokers Hedging Pro or ECN Account
Key Features: Versatile Timeframe Trading : Operates effec
FREE

Unlike most other EAs in the market, I always assure every single of my EAs are of highest quality: Real trades will match backtesting. No loss hiden techniques to hide historical losses, no manipulated backtest to make backtesting curve smooth without loss (only naive traders believe in smooth upward curve with no risk - they are most likely scamming). My EA always have multi-years verified statistical trading edge. Robust and long term stable with sensible risk management. Not sensitive to sp
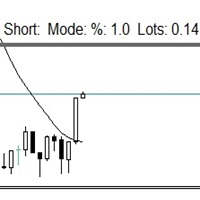
Ce petit outil vous aide à définir votre gestion des risques d'un simple glissement de ligne sur le graphique. Il vous montre la taille réelle du lot calculée sur le % du compte ou le montant fixe directement sur la ligne.
Tout ce que vous avez à faire est d'activer la ligne en appuyant sur la touche "t" de votre clavier et de faire glisser la ligne jusqu'à votre point stop loss. C'est ça.
Dans les paramètres, vous pouvez définir la couleur et la largeur de la ligne et du texte, ainsi que l'es
FREE

Welcome to the Make It Rain Expert Advisor!!! Automated Multi-Pair Trading with Advanced Strategies Introducing the Make It Rain Expert Advisor!!! My latest expert system utilizing a new strategy and new signals for trading across multiple currency pairs. This is a fully automated expert engineered to have a higher profit-to-loss ratio average per trade while aiming for as many trades as possible . The EA will open up to 8 limit trades off of one signal in a grid pattern sharing the Take Prof

Are you tired of erasing the objects on chart and then having to put them back in? What if you had a tool that would allow you to hide and show all objects any time? Cool, huh? That is why I developed this tool as an indicator. With it you hide all objects using a shortcut button on chart or the keyboard (customizable). If you have any suggestions or find a bug, please, contact us. Enjoy!
FREE

Mean Reversion Jutsu est un EA de stratégie de réversion à la moyenne conçu pour trader les bandes de Bollinger et les tendances du RSI. Un signal de vente se produit lorsque le prix dépasse le RSI et également la bande de Bollinger. Cet EA utilise une approche basée sur une grille pour profiter du coût moyen en dollars, s'efforçant d'obtenir des gains constants au fil du temps. Il intègre des mesures strictes d'arrêt des pertes et d'équilibre pour contrôler les pertes potentielles par transacti
FREE

OnBoard stats is a panel that show in a single view a lot of usefull information about working orders and trading account. It has 4 different sub-panels (from left to right): Symbols order statistics : it can be found symbols for which there are orders (market or pendings). Symbol with pendings are colored with "Pendings color". Clicking on a specific symbol row, chart will be changed to that symbol. Current symbol statistics : informations about the "current" symbol, the one which is opened in
FREE

This is a versatile tool designed to help traders analyze their trading performance on a MT5 account. It provides a detailed of profit, allowing users to review their overall account performance or filter trades based on specific criteria. With this tool, traders can: Check total profit across all trades. Filter by a single Magic Number or multiple Magic Numbers (enter directly, separated by ",") Analyze individual symbols or a custom set of symbols to evaluate different market instruments (
FREE

Moyenne mobile du prix de la distance
Il s'agit d'un indicateur qui calcule en temps réel la distance entre le prix et la moyenne mobile.
Avec lui, vous pouvez surveiller l'écart maximal du prix par rapport à la moyenne mobile dans une certaine période de temps choisie par vous, par exemple, surveiller la distance en fonction de l'écart maximal des 30 derniers jours.
Il est possible de choisir la période et le type de moyenne mobile.
Pour le rendre encore meilleur, nous avons ajouté la pos
FREE
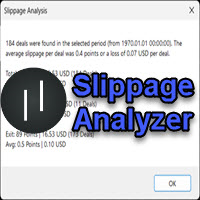
If you are using scalping strategies (or any strategy that uses stop orders for position opening or closing) you need to know your slippage. Slippage is the difference between your pending order price and the price that your brokers uses to execute your order. This can be really different and depends on the broker as well as on the market conditions (news, trading hours, etc..) With this small script you can calculate the slippage you "paid" in points and also in your account currency. You also
FREE

This is a volume indicator with the addition of a threshold level that can be set to a fixed value chosen personally or obtained from the average of the volume values themselves. The type of averaging method can be selected in the input parameters.
The input parameters are easy to interpret but let's examine them:
1 - Volume type Here you can select the type of volume you want to see represented and there are 2 choices, either TICK volume or REAL volume. Keep in mind that for forex, for examp
FREE

The liquidity swings indicator highlights swing areas with existent trading activity. The number of times price revisited a swing area is highlighted by a zone delimiting the swing areas. Additionally, the accumulated volume within swing areas is highlighted by labels on the chart. An option to filter out swing areas with volume/counts not reaching a user-set threshold is also included.
This indicator by its very nature is not real-time and is meant for descriptive analysis alongside other com

L'indicateur des enveloppes des moyennes mobiles exponentielles (double ou triple) est un outil d'analyse technique conçu pour vous aider à identifier les tendances et les points potentiels de retournement sur les marchés financiers. Cet indicateur offre aux traders la flexibilité de choisir entre deux types de moyennes mobiles exponentielles : la moyenne mobile exponentielle double (DEMA) ou la moyenne mobile exponentielle triple (TEMA).
Principales caractéristiques :
- Double ou triple expon
FREE
The Tickerly TV Connector allows seamless integration between TradingView strategies and your MT5 terminal. With this tool, you can automate trade execution by linking TradingView’s powerful scripting environment to your MetaTrader Terminal.
Features include fast trade execution via Tickerly’s engine and easy setup using webhooks. This EA is perfect for traders who want to deploy custom TradingView strategies on MT5, keeping their terminals in sync with real-time market conditions.
Requires mini
FREE

A simple tick indicator of Bid and Ask prices. The period separator (1 minute) is displayed as a histogram. Parameters Show Bid Line - show/hide the Bid line; Show Ask Line - show/hide the Ask line; Show Labels - show/hide the last price values.
FREE

Stat Monitor is a good information indicator.
Benefits of the indicator: The indicator provides useful information - the current spread, the cost of one lot of the symbol, trading leverage and the recommended lot size for trading. You can use the indicator on the MetaTrader 5 trading platform of any broker. The indicator provides useful information.
Version of the Stat Monitor indicator for MetaTrader 4 I wish you all good luck in trading and stable profit!
FREE

The indicator determines the ATR value (points) in a classic way (taking into calculation paranormal bars/candles) and more correctly - ignoring paranormal movements of the Instrument. Correctly it is excluding paranormal bars from the calculation, extremely small bars (less than 5%( customizable ) of the standard ATR) and extremely large bars (more than 150% ( customizable ) of the standard ATR) are ignored. This is a Extended version - allows you to set calculation parameters a
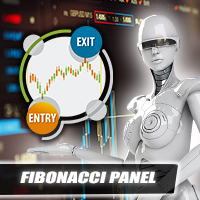
A Fibonacci Panel tool to facilitate your trading with Fibonacci indicator. Simple and easy to use! Magnificent Design (Adjustable) Sound Effects (This will make trading much more fun) Five Fibonacci Levels (freehand movable) Acoustic and graphic signals (adjustable for each level) Integrated narrow trading panel also with risk and money management If you need silence while trading, you can deactivate the sounds in the settings.
Parameter
Language English Magic number Commentary (for all posi
FREE

Transform your way of analyzing the market with our innovative trend and support/resistance indicator!
By combining the robustness of pivot points, the sensitivity of price adjustment, and the reliability of moving averages, our indicator provides a comprehensive and intuitive view of price behavior. Whether to detect emerging trends, track significant price shifts, or map critical support and resistance zones, this tool is your reliable guide amidst market volatility (BMF WIN).
T ested for B
FREE

Bill Williams' divergent bar with angulation. The angle between the green line and the top/bottom of the bar is used as an angle, which basically corresponds to the updated recommendations from Justin Williams Angulation for the Wiseman Bullish and Bearish Divergent Signal Bar - YouTube . The default settings of the angle of 85 and 21 bar from the moment of crossing the lip line of the Alligator work quite well. If you use this indicator in real trading, I highly recommend not to engage in day
FREE

HM (horizontal Markup) est conçu pour marquer manuellement les niveaux horizontaux. Le balisage contient le niveau et sa valeur de prix. L'épaisseur et la couleur de la ligne et de la valeur de prix sont définies dans les paramètres. Les niveaux peuvent être placés localement sur des périodes ou exposés publiquement pour toutes les périodes.
Son fonctionnement est très simple:
1) - appuyez sur la touche définie dans les paramètres pour marquer le niveau;
2) - amenez la ligne à l'endroit dés
FREE

Este poderoso indicador analisa o gráfico e mostra zonas de Rejeição de Preços! Isto é, locais onde o preço foi, mas não foi aceito pelo mercado! A visualização desta zona de Rejeição, facilita o entendimento do trader na tomada de decisões de onde operar e como operar!
O indicador é composto por 4 linhas, sendo classificadas em 2 grupos: Linhas Vermelha e Amarela: Denotam os extremos onde o preço conseguiu chegar, mas não foi aceito! Linhas Laranja e Azul: A partir delas, denotam o Início da z
FREE

L'indicateur "Ray Ray" ou "Ray" est basé sur les oscillateurs du Dr Alexander Elder: Bulls & Bears Power. Les deux travaillent avec un EMA. Cet indicateur est utilisé par les commerçants pour identifier la divergence, les instructions du marché et plus encore ... La méthode du Dr Elder utilise généralement une période EMA de 13 jours, mais cela peut être modifié en fonction de votre demande personnelle.
Les calculs sont: Bulls Power = Haute bougie - Ema Close Poder des ours = bougie basse - Em
FREE

The Volume Heatmap indicator visually shows the INTENSITY of the volume taking into account the concept of standard deviation. Purpose of the Indicator: High volumes are common where there is a strong consensus that prices will increase. An increase in volume often occurs at the beginning of a new upward trend in the price of an asset. Some technical analysts do not rely on trend confirmations without a significant increase in volume. Low volumes usually occur when an asset is heading for a down
FREE

Introduction MT5 ships with the Envelopes indicator. This indicator allows you to create equidistant bands from a moving average by specifying a “deviation.” Unfortunately, the deviation is an arbitrary number. You might determine that 0.220 works well to contain 95% of close prices for USDCHF,H1, but when you change the period to H4, most of the bars are now outside the bands. So, I created this self-tuning indicator. Instead of specifying a percent “deviation,” you specify the percent of bars
FREE
TradeFlow Dashboard MT5 représente un changement de paradigme dans la gestion commerciale, offrant une solution robuste et polyvalente conçue pour élever vos stratégies de gestion des risques et rationaliser la prise de décision au sein de la plateforme Meta Trader 5. Avec son interface élégante et conviviale, cet outil transcende l'expérience de trading conventionnelle, s'adressant particulièrement aux traders manuels cherchant à amplifier leurs performances.
Examinons les principaux points f
FREE

Cet indicateur vous permet de transformer l'apparence de votre graphique en appliquant une transition fluide entre deux couleurs personnalisables pour l'arrière-plan. Cet effet de dégradé accrocheur donne à votre graphique un look frais et moderne, le rendant plus attrayant visuellement. Le dégradé est appliqué à toutes les fenêtres d'indicateurs actuellement présentes sur votre graphique lorsque l'indicateur est attaché et affectera également toutes les nouvelles fenêtres d'indicateurs ajoutées
FREE

Bienvenue sur HiperCube VIX Code de réduction de 25% sur Darwinex Zero : DWZ2328770MGM Cet indicateur vous fournit une information réelle sur le marché du volume de sp500 / us500
Définition HiperCube VIX connu sous le nom d'indice de volatilité CBOE, est une mesure largement reconnue de la peur ou du stress du marché. Il signale le niveau d'incertitude et de volatilité sur le marché boursier, en utilisant l'indice S&P 500 comme proxy pour le marché au sens large. L'indice VIX est calculé sur l
FREE
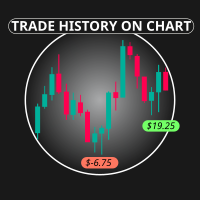
Trade History on Chart is a simple utility indicator that displays the profit, duration, volume and other trade properties of closed trade from history.
Features: Filter history to show only gains or loss of the trade. Show holding time of the trade. Accumulate the profits based on daily, weekly etc. Switch to display only boxes of text.
Change text colors. Fast and user friendly.
FREE

For those who feel that regular RSI is too fast and too noisy to be used on regular trades or in EAs and want to have an alternative to meter the Momentum of the Price, here is a solution presented on the great article of the Technical Analysis of Stocks & Commodities magazine (April, 2015), by Vitali Apirine, called: Slow Relative Strenght Index . Its reading is almost the same as the regular RSI, but its levels of Overbought and Oversold are 80 and 20 instead. SRSI is very powerful to show div
FREE

IQ FX Correlation Matrix is a powerful multi-timeframe dashboard that helps traders analyze real-time currency correlations across multiple forex pairs. With customizable settings, sleek design, and one-click symbol switching, it enhances trade accuracy, reduces risk, and identifies profitable correlation-based opportunities. Download the Metatrader 4 Version Message us here after purchase to get the Indicator Manual. Download Now! Offer valid only for next 10 Buyers. Price will increase gradua

CATAPULT This is a one-of-a-kind expert based on trend. It is based on the successful grid expert, with the help of a multilayer perceptron, the entry point has been refined. Several auxiliary proprietary indicators have been added. The Expert Advisor opens trades variably. How to use the EA
The EA has been optimized for the best performance. Just attach the EA to EUR/USD chart and let it operate by itself. All the required settings have been considered after careful back testing and live te
FREE
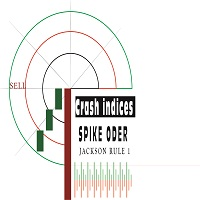
This is a powerful crash spike detector indicator. It design to work on crash only it might be crash 100 ,crash 500 or crash 300 .binary.com broker provide crash indices .on 1minete only make sure to take signals consistence .it have a notification that makes sound whenever the spike it about to shown ,it proven 98% correct since 2017 . Try it now. check the recent result on the screenshot.

I've combined two trading strategies, the Order Block Strategy and the FVG Trading Strategy, by utilizing a combination of the FVG indicators and Order Blocks. The results have been surprisingly effective.
This is a two-in-one solution that makes it easy for traders to identify critical trading zones. I've optimized the settings so that all you need to do is install and trade; it's not overly complex to explain further. No need for any usage instructions regarding the trading method. You shoul

Gold 588 is a gold night scalping high performance EA which takes the positions with the highest probability of winning. Gold 588 takes trend following trades considering the prevailing higher timeframe during the low volatility hours of late night markets. This approach causes a high win-rate which even with the small scalping profit margin of for each trade, leads to a profitable strategy.
Inputs of this EA have been kept minimalistic to provide users with the best optimized performance,

Crypto.com à MT5
Flux de bougies en direct vers Metatrader 5 à partir du websocket Crypto.com
C'est une donnée de taux en direct OHCLV (Open High Low Close Real Volume)
commerçants, si dans un graphique minute, les données OHLC ne sont pas correctes, elles peuvent donner une mauvaise analyse dans l'étude graphique technique, ce produit garantit qu'il fournit des données précises en temps réel qui peuvent aider à l'analyse manuelle
vous pouvez vérifier mon autre produit crypto sur mon profi
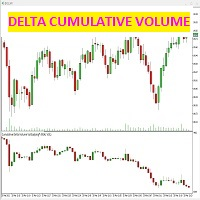
cet indicateur détecte la différence entre les contrats conclus en offre et en demande (agression) pour chaque bougie.
l'indicateur affiche dans la fenêtre dédiée sous le graphique des prix, des bougies données précisément par la différence entre les contrats vendus et achetés, qui génèrent la force volumétrique du marché.
il est possible (voir sur les captures d'écran) comment sélectionner uniquement le graphique delta des chandeliers cumulatifs, ou même avec une ligne de tendance des bougie
Il s'agit d'une stratégie de réversion moyenne à taux de réussite élevé qui peut être négociée sur la plupart des marchés, notamment : les paires de devises, les indices boursiers, les actions individuelles, les obligations et plusieurs matières premières. Cet Expert Advisor est construit sur des principes de trading et des règles statistiques robustes et éprouvés, sans BS. Back testez et optimisez l’Expert Advisor sur votre marché cible. Exécutez l’EA sur plusieurs marchés non corrélés pour ob

Besoin d'ouvrir plusieurs positions/trades en même temps ? Nous avons créé votre solution simple. Vous pouvez désormais saisir plusieurs postes à la fois. Vous pouvez définir la taille du lot, le nombre de positions, le take profit et le stop loss. Par exemple : vous souhaitez acheter 3, 5, 10 ou n’importe quel nombre de positions avec une certaine taille de lot. Vous pouvez maintenant le faire en appuyant simplement sur le bouton « Acheter ». Ou Par exemple : vous souhaitez vendre 3, 5, 10 ou

Cet indicateur suit efficacement tous les autres chandeliers temporels que vous souhaitez suivre sur le même graphique.
1. Sélectionnez n'importe quel délai supérieur pour charger les barres sur le même graphique
2. Personnalisez les couleurs et le style des chandeliers
3. Choisissez le nombre de barres pour dessiner les chandeliers
4. Suivez les bougies complètes dans un délai plus long, ainsi que la mèche et le corps.
5. Facile et pratique pour ceux qui ne veulent pas changer de graphique

Élevez votre trading au niveau supérieur avec EMA CrossPro EA, un Expert Advisor sophistiqué mais facile à utiliser, conçu pour maximiser les profits sur les marchés en tendance. Cet EA exploite la puissance des Moyennes Mobiles Exponentielles (EMA) pour détecter et capitaliser sur les fortes tendances du marché avec précision et efficacité. La logique derrière EMA CrossPro EA : Signal d'achat : L'EA initie une opération d'achat lorsque la EMA rapide croise la EMA lente vers le haut, signalant l
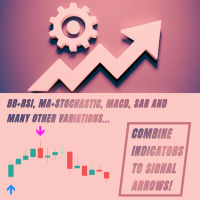
C'est un constructeur. C'est-à-dire le créateur de stratégies. Et pas seulement. Il s'agit d'un indicateur de signal pour la plupart des indicateurs standard intégrés dans MetaTrader 5. Combinez vos indicateurs dans une flèche de signal. Par exemple, vous avez une stratégie et vous devez connaître sa rentabilité, inclure les éléments nécessaires dans le menu et obtenir des statistiques. Et si vous n’avez pas de stratégie, utilisez-la sur Internet ou créez la vôtre. Rigonstruktor vous aidera avec
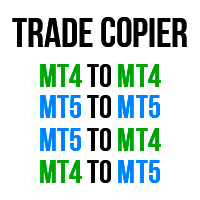
Le programme vous permet de copier facilement des transactions entre MetaTrader 4 (MT4) et MetaTrader 5 (MT5) dans n'importe quelle direction. Le programme est conçu pour fonctionner sur "Windows PC" et "Windows VPS". Tout type de copie est disponible
MT4 - MT4 MT5 - MT5 MT5 - MT4 MT4 - MT5 *The copier works only on forex and only with currency pairs
*deux versions du produit Trade Copier for MT4 + Trade Copier for MT5 sont nécessaires pour la copie entre les terminaux MT4 - MT5.
MT4 - htt

The indicator High Trend Pro monitors a big number of symbols in up to 4 timeframes simultaneously and calculates the strength of their signals. The indicator notifies you when a signal is the same in different timeframes. The indicator can do this from just one chart. Therefore, High Trend Pro is a multicurrency and multitimeframe indicator. High Trend Pro uses emproved versions of popular and highly demanded indicators for calculating its signals. High Trend Pro calculates the signal strength

Voici Position Closer - la solution pour les traders qui souhaitent fermer automatiquement toutes les positions ouvertes lorsqu'ils atteignent un objectif de profit ou de perte.
Avantages de l'utilisation de Position Closer :
Facile à utiliser - il suffit de définir votre objectif de gain ou de perte pour toutes les positions ouvertes. Définissez-le une seule fois - il n'est pas nécessaire de le faire pour chaque paire de trading. Moyen pratique de gérer les positions, en particulier lorsque

OBTENEZ D'AUTRES EA GRATUITEMENT !!! OBTENEZ D'AUTRES EA GRATUITEMENT !!! OBTENEZ D'AUTRES EA GRATUITEMENT !!! OBTENEZ D'AUTRES EA GRATUITEMENT !!! OBTENEZ D'AUTRES EA GRATUITEMENT !!!
USD Scalper MT5 est un Neural EA pour les paires USD. Ce produit est fait pour GBPUSD, EURUSD, AUDUSD, NZDUSD. De nouvelles paires pourraient être ajoutées à l'avenir.
PAIRES ACTUELLES :
GBPUSD
EURUSD
AUDUSD
NZDUSD - SERA AJOUTÉ DANS LA PROCHAINE VERSION
CONTRIBUTIONS:
RISQUE POURCENTAGE DU RISQUE BAS

Smart Trading Copilot : C'est un assistant de trading intelligent qui vous aidera à gérer vos opérations quotidiennes. Le Smart Trading Copilot est équipé d'un panneau de trading convivial, avec un design moderne et utilisant une technologie de pointe.
Le Smart Trading Copilot offre un large éventail de fonctionnalités :
1. Support de gestion des risques : Il calcule automatiquement la taille de lot appropriée en fonction du pourcentage de risque spécifié et du stop loss, aidant ainsi les t

Présentation de l'indicateur L'indicateur est conçu selon des formules de moyenne mobile, ce qui est plus stable et a moins de décalage que RSI ou CCI. L'indicateur a trois valeurs d'indicateur, la période moyenne mobile et les couleurs de la ligne peuvent être modifiées manuellement. Que peut vous apporter cet indicateur ? Signaux d'entrée précis : L'indicateur dessine des signaux de flèche vers le haut et vers le bas. Analyse des tendances multi-périodes : en chargeant cet indicateur dans un

NewsCatcher Pro opens both pending and market orders based on data from the mql5.com calendar. In live mode, NewsCatcher Pro automatically downloads the calendar, opens orders, trails and closes orders. NewsCatcher Pro can trade any event from the calendar with any symbol available in MetaTrader, including Gold, Oil and cross-rates. To change the default symbol, go to the event view you want to change it for. NewsCatcher Pro uses two strategies: Strategy 1 (pending orders): the advisor opens two

Cet indicateur de tableau de bord multi-symboles peut envoyer une alerte lorsqu'une forte tendance a été identifiée. Il peut le faire en construisant le tableau de bord à l'aide des indicateurs/oscillateurs suivants (ci-après uniquement mentionnés comme indicateurs) : RSI, Stochastics, ADX, CCI, MACD, WPR (Williams Percent Range, également appelé Williams %R), ROC (Price taux de changement) et oscillateur ultime. Il peut être utilisé avec toutes les tranches horaires de M1 à MN (il ne peut affic

Alert Stochastic plus delay and level Filter
A stochastic oscillator is a momentum indicator comparing a particular closing price of a security to a range of its prices over a certain period of time. We added many types of alerts plus the Level Cross Filter to aid in your search for better opportunities in the market. Product Features Sound alert Push Notification (Alerts can be sent to your mobile phone) Signs on chart Alert box Level Filter Delay Level Filter
Indicator Parameters K,D
Introduction de l'EA Moving Average REMARQUE - Après avoir acheté The Moving Average EA, envoyez-moi un message privé pour recevoir gratuitement mon utilitaire TradeWatch EA ! L'EA Moving Average est un outil de trading flexible conçu spécifiquement pour les indices synthétiques, tout en étant également efficace avec le forex et d'autres classes d'actifs. Contrairement à de nombreux EA qui reposent sur des réglages de moyennes mobiles fixes, cet EA permet aux utilisateurs de personnaliser complè
Le Indicateur de zone FVG MT5 est un outil puissant conçu pour identifier les écarts de juste valeur (FVG) sur le marché, en mettant en évidence les déséquilibres de prix entre la juste valeur et le prix du marché. Cette identification précise des écarts permet aux traders de repérer les points d'entrée et de sortie potentiels du marché, améliorant considérablement leur capacité à prendre des décisions de trading éclairées. Grâce à son interface intuitive et conviviale, l'indicateur

Je vous recommande de lire le blog du produit (manuel) du début à la fin afin que il est clair dès le début ce que propose l'EA. La stratégie principale de cet Expert advisor (EA) est de placer des trades lorsque 3 moyennes mobiles (MA) sont alignées consécutivement et à une certaine distance l'une de l'autre (elle peut être utilisée par exemple pour une stratégie peu connue utilisée par certains traders institutionnels , ce qui implique les MA 10, 20 et 30 sur la plage horaire D1

The Engulf Seeker indicator is a powerful tool designed to detect engulfing candlestick patterns with precision and reliability. Built on advanced logic and customizable parameters, it offers traders valuable insights into market trends and potential reversal points.
Key Features and Benefits: Utilizes revised logic to analyze previous candles and identify strong bullish and bearish engulfing patterns. Convenient arrow-based alert system notifies traders of pattern occurrences on specific symbo

Nous vous présentons une offre unique - un produit innovant appelé Space Cake qui changera votre approche du trading sur le marché! Ce produit est spécialement conçu pour les traders et investisseurs expérimentés qui souhaitent augmenter leur efficacité et réduire les risques. Grâce à ses fonctions et fonctionnalités uniques, il deviendra un assistant indispensable dans vos activités de trading.
Sans martingale, grilles et autres stratégies à haut risque.
Version MT4- Cliquez sur
Principaux

Vegas Tunnel, with up to 20 levels, allowing you to plot or not each level with color change, line thickness and ON/OFF visualization for easy use 100% free and lifetime Recommended use for time frames: Original --> H1 Fractals --> M15, M30, H4, D1 and W1 When the black dots are above the tunnel, start short positions. When the black dots are below the tunnel, start long positions. It's important to remember that just because the market breaks the line of lying doesn't mean it's time to enter a
FREE
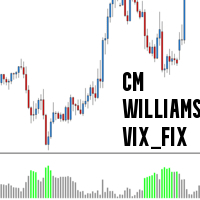
CM_Williams_Vix_Fix Indicator Description The CM_Williams_Vix_Fix is a sophisticated, volatility-based technical indicator designed to help traders identify potential market reversals by analyzing the relationship between current price lows and the highest closing prices over a specified period. Drawing inspiration from the Volatility Index (VIX)—often referred to as the "fear index"—and possibly incorporating concepts from trader Larry Williams, this indicator provides a unique perspective on
FREE

RSI Robot Easy This fully configurable robot has the purpose of executing orders using the RSI indicator as a base. It is possible to choose whether the entries will happen when entering the overbought areas and / or when leaving the oversold area. It is possible to configure stoploss and takeprofit, as well as the maximum number of orders at a time.
Aurélio Machado.
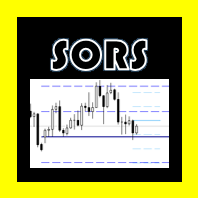
THE SORS COMPLEXES
This indicator is designed to draw the SORS lines on the graph, these are the modern way of calculating market points that it usually respects, they are comprised of supports and resistance, but unlike the classics, these are calculated from volatility endogenous and standard deviation,
In the configuration you can change the color of each level linear and hide the ones that are not needed.
A = Annual. M = Monthly. W = Weekly D = Daily.
Le MetaTrader Market est un magasin unique de robots de trading et d'indicateurs techniques.
Lisez le mémo de l'utilisateur de MQL5.community pour en savoir plus sur les services uniques que nous offrons aux traders : copie des signaux de trading, applications personnalisées développées par des freelancers, paiements automatiques via le système de paiement et le MQL5 Cloud Network.
Vous manquez des opportunités de trading :
- Applications de trading gratuites
- Plus de 8 000 signaux à copier
- Actualités économiques pour explorer les marchés financiers
Inscription
Se connecter
Si vous n'avez pas de compte, veuillez vous inscrire
Autorisez l'utilisation de cookies pour vous connecter au site Web MQL5.com.
Veuillez activer les paramètres nécessaires dans votre navigateur, sinon vous ne pourrez pas vous connecter.