Conheça o Mercado MQL5 no YouTube, assista aos vídeos tutoriais
Como comprar um robô de negociação ou indicador?
Execute seu EA na
hospedagem virtual
hospedagem virtual
Teste indicadores/robôs de negociação antes de comprá-los
Quer ganhar dinheiro no Mercado?
Como apresentar um produto para o consumidor final?
Pagamento de Indicadores Técnicos para MetaTrader 5 - 34

Ao negociar usando o The Strat , é importante ficar de olho em vários prazos. Este indicador mostrará o estado Diário, Semanal, Mensal e Trimestral da vela atual para cada período de tempo. Um ícone de Círculo mostra que a vela nesse período de tempo é atualmente um Inside ou Type 1 na terminologia TheStrat. Uma vela Inside Day está consolidando a ação do preço e estamos procurando uma quebra do intervalo. Um ícone Triângulo, apontando para cima ou para baixo, é uma vela de tendência ou Tipo
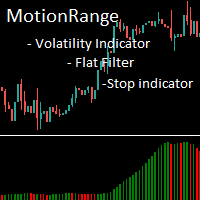
MotionRange - индикатор волатильности цены.
Индикатор не показывает направление движения цены и предназначен для наглядной демонстрации наличия трендового движения, силы тренда, ускорения и замедления трендового движения. Индикатор можно использовать для: - фильтрации флэтового состояния рынка, - открытия позиций в момент начала тренда, - закрытия позиций в момент замедления или остановки тренда.
У индикатора один входной параметр - Calculation Period. Это количество сравниваемых свечей для

It's a DYNAMIC PERIOD indicator which identifies best ENTRY PRICE in the direction of main trend. It's completely non-repaint indicator and very simple to use.
Each arrow has a specific impact value from 1 to 10. Basically there is no important difference between impact numbers. The main point is: A higher impact value means that signal is generated from a bigger swing.
When it draws a Buy arrow on a bottom, It means that we had a Trend, A correction, And now this bottom is a reliable trigger fo

Hello Seasonal Traders! The seasonality trading strategy works because the smart money is doing the same thing every single year more often than not. The month of the year or the day of the week and the time of the day can call the shots in any market. The seasonal cycle is another useful tool in your trading arsenal. I'm not saying to trade solely off of seasonality and forget anything else. I'm only giving you another trading tool that you can incorporate into your own trading strategy to ga

Session Control session indicator. Depending on from which continent the trading activity takes place in a certain period, the entire daily routine is divided into several trading sessions.
Due to the fact that at each separate time interval exchange and banking platforms from different parts of the world are connected to the trading process, and the Forex market operates around the clock.
There are 4 main trading sessions:
Pacific. European. American. Asian.
This indicator allows you to se

Sinais de entrada e saída da Estratégia Duplo 7 de Larry Connors em seu livro "Estratégias Operacionais de Curto Prazo Que Funcionam".
Larry alega que esta estratégia previu a direção do mercado mais de 80% do tempo desde 1995. Lucrando sem se expor ao mercado em mais de 25% do tempo. Ótima para swing trade em gráfico diário do SPY, Nasdaq, FXI da China, EWZ do Brasil (IBOV dolarizado) e a maioria dos ETFs e índices do mundo.
Como o indicador funciona? O indicador plota o sinal de compra quan
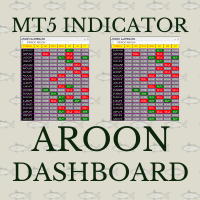
Aroon crossover Dashboard uses the value of Aroon indicator. The Aroon period can be adjusted via the Edit box of this dashboard. The monitoring pairs will be selected by adding to the Market Watch (no need to set prefixes or suffixes) , you can monitor many pairs as you like. This dashboard will check almost popular time frame (M1,M5,M15,M30,H1,H4 and D1). The colors can be customized. The Aroon indicator has been included in to this Dashboard, you do not need purchasing it. Crossover signal c
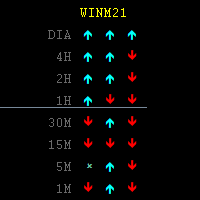
Indicador visual que mostra a direção de um ativo em diferentes times frames. Acompanhe em tempo real a variação de direção dos preços nos últimos 3 candles. É possível escolher o ativo a ser mostrado e quais times frames deseja acompanhar. Excelente para operações Day Trade. Facilita a visualização de vários times frames auxiliando assim na tomada de decisão rápida. Parâmetros de fácil configuração.

Indicator of trend deviation with a static level. The deviation coefficient is set for the trend histogram. Signals are the intersection of the level trend histogram in the direction of the trend or during a trend reversal - the option is selected in the indicator settings by the "Revers" parameter. There are all the necessary settings for the design of the indication and sending messages to mail or a mobile terminal. All input parameters have an intuitive name. Analog for MT4: https://www.mql5.

Este indicador mostra, no dia corrente algumas linhas de interesse, como máxima, mínima e fechamento do dia anterior, bem como o preço de abertura, máxima e mínima do dia atual.
Ele também pode mostrar o GAP (fechamento do dia anterior e abertura do dia atual) e projeções da amplitude do dia anterior, conforme o valor que você escolher no multiplicador.
Ah, ia me esquecer. Também é possível determinar o time frame, que é diário por default.
Se este indicador pode contribuir no seu operacional,

This indicator has a unique support and resistance calculation program, which is a unique trading system. Index characteristics Imagine if you can accurately determine the important trading support and resistance areas and points in advance, how will your trading improve? Based on a unique calculation method, the indicator analyzes the trend, analyzes the current support and resistance, and obtains the current important support resistance and single direction, the calculated stop profit and sto

Os níveis de pivô são um nível técnico bem estabelecido e reconhecido em todos os mercados. Este indicador desenhará os atuais pivôs trimestrais, mensais, semanais, diários e de quatro horas no gráfico, para qualquer símbolo. Você também pode mostrar os níveis de Suporte e Resistência para cada período e escolher qual exibir dos níveis 1 a 4. Escolha o tipo de pivô entre: Padrão Camarilha Dinamarca Woodie Fibonacci Observe que os pivôs DeMark têm um único nível de suporte e resistência de ac
An indicator for receiving a lot of signals Can be used in all time frames and all markets Trade professionally using professional indicators yourself . Using this indicator, you will have a signal at any time. Do not miss any market movement. Get the signal very simply and clearly.
----------------------------------------------------------------------------------------------------------------------------------------------------------------------------------------------------
How it work:
Thi

This indicator displays buy or sell signals according to Bill Williams' definition of the Trading Zone. [ Installation Guide | Update Guide | Troubleshooting | FAQ | All Products ] Easy to use and understand Avoid trading flat markets Deterministic indicator with clear rules The indicator is non-repainting It implements alerts of all kinds It has straightforward trading implications. A blue arrow is a buy signal A red arrow is a sell signal According to Bill Williams trading in the zone helps t

Aggression Wave PRO é um Indicador desenvolvido para acompanhar a divergência, força e continuidade do volume das agressões de venda e de compra. O Agrression Wave PRO possui recursos que possibilitam visualizar além do acumulado do delta do volume do dia.
Nota: Ele só funciona com corretoras e/ou mercados que informam o tipo de agressão de cada negociação, ou seja, informando se foi uma agressão de venda ou de compra. Criptomoedas e Forex não fornecem este tipo de dado, ou seja, não funci
MAs Crossover Dashboard Pro uses the value of Moving Average indicator. The periods of 2 MAs can be adjusted via the Edit boxes of this dashboard. The monitoring pairs will be selected by adding to the Market Watch (no need to set prefixes or suffixes) , you can monitor many pairs as you like. This dashboard will check almost popular time frame (M1,M5,M15,M30,H1,H4 and D1). The colors can be customized. The parameter of MAs can be set at the input. Crossover signal can be sent to you screen, yo

Hello!
Tired of constantly subscribing to other people's signals and earning pennies?
Want to manage your own trading?
Then you are on the right page!
It's very simple ==> buy my indicator ==> put it on the chart ==> blue arrow - buy ==> red arrow - sell. Even an infant can do it!
A handy histogram to trace the market direction.
Are you still here? Then read the parameter descriptions and take a look at the screenshots: Stoch K period - period for calculating the% K oscillator line. Stoch

A ‘Supertrend’ indicator is one, which can give you precise buy or sell signal in a trending market. As the name suggests, ‘Supertrend’ is a trend-following indicator just like moving averages and MACD (moving average convergence divergence). It is plotted on prices and their placement indicates the current trend. The Supertrend indicator is a trend following overlay on your trading chart, much like a moving average, that shows you the current trend direction. The indicator works well in a tren

Este indicador cria o RENKO perfeito para que possa trabalhar com esse tipo de Candle ATEMPORAL! Por ser atemporal, as setas indicativas de negociação ficariam perdidas, porém esse indicador as ajusta e as deixa exatamente onde ocorreu a negociação! Além de demonstrar exatamente a divisão entre os dias, de modo a deixar claro para o usuário onde começou e terminou cada pregão! Além disso, os seguintes indicadores foram incluídos, de modo a dar maior poder de análise em suas negociações: SuperTre

Delta Aggression Volume PRO é um Indicador desenvolvido para acompanhar a força e continuidade do volume das agressões de venda e de compra. Nota : Ele só funciona com corretoras e/ou mercados que informam o tipo de agressão de cada negociação , ou seja, informando se foi uma agressão de venda ou de compra . Criptomoedas e Forex não fornecem este tipo de dado, ou seja, não funciona com eles .
O Delta Agrression Volume PRO possui recursos que possibilitam visualizar a
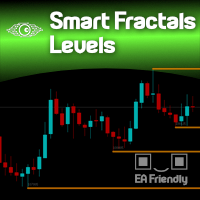
Suportes & Resistências levados ao próximo nível. O indicador Smart Fractals Levels é baseado na teoria de Bill Williams de identificação dos níveis de Suporte e Resistência através do uso dos chamados " Fractais ". A diferença entre as regiões comuns que você encontra de Suporte e Resistência tradicionais e as que o indicador Smart Fractals Levels entrega são que apenas os níveis NOVOS e intocados ainda permanecerão desenhados no gráfico (se você decidir assim), e também com base em seu próprio
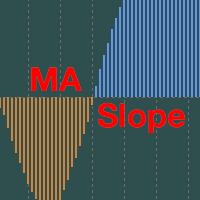
Moving Average Slope for MT5 is an indicator which displays the Slope of a Moving Average . Finding the Slope of a Moving Average is a great way to determine trends and ranges of the market. Moving Average Slope can be used for manual trading or built into an Expert Adviser for automated trading. It is presented as a histogram which you may change the colors for positive and negative results. Positive results indicate an upward trend of the market.
Negative results indicate a downward trend of

Os mercados realmente adoram números redondos e geralmente atuam como suporte em um mercado em queda ou resistência quando os preços sobem. Este indicador é projetado para desenhar níveis de preços em valores redondos. Ele faz isso automaticamente, mas você também tem a opção de substituir isso e determinar os níveis que deseja ver. Um nível redondo pode ser tão simples quanto passos de 10, então 10, 20, 30 etc. ou se você estiver trabalhando com Forex, talvez queira ver mudanças em 0,1 ou 0,01.
Any MA
Any Moving Average draws a moving average of * any indicator in a sub-window. Many Indicators included with MT5 are supported by default. You can add custom indicators as well. Settings Name Description Timeframe Select timeframe for calculation Source Indicator Select Indicator Custom Indicator Name Enter Custom Indicator Name ( when Source Indicator is set to Custom) Indicator Settings Source Indicator parameters ( separated by comma ) Moving Average Settings Moving Average para

Tom DeMark developed TD Sequential by hand, through a process of trial and error, in the 1970s. It never ceases to amaze me how something originally created to analyze daily price data can be applied so effectively, more than thirty years later, to any time frame—from one minute to one year—and to any market. The indicator has two components: TD Setup, which relies on momentum to define price ranges, and TD Countdown, which is trend based, and looks for low-risk opportunities to fade establishe

With my custom built formula, you can visualize the market similar to displaying a heat map; with color showing at a glance the strength of the current trend, and the bar length showing the intensity of current movement. In more detail: Length of the histogram bar shows the average bar size of the last period, and color (from red to blue) shows the strength of upward or downward movement. Purple zones can indicate a change into a new trend. Bar period is adjustable so as to measure larger or sm
This new indicator allows you to know the intensity of the movements of a certain period. It is a powerful indicator with which it is easy to identify trend changes. It should be noted that this indicator is new and it is likely that nothing similar exists, it is also only available in MT. A high intensity indicates that during the established period the movement of the price in each bar has been of great amplitude, that is to say, that there is a great difference between the opening and closing

//////////////////////////////////////////////////// // ////////////////////////////////////// Este indicador usa regressão polinomial para plotar três canais e seis linhas de acordo. O primeiro canal e suas fronteiras com grande período, o segundo com média e o terceiro com pequeno período. A configuração é simples - você só precisa especificar as cores e ativar / desativar a exibição das etiquetas de preço. Também é muito fácil entender as leituras deste indicador. As linhas de canal são usad

O indicador Supply Demand RSJ PRO calcula e plota no gráfico as zonas de "Supply" (Oferta) e "Demand" (Procura) identificando o tipo de zona (Fraca, Forte, Verificada, Comprovada) e em caso de retestes da Zona apresenta quantas vezes ela foi retestada. As Zonas de "Supply" são as zonas de preço aonde ocorreu mais oferta do que demanda, jogando os preços para baixo. As Zonas de "Demand" são as zonas de preço aonde ocorreu mais procura do que oferta, jogando os preços para cima.
Classificação das
É muito simples - não há configurações. É necessário especificar apenas as cores e o tamanho das setas. Também é muito fácil entender as leituras deste indicador. Uma seta para cima é um sinal de compra e uma seta para baixo é um sinal de venda. Tente testá-lo no testador de estratégia - você vai gostar !!! //////////////////////////////////////////////////// // /////////////////////////////////////// Espero que este indicador seja muito útil para você nas negociações de sucesso. Boa sorte.
Arielfx Smart Money Imbalance Indicator
What is Imbalance? imbalance noun: Lack of proportion or relation between corresponding thing
We Use Imbalance as a part of our trading system. When an imbalance is filled or price comes into it we often see big reactions and moves from those areas!
How can you use it?
You can take a trade an scalp reactions off of imbalance zones

Average True Range (ATR) é um indicador comumente usado que mede a quantidade de movimento no preço ao longo de uma duração definida. No entanto, o valor que ele fornece não é definido dentro de nenhum tipo de limite, o que torna quase impossível usá-lo para qualquer outra coisa que não seja stop loss ou cálculos de lucro. Este indicador é o seu indicador ATR padrão, mas introduzimos demarcações de percentil para que você possa ver os extremos. Você pode escolher entre Percentis e algo que chama
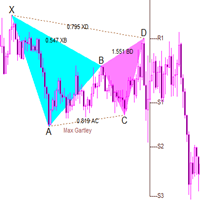
The full purchase discount is currently in progress! The best partner for any trader! This indicator is a classic butterfly indicator (harmonic trading). By default, it can identify 20 patterns and give prompts. You can also add custom shape parameters for custom prompts , prompting appropriate stop loss and profit levels. The built-in algorithm of this indicator is unique and is a unique band algorithm. Index characteristics Gartley pattern, also known as Gartley "222", was
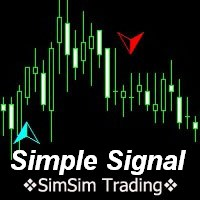
MT5 trend indicator works without redrawing. Provides signals for entering trades, works on charts of any instrument. Трендовый индикатор МТ5, работает без перерисовки. Выдает сигналы для входа в сделки, работает на графиках любого инструмента. Input parameters are for styling and messages only. / Входные параметры только для оформления и сообщений. All original signal calculations do not need additional parameters. / Все оригинальные расчеты сигнала, не нуждаются в дополнительных параметрах.

Indicador funciona com duas médias móveis, conforme elas se cruzam as médias mudam de cor. As duas médias móveis estão liberadas todos os ajustes disponíveis nele, e caso queira colocar em um expert os seus buffers também estão liberados. Caso exista alguma dúvida não pense duas vezes e me pergunte, irei responder com todo prazer, espero que goste do indicador e lhe dê bastante resultado.

You can think of these indicators as moving pivot points. MasterChartsTrading Price Action Indicators show good price levels to enter or exit a trade. The Blue indicator line serves as a Bullish Trend setter. If your instrument closes above the Blue line, we think about going Long (buying). When your trading instrument closes below the Red line, we think about Shorting (selling). It is very easy to read price action if you have a reference point. These support/resistance lines are there to help
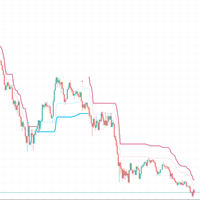
Using ATR to judge the trend, the dotted line is a short-term trend, and the solid line is a stable trend
Set different parameters according to different products. In most cases, please use the default parameters
Time cycle 5 minutes 15 minutes 1 hour
This indicator performs well in monetary products and gold
Index without future function
The entity part of the K line exceeds the entity trend part, which represents the trend conversion. Please wait for the K line to finish

A huge number of traders use the VolumeProfile/MarketProfile analysis method. And I think there is no need to explain such concepts as POC and VAH/VAL. However, the standard VolumeProfile representation has a drawback - we only see the current picture of the market. We see the "convexity" of the volume distribution within the period. But we don't see the main thing - the "migration" of the POC level during the price movement. Our indicator is unique. It is dynamic. The first feature is that the
An indicator of patterns #47 and #48 ("Triangle, ascending" and "Triangle, descending") from Encyclopedia of Chart Patterns by Thomas N. Bulkowski.
Parameters: Alerts - show alert when an arrow appears Push - send a push notification when an arrow appears (requires configuration in the terminal) PeriodBars - indicator period K1 - an additional parameter that influences the accuracy of pattern shape recognition K2 - an additional parameter that influences the accuracy of pattern shape recognit

A tendência permite prever o movimento dos preços e determinar os principais rumos da conclusão das transações. A construção de linhas de tendência é possível usando vários métodos adequados ao estilo de negociação do trader. Este indicador calcula os parâmetros do movimento de tendência com base na distribuição de von Mises. O uso desta distribuição permite obter valores estáveis da equação de tendência. Além de calcular a tendência, também são calculados os níveis de possíveis desvios para

DYJ Tradays Economic Calendar is calendar Indicators of macroeconomic events for fundamental market analysis. Therein you will find financial news and indicators for the largest global economies – from the US and the EU to Australia and Japan, a total of 23 economies, involving more than 60 currency pairs. More than 800 macroeconomic indicators and events are collected from public sources in real time. Historical, current and forecast values, as well as importance characteristics are available
An indicator of pattern #49 ("Triangle, symmetrical") from Encyclopedia of Chart Patterns by Thomas N. Bulkowski. Parameters: Alerts - show alert when an arrow appears Push - send a push notification when an arrow appears (requires configuration in the terminal) PeriodBars - indicator period K - an additional parameter that influences the accuracy of pattern shape recognition ArrowType - a symbol from 1 to 17
ArrowVShift - vertical shift of arrows in pixels ShowLevels - show lines ColUp - co
An indicator of patterns #39 and #40 ("Rounding Tops" and "Rounding Bottoms") from Encyclopedia of Chart Patterns by Thomas N. Bulkowski. Parameters: Alerts - show alert when an arrow appears Push - send a push notification when an arrow appears (requires configuration in the terminal) PeriodBars - indicator period K - an additional parameter that influences the accuracy of pattern shape recognition. Changes from 0 to 1 ArrowType - a symbol from 1 to 17 ArrowVShift - vertical shift of arrows
An indicator of patterns #11 and #12 ("Diamond Tops" and "Diamond Bottoms") from Encyclopedia of Chart Patterns by Thomas N. Bulkowski. Parameters: Alerts - show alert when an arrow appears Push - send a push notification when an arrow appears (requires configuration in the terminal) PeriodBars - indicator period K - an additional parameter that influences the accuracy of pattern shape recognition ArrowType - a symbol from 1 to 17 ArrowVShift - vertical shift of arrows in pixels ShowLevels - s
Advanced Exponential VWAP Para detectar a atividade de grandes jogadores, estendemos o indicador VWAP padrão com novos elementos.
Este indicador calcula a média móvel da solução consistente de EMA[VWAP]=VWAP[EMA].
O desvio padrão é calculado com os mesmos pesos.
O parâmetro denominado "strain" é uma constante linear que move o resultado (strain)xSD(VWAP[EMA]).
Tanto o preço definido quanto o volume definido foram estendidos Figura:
9,[0,+1,+2],PlotMaximum,Density
9,[0,-1,-2],PlotMinimu
An indicator of patterns #37 and #38 ("Rectangle Tops" and "Rectangle Bottoms") from Encyclopedia of Chart Patterns by Thomas N. Bulkowski. Parameters: Alerts - show alert when an arrow appears Push - send a push notification when an arrow appears (requires configuration in the terminal) PeriodBars - indicator period VertexCount - the number of tops and bottoms: 2, 3, 4. ArrowType - a symbol from 1 to 17 ArrowVShift - vertical shift of arrows in piхels ShowLevels - show levels ColUp - colo
An indicator of patterns #7 and #8 ("Bump-and-Run" and "Bump-and-Run Reversal") from Encyclopedia of Chart Patterns by Thomas N. Bulkowski. Parameters: Alerts - show alert when an arrow appears Push - send a push notification when an arrow appears (requires configuration in the terminal) PeriodBars - indicator period K - an additional parameter that influences the accuracy of pattern shape recognition ArrowType - Character: from 1 to 17 ArrowVShift - vertical shift of arrows in pixels ShowL

Description
Trend Influencer is an indicator that determines the potential dynamics of the influence of trend wave movements on the market. The indicator is based on the value of moving averages corrected by the standard deviation. The indicator is displayed as a main dash-dotted moving average and a signal solid moving average. The signal moving average is colored blue or red depending on what type of trend is currently observed in the market. The indicator also draws inhibition levels - blue a

A média aritmética ou mediana pode ser usada para determinar a medida da tendência central de uma série temporal. Ambos os métodos apresentam algumas desvantagens. A média aritmética é calculada pelo indicador Simple Moving Average. É sensível a emissões e ruído. A mediana se comporta de forma mais estável, mas há perda de informação nos limites do intervalo. A fim de reduzir essas desvantagens, a filtragem de sinal pseudo-mediana pode ser usada. Para fazer isso, pegue a mediana de um pequeno c

The Alert Creator indicator is designed to create alerts for selected conditions.
You can select one or several indicators for the notification. If several conditions are selected, the alert is triggered when all the selected conditions are met.
The signals can be configured separately for buying and separately for selling. Example, a buy alert: the closing price is above the moving average, the RSI is below 20. (In this example, 2 indicators are used to generate an alert: MA and RSI)
At the

Este é um gráfico de ticks no segundo formato. Há suporte para OpenCL. As configurações são muito simples - você pode selecionar os dias da semana para os quais o indicador será calculado: por exemplo, para esses instrumentos financeiros, cujas cotações não são atualizadas nos finais de semana, você deve selecionar qualquer outro dia da semana para o 6º e 7º dias, mas, por exemplo, para bitcoin, se o corretor atualizar as cotações, você pode especifique para o 6º dia - sábado e para o 7º dia -

Binary MA Cross MA Cross indicator by 4Umbella
Create for traders both experienced and inexperienced to use it because it is a basic indicator
How to use : 1. MA Fast : Moving Average fast (Period 4 upto 50) 2. MA Middle : Moving Average Middle (Period 10 upto 100) 3. MA Slow : Moving Average Slow (Period 50 upto 200) to control trend markets.
and trader can be set for Apply to price (Close, Open,Low,High,Median,Typical,weightd)
For alert you can set to alert Next bar or instant bars.

O esgotamento do intervalo ocorre quando o preço atinge ou excede o intervalo esperado para o período atual. Nesses níveis, o preço começa a perder seu ímpeto em relação ao início do período, portanto, é bom garantir que você não esteja assumindo novas posições. Este indicador mostrará onde é provável que isso aconteça em seu gráfico, mostrando os níveis para os períodos Diário, Semanal e Mensal. Quando você vê o preço excedendo esses níveis de exaustão, está dizendo que o momento por trás do mo
//////////////////////////////////////////////////// // //////////////////////////////////////
Uma versão melhorada do indicador Average True Range.
Isso agora é o dobro da precisão e uma linha de média colorida.
A configuração é bastante simples - você precisa especificar o período principal e o período de média.
É muito fácil entender as leituras deste indicador, o significado é o mesmo que o do intervalo médio verdadeiro padrão.
//////////////////////////////////////////////////// // //
//////////////////////////////////////////////////// // //////////////////////////////////////
Este indicador exibe a faixa de mudanças de preço em 1 minuto. Ótimo para gerenciamento de risco. Esta é uma versão aprimorada do indicador Average True Range para Tick Chart.
Isso agora é o dobro da precisão e uma linha de média colorida.
A configuração é bastante simples - você só precisa alterar as cores se necessário.
É muito fácil entender as leituras deste indicador, o significado é o mesmo

Uma das melhores ferramentas para se analisar o volume, o Weis Wave foi idealizado por David Weis para facilitar a leitura do fluxo direcional.
Para os discípulos do método Wyckoff, isso significa uma evolução, facilitando uma leitura preditiva do mercado, sempre buscando zonas de Acumulação e Distribuição dos ativos negociados.
Para melhor compreensão, neste indicador tentamos abrangir toda leitura de ESFORÇO (volume negociado) versus RESULTADO (alteração de preços). Assim, você poderá aplica

The indicator automatically calculates the level and real volume Point of control, and also displays the market profile for an array of candles, within the boundaries of a rectangle. If your strategy is based on taking profit on a rebound from price accumulations, the Range profile indicator will become the main tool in scalping trading. Point of control is calculated based on the total volume for each tick or minute candles, depending on the settings and trading timeframe. In the abse
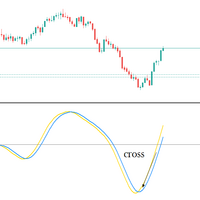
Big promotion on the Robos, Get yours now Robos Indicator The ROBOS indicator is a multi timeframe oscillator that targets the overbought and oversold regions of a price chart, a signal is indicated by the two lines crossing, compatible with all tradable instruments
Latest Release
The latest release is the version 4.0
#What's new in version 4.0 ?
Features
Extreme oversold and overbought levels
ROBOS version 4.0 comes with cool new feature , the ability to target only extrem

///////////////////////////////////////////////// / /////////////////////////////////// Este indicador exibe um canal de regressão polinomial não linear. Ele funciona muito rápido como um raio. Especialmente ao usar a tecnologia de aceleração OpenCL. Uma versão especial deste indicador estará disponível em breve, que também prevê o preço para algum tempo à frente. São linhas coloridas adaptáveis e suaves. Existem quatro opções para este indicador: 1) 1 segundo período de tempo 2) Prazo de 2 s
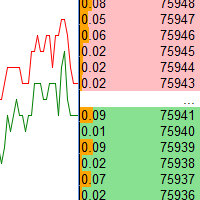
Depth of market display. Up to sixteen instruments can be displayed. There is auto-scrolling of prices, which can be turned off by clicking on "A" at the top of the window. It is quite a beautiful indicator, it can act as a splash screen, it will not be so boring to look like a regular chart, just right for meditation, especially after big losses in the market. The indicator is not for trading, so your deposit will be more complete. The video displays fast playback of previously saved data. Atte

Simple and fast MACD oscillator with MACD and signal lines and two-color histogram.
I wasn't happy with the Meta Trader MACD oscillator as it's not immediate to read and the other ones I tried felt a bit laggy or added unneeded features on top, so I decide to make one that feels familiar to me. I hope you will find it useful!
Contact me for any issues or bugs and I will try to help the best I can.

A lot of professional traders use high quality divergence signals as a part of their strategy to enter a position. Spotting correct divergences quickly can often be hard, especially if your eye isn’t trained for it yet. For this reason we’ve created a series of easy to use professional oscillator divergence indicators that are very customisable so you get only the signals you want to trade. We have this divergence indicator for RSI, MACD, Stochastics, CCI and OBV. RSI: https://www.mql5.com/en/
A lot of professional traders use high quality divergence signals as a part of their strategy to enter a position. Spotting correct divergences quickly can often be hard, especially if your eye isn’t trained for it yet. For this reason we’ve created a series of easy to use professional oscillator divergence indicators that are very customisable so you get only the signals you want to trade. We have this divergence indicator for RSI, MACD, Stochastics, CCI and OBV. RSI: https://www.mql5.com/en/ma
A lot of professional traders use high quality divergence signals as a part of their strategy to enter a position. Spotting correct divergences quickly can often be hard, especially if your eye isn’t trained for it yet. For this reason we’ve created a series of easy to use professional oscillator divergence indicators that are very customisable so you get only the signals you want to trade. We have this divergence indicator for RSI, MACD, Stochastics, CCI and OBV. RSI: https://www.mql5.com/en/

A lot of professional traders use high quality divergence signals as a part of their strategy to enter a position. Spotting correct divergences quickly can often be hard, especially if your eye isn’t trained for it yet. For this reason we’ve created a series of easy to use professional oscillator divergence indicators that are very customisable so you get only the signals you want to trade. We have this divergence indicator for RSI, MACD, Stochastics, CCI and OBV. RSI: https://www.mql5.com/en/

A lot of professional traders use high quality divergence signals as a part of their strategy to enter a position. Spotting correct divergences quickly can often be hard, especially if your eye isn’t trained for it yet. For this reason we’ve created a series of easy to use professional oscillator divergence indicators that are very customisable so you get only the signals you want to trade. We have this divergence indicator for RSI, MACD, Stochastics, CCI and OBV. RSI: https://www.mql5.com/en/

Madx Cobra Madx Cobra Indicator. Create to traders both experienced and inexperienced to use it because it is a basic indicator
How to use : Setting Indicator 1. MA Fast : Moving Average fast (10) 2. MA Slow : Moving Average Slow control trend markets.(200) 3. ADX : Control trend(5) 4. For alert you can set to alert Next bar or instant bars.
When arrow sky blue show or arrow up, you can entry order "Buy" or "Long" and arrow red show or arrow down, you can entry order "Sell" or "Short"
S

One of the most famous phrases in the trading world is "The Trend Is Your Friend".
Trading following the current trend is one of the most successful ways in terms of probability. The hard part of it is to recognize when the market is trending or not.
that's the role of our indicator we called The Trend Is Your Friend Until It Is Not. Apart from its big name it is really easy to use and see when the market is trending or ranging. Through a little window of 3 colors you will identify if the mark
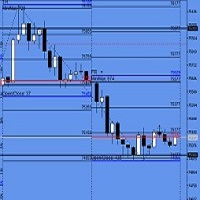
Open close levels.
Open close levels - is an indicator for MetaTrader 5, which displays High/Low, Open/Close, ATR levels (set manually) of the day, week, month on the chart. Marks round levels, signs the days of the week, numbers every week (you can set two types of round levels at the same time). ATH (All-time high) и ATL (All-time low) . Levels are marked with price tags with a price symbol. Also, the indicator automatically calculates and displays on the chart the distance that the pric

Conta o tempo de vida de do Candle Extra até seu fechamento. É utilizada para auxiliar na entrada das operações...
...Operamos no fechamento dos Candles de um minuto, ou seja, quando o cronometro estiver em 00:xx:01. Abrimos uma ordem, e o valor dessa operação também é exibida pela ferramenta.
Extra: Para 'destravar' a escala dos preços. Clique duas vezes na escala e o gráfico será 'centralizado horizontalmente'.
Além de possibilitar a expansão e a contração da escala de preço, podemos navegar
Você sabe por que o mercado MetaTrader é o melhor lugar para vender as estratégias de negociação e indicadores técnicos? Não há necessidade de propaganda ou software de proteção, muito menos problemas de pagamentos. Tudo é providenciado no mercado MetaTrader.
Você está perdendo oportunidades de negociação:
- Aplicativos de negociação gratuitos
- 8 000+ sinais para cópia
- Notícias econômicas para análise dos mercados financeiros
Registro
Login
Se você não tem uma conta, por favor registre-se
Para login e uso do site MQL5.com, você deve ativar o uso de cookies.
Ative esta opção no seu navegador, caso contrário você não poderá fazer login.