Conheça o Mercado MQL5 no YouTube, assista aos vídeos tutoriais
Como comprar um robô de negociação ou indicador?
Execute seu EA na
hospedagem virtual
hospedagem virtual
Teste indicadores/robôs de negociação antes de comprá-los
Quer ganhar dinheiro no Mercado?
Como apresentar um produto para o consumidor final?
Pagamento de Indicadores Técnicos para MetaTrader 5 - 27

Very special indicator of Joe Dinapoli which is a derivative from traditional MACD indicator. It shows the precise price, at which MACD will show line crossing and trend shifting. Also, this level is known one period ahead of time.You can constantly reassess your current position by looking at this studying a variety of timeframes. When you are in a trade, you have a feel for how much time you have for the trade to go your way by looking at the distance between the MACD Predictor line and the

Very special indicator of Joe Dinapoli which is a derivative of a Detrended Oscillator. Through a set of parametric equations, a predicting oscillator is created that forecasts, one period ahead of time, overbought and oversold conditions. The resulting predictor values are expressed as bands on the bar chart, both above and below the market. It may be mistaken as a Bollinger Band but has no resemblance to it whatsoever. The Predictor bands may be used in a variety of ways to aid in entering an

Introduction to Fibonacci Volatility Indicator Volatility indicator can help you to detect any statistical advantage for your trading. Especially, if you are trading with Price Action and Price Patterns, then we recommend to use the Volatility indicator together with your strategy. Especically, Fibonacci Volatility indicator combines the market volatiltiy with Fibonacci Analysis to provide you more advanced volatiltiy indicator. Main Features Fibonacci Volatility in Z score Configuration Mode Fi

Индикатор построен на основе индикаторов VIX и RSI. Комбинация двух указанных индикаторов позволяет обнаруживать зоны крайней перепроданности, где цена с большой долей вероятности изменит направление. Наиболее сильные сигналы дает в периоды слабого тренда. Сигналом индикатора является изменение направления гистограммы (с роста на снижение) выше заданного (сигнального) уровня.
В индикаторе задан широкий спектр параметров, который позволяет оптимизировать индикатор для торговли любыми активами:

The indicator determines a special pattern of Joe Dinapoli. It gives very high probability buy and sell signals. Indicator does not repaint. Indicator Usage Buy Signal ''B'' Entry : Market buy order at signal bar close Stop : Low of signal bar Take Profit : First swing high Sell Signal ''S'' Entry : Market sell order at signal bar close Stop : High of signal bar Take Profit : First swing low Indicator Parameters Fast EMA : External Parameter (should be kept as default) Slow EMA: External Param

The Squat is a function of the range of a given price bar and the volume, or TIC volume, that occurs while that range is being created. The basic idea is that high volume and little price movement indicate substantial support or resistance. The idea behind the approach to this indicator is to first look for likely Fibonacci support and resistance and then see if Squat manifests when that point is reached. The indicator determines one of the high probability patterns of DiNapoli. It does not re
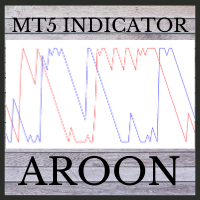
This indicator is powerful for detecting the trend.
The crossing between to line is the entry signal. Buffer 0 is UP line. Buffer 1 is DOWN line. Note: 1. Aroon is great tool for trending detecting. Please try to select the best period for each instrument.
Input AroonPeriod =14- Aroon period
MailAlert =false- Send email when entry signals appeared.
SoundAlert =false- Notify on MT5 platform.

The indicator monitors the Dinapoli MACD trend in multiple timeframes for the all markets filtered and shows the results on Dashboard.
Key Features Indicator can be used for all markets Monitors every timeframe, from 1 Min to Monthly
Parameters
UseMarketWatch: Set true to copy all symbols available in market watch MarketWatchCount : Set the number of symbols that you want to copy from the market watch list. CustomSymbols: Enter the custom symbols that you want to be available in dashboard.

The indicator scans for Dinapoli thrust pattern in multiple timeframes for a specific market. Key Features Indicator can be used for all markets It can scan for thrust pattern on W1, D1, H4, H1, M30, M15 and M5 timeframes Ability to choose number of bars required above/below displaced moving average to define thrust Able to move display label on chart by single click Parameters Minimum Bars: Least amount of bars to account for Thrust DMA Period: Moving average period DMA Shift: Number or bars re

The indicator scans for Dinapoli thrust pattern in multiple timeframes for the all markets filtered and shows the results on Dashboard. Key Features Dashboard can be used for all markets It can scan for thrust pattern on MN1, W1, D1, H4, H1, M30, M15 ,M5, M1 timeframes Ability to choose number of bars required above/below displaced moving average to define thrust Parameters
UseMarketWatch: Set true to copy all symbols available in market watch MarketWatchCount : Set the number of symbols that

Indicador com 3 funcionalidades - Relógio : Relógio independente do gráfico, não para a contagem mesmo com o mercado fechado. - Template : Após definir uma configuração em qualquer gráfico, seja padrões de cores, indicadores, zoom... A configuração será copiada para todos os gráficos ativos. - TimeFrame : Defina o TimeFrame em um gráfico, e com apenas um clique todos os gráficos ativos serão alterados para o mesmo TimeFrame.

Sinais de compra e venda baseados nas estratégias 9.1, 9.2, 9.3 e 9.4 de Larry Williams, popularizadas no Brasil pelo Palex, para reversões e continuações de tendência.
Para entender a lógica de sinalização e operação de cada setup, por favor acesse: Setup 9.1: https://www.mql5.com/pt/market/product/50986 Setup 9.2: https://www.mql5.com/pt/market/product/52268 Setup 9.3: https://www.mql5.com/pt/market/product/52269 Setup 9.4: https://www.mql5.com/pt/market/product/52273
Avisos: - Este

Sinais de compra e venda baseados no Setup Ponto Contínuo (PC), popularizado no Brasil por Stormer e Palex, para continuação de tendência.
Como funciona? O indicador ativa o sinal de compra quando temos preços acima da Média Móvel Aritmética de 21 períodos (MM21) ascendente seguidos por uma correção e toque nela.
O indicador ativa o sinal de venda quando temos preços abaixo da MM21 descendente seguidos por uma correção e toque nela.
Como usar? Uma maneira de usá-lo, proposta por Storm

Limitless MT5 is a universal indicator suitable for every beginner and experienced trader.
works on all currency pairs, cryptocurrencies, raw stocks
Limitless MT5 - already configured and does not require additional configuration
And now the main thing
Why Limitless MT5?
1 complete lack of redrawing
2 two years of testing by the best specialists in trading
3 the accuracy of correct signals exceeds 80%
4 performed well in trading during news releases
Trading rules
1 buy signa

Sinais de compra e venda baseados no Setup Joe DiNapoli com a média móvel exponencial de 3 períodos deslocada em 3 períodos, para reversões de tendência.
Quem é ele? Joe DiNapoli é um trader profissional e autor de livros, envolvido no mercado financeiro a mais de 38 anos. Ele é um Conselheiro de Commodities Trading registrado (C.T.A.) por mais de 15 anos e ensinou suas técnicas em grandes capitais financeiras da Europa, Ásia, África do Sul, Oriente Médio, Russia e Estados Unidos.
Como o in
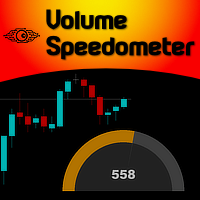
Imagine the ability to have Volume Speed second by second presented to you in the form of a speedometer... Well, imagine no more... Welcome to the new Minions Labs creation: Volume Speedometer . Volume Speedometer is a Minions Labs idea that was born trying to show in realtime what is happening with the Volume Flow of orders (or Ticks, if you don't have that) during the day. This indicator was created to be used in Intraday trading and the goal is to give you a "heads up" when the Volume flow is

The fundamental technical indicator Ripple, allows you to assess the current market situation in order to enter the market of the selected currency pair in the trend and with minimal risk. It uses in its basis the process of identifying the rate of change in price growth and allows you to find points of entry and exit from the market.
This indicator was created on the basis of the original indicators of the search for extremes, the indicator is well suited for detecting a reversal or a large

It is very easy to use the Fibrillar indicator, since the simplest is to look at the chart and act according to the indications of the colored arrows. The algorithm takes into account the measurement of prices, and this method also focuses on measuring each of the price drops (H / C, H / O, LC, LO) - which gives more detailed information, but also more averaged.
When calculating this indicator, logarithmic gains are first calculated at the closing price, which allows you to filter out the tre

Description: Never guess again which currency pairs are trending and which ones are not! This indicator shows exactly which currencies are gaining strength and which currencies are losing strength. The indicator can be used to very quickly determine which currency pairs are trending and which currency pairs are in a sideways motion. When one currency is gaining strength and another is losing strength, the corresponding currency pair is trending. Its as easy as that! For instance, if EUR is showi

FXC iCorrelatioN MT5 Indicator (Specialized for DAX - DowJones)
The indicator shows the correlation soefficient between two assets. Correlations are useful because they can indicate a predictive relationship that can be exploited in practice. The correlation coefficient shows the relationship between the two symbols. When the correlation is near 1.0, the symbols are moving togerhet in the same direction. When the correlation is near -1.0, the symbols are moving in opposite direction. Main featu
MT4: https://www.mql5.com/en/market/product/52715
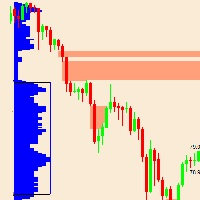
Este indicador é baseado na teoria do perfil de mercado.
O que exatamente é uma área para solteiros?
Teoria: Perfil de Mercado Singles:
Impressões simples ou únicas ou lacunas do perfil são colocadas no interior de uma estrutura de perfil, não na borda superior ou inferior.
Eles são representados com TPOs únicos impressos no perfil do Market.
Os solteiros chamam a atenção para locais onde o preço mudou muito rápido (movimentos por im

A vwap do dia anterior é utilizada por alguns traders como ponto de suporte e resistência, afinal é uma das maneiras de considerar o preço justo daquele ativo ou daquele par no dia anterior. Possíveis defesas podem ocorrer nesta região indicando uma reversão, ou acionamento de stops iniciando um novo movimento mais direcional. É uma questão de analisar como vai somar ao seu operacional.
Para evitar ficar desenhando manualmente as vwaps do dia anterior e ganhando tempo para suas análises, use o

KT Renko Patterns scans the Renko chart brick by brick to find some famous chart patterns that are frequently used by traders across the various financial markets. Compared to the time-based charts, patterns based trading is easier and more evident on Renko charts due to their uncluttered appearance.
KT Renko Patterns features multiple Renko patterns, and many of these patterns are extensively explained in the book titled Profitable Trading with Renko Charts by Prashant Shah. A 100% automate
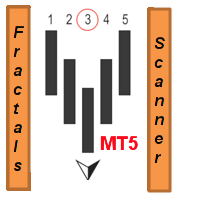
Este indicador de vários períodos de tempo e vários símbolos identifica padrões de fractais. Como um bônus, ele também pode fazer a varredura para alterações de tendência de SAR parabólico (pSAR). Combinado com suas próprias regras e técnicas, este indicador permitirá que você crie (ou aprimore) seu próprio sistema poderoso. Recursos
Pode monitorar todos os símbolos visíveis na janela Market Watch ao mesmo tempo. Aplique o indicador a apenas um gráfico e monitore instantaneamente todo o mercado

Description
Range Detector is an indicator that identifies ranges in the market and displays their presence on the price chart.
Recommendations
You can use this indicator to determine the flet and, accordingly, to determine the direction of opening a position or closing an opposite position.
Parameters
Maximum History Bars - maximum number of history bars for calculating the indicator. Average True Range Period - ATR indicator period (used to calculate the difference between mov

VolumeDeltaScanner is a volume delta monitor for multiple (up to 10) time scopes. It works by online ticks or history ticks. Indicator monitors tick volumes for buys and sells separately, and find their delta on every bar and larger scopes, then displays the volume deltas for all the scopes. Every scope is presented by its own buffer/line. The smallest scope is the current timeframe. It's required. All other scopes should be multiples of it. For example, if placed on a M5 chart, it can calculat

The indicator identifies two most important patterns of technical analysis - Pin Bar and Engulfing. MT4-version: https://www.mql5.com/en/market/product/53591 Settings: Mincandle size for PinBar - The minimum size of the Pin-Bar candlestick; Percentage of candle body on size - The percentage of the candle body in relation to its length; PinBar Alert - Alert when a Pin-Bar is detected; PinBar Mail - Sends an email when a Pin Bar is found; PinBar Notification - Sends a push notificati

Esse indicador é baseado nas médias móveis das máximas e mínimas, para identificação de tendências e/ou condução de stop loss.
Como o indicador funciona? O indicador plota os pontos de tendência de alta até que haja um fechamento abaixo da média móvel das mínimas. Quando isso acontece, inicia-se uma tendência de baixa e os pontos são plotados até que haja um fechamento acima da média móvel das máximas. Quando isso acontece, outra tendência de alta se inicia. E assim vai.
Como usar o indicad

O Indicador CoioteChart foi construído pra facilitar desde a leitura de contexto de mercado até a micro estrutura do candle, facilitando ajustes operacionais e tomadas e decisão com alta eficácia.
Possui um controle para habilitar e desabilitar a visualização das pocs, vwap, zonas de máxima e mínima negociação, pode ser utilizado data sources de tempos gráficos para cálculos ou utilizado os ticks de agressão do time and trades, funciona com volume real e volume de ticks.
As colorações são at
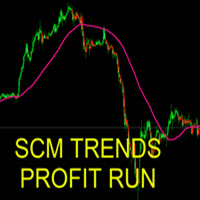
The indicator can be used in several ways. The simplest is to buy when the SCM Trends Profit Run line is painted green and sell when it is red. This indicator that allows you to detect several changes and dynamics in price that many traders can’t estimate or see without an indicator, which highlights its essence and usage.
Accordingly, traders can draw conclusions and make estimates about how the prices will change based on the information they have and then they can modify their strategy fo

O novo indicador é um preditor de tendência para o gráfico atual, bem como outros símbolos e prazos. Todos os botões do quadro são interativos. Por padrão, você tem 20 pares de moedas na lista de observação e três prazos (M5, H1, D1), mas você pode escolher os períodos e símbolos que deseja exibir no menu. Se o indicador for azul, indica o início de uma tendência de alta. Se for vermelho, indica o início de uma tendência de baixa. Na captura # 3 (modo Luz do dia) explicarei cada elemento em deta

É um indicador de Gráfico e de Tendência que traz várias vantagens.
Elimina o ruído.
Facilita a identificação de tendências. Pode ser utilizado como um indicador de força direcional. Identifica lateralização: candles com abertura e fechamento próximos. Identifica alta volatilidade: candles com sombras maiores que o corpo. Atenção!!! Funciona em qualquer ativo e em qualquer timeframe.
Fácil configuração Símbolo: Qualquer um Time frame: Qualquer um Parâmetros: C
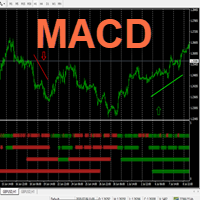
Hello This Indicator will draw Green (Up) and Red (Down) small arrows from Multi TimeFrames based in ( MACD ) to help you to take decision to buy or sell or waiting If there 4 green arrows in same vertical line that's mean (Up) and If there 4 Red arrows in same vertical line that's mean (Down) and the options contain (Alert , Mobile and Mail Notifications). Please watch our video for more details https://youtu.be/MVzDbFYPw1M and these is EA for it https://www.mql5.com/en/market/product/59092 G
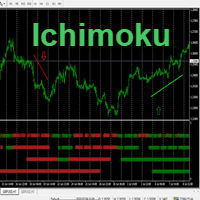
Hello This Indicator will draw Green (Up) and Red (Down) small arrows from Multi TimeFrames based in ( Ichimoku ) to help you to take decision to buy or sell or waiting If there 4 green arrows in same vertical line that's mean (Up) and If there 4 Red arrows in same vertical line that's mean (Down) and the options contain (Alert and Mobile , Mail Notifications). Please watch our video for more details https://youtu.be/MVzDbFYPw1M and these is EA for it https://www.mql5.com/en/market/product/590

O indicador de VolumeTick https://youtu.be/tmHZKdMCMGo
feito para a memorização de determinar os possíveis pontos de reversão, quando as condições de consolidação e multidirecionais de negociação, o número de volumes existentes no mercado aumenta drasticamente, o que mostra o interesse dos participantes mudar a direção do movimento da ferramenta de mercado e considera o número de tiques em cada bar, é concebido como um oscilador. Portanto, nós temos a possibilidade de fornecer parar de negoc

SR Breakup Indicator é um indicador baseado em suporte e resistência . Torna os níveis de rompimento de preços visíveis , abrindo a mente do trader para identificar oportunidades de mercado.
Atenção!!! Este indicador pode ser usado em qualquer período de tempo.
Sugestão de uso Espere até que as linhas de suporte e resistência estejam horizontais e mais próximas . Trade de compra: se preço romper o nível de resistência (linha de fora) para cima. Trade de venda: se o preço romp

WT Vwap 5 Bands
O indicador WT Vwap Bands é um indicador que combina o preço e o volume, ajudando a mostrar se está o preço está dentro do "preço justo", sobrecomprado ou sobrevendido.
O código do indicador foi pensado visando o desempenho e já testado em conta real de negociação.
Além dos inputs visuais (cor, espessura e estilo da linha), o usuário pode definir um valor % que depende do preço.
Os valores default trabalham com a banda mais afastada a 1% do preço e depois dividindo est

Victory Price Direction I'm glad to present you my new indicator.
This indicator includes all the best strategies that I have researched. When developing and optimizing, I used ML algorithms. The indicator is very easy to use.
Now the indicator has 3 basic strategies and the ability to customize your own strategy. I am constantly looking for better strategies.
You get: A simple and effective indicator of reversals. The indicator will help you place Take Profit correctly. It w

Sinais de compra e venda baseados na estratégia do Setup da Onda, popularizada no Brasil pelo Palex, para entradas em correções pós-reversão.
Como o indicador funciona? O indicador ativa o sinal de compra ou venda quando suas respectivas condições são atendidas. Para uma tendência de alta, precisamos de uma reversão para alta na MME9 seguida por preços acima da MM21 ascendente realizando uma correção e toque nela. Para uma tendência de baixa, precisamos de uma reversão para baixa na MME9 se
Indicator summary Индикатор информационная панель отображает значения и торговые действия, а так же выводит сводную информацию о торговых действиях, основанных на 11 встроенных индикаторах. Встроенные индикаторы:
RSI (Relative Strength Index )- пересечение зоны перекупленности сверху вниз - сигнал на продажу. Пересечение зоны перепроданности снизу вверх - сигнал на покупку. При колебаниях в зоне между перекупленостью и перепроданостью сигнал формируется в зависимости от нахождения значения о

The indicator shows when there are overpricing and divergences over a normalized MACD Plus, it displays signals with configurable alerts, self-regulating dynamic overprice levels, and a simple setup and interface. The indicator that automatically calculates overprices ranges! MACDmaxmin is an indicator based on the MACD oscillator that effectively identifies trend changes in price, as it is a momentum indicator that captures the trend and shows the relationship between two moving averages of th

Indicator of the colour display of the zones of buyers and sellers in the bar with a change of colour as the volume increases.
From bar maximum to bar closing - this is the sellers' zone.
From bar closing to bar minimum - this is the buyers area.
As the bar volume increases in comparison to the previous bar, the respective zones are coloured in a different colour.
Input parameters volumes (tick or real)

O indicador analítico BodySizeHistogram foi projetado para observar o movimento real da taxa de câmbio no corpo da vela. O corpo da vela é uma ferramenta universal para analisar o gráfico de preços sem o uso de indicadores que usam fórmulas matemáticas. Na minha opinião, o corpo da vela é praticamente tudo o que é necessário para entender o evento que está acontecendo com o preço. Este indicador exibe histogramas de corpos de velas em pontos. Quanto maior o histograma, maior o corpo da vela e vi

What you can do with CandleStick CandleStick is a useful indicator for doing MTF analysis. This indicator displays the CandleStick of another time frame on the chart . By understanding the information in multiple time charts at the same time, it is easier to understand the overall market view. It is also a useful tool for validating and studying past quotes and trades. There are similar products made by others, but I designed and developed it so that it is easy for me to use.
Features of Candl

IntradayMagic predicts the nature of ATR and tick volumes for 1 day ahead. The indicator does not redraw and does not lag behind. Using Intraday Magic, you can significantly improve the quality of trading and avoid unnecessary risks. According to its indications, you can detect the crisis state of the market and the moments of trend reversal, specify the moments and directions of entries. How the indicator works Periodic events, exchange schedules, Bank schedules, expirations, and other similar

Indicador com foco no ZigZag do mercado adicionando também outros 2 indicadores já consagrados: Book de Ofertas e Saldo Agressor (Time & Trades), este indicador permite em detectar o melhor gatilho (compra ou venda) de preço nas regiões do Book de Ofertas incluindo filtros importantes como Agressão no Candle. Uso recomendado na iBovespa B3 brasileira, mas serve também em Forex desde que os ativos tenham informações do Book, no caso do Forex não é possivel usar o filtro de Agressão por Candle po
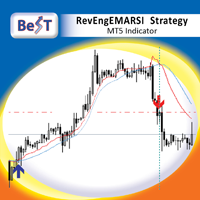
BeST_RevEngEMARSI Strategy is an MT5 Indicator that is based on the indicator RevEngEMARSI by Giorgos Siligardos that was presented in his article " Reverse Engineering RSI (II) " ( TASC_Aug 2003 ) as a new variation of his inverse-RSI indicator and which transforms the Exponential moving average of RSI into a curve in the price graph, simplifying the price projection method and improving its visual representation. BeST_RevEngEMARSI Strategy while implementing the crossings with its Moving Aver

O indicador White's Candle Color (by volume) vai colorir os candles com base no volume do candle atual em comparação com a média móvel do volume. Isto vai permitir você enxergar de modo claro se o volume (real ou tick) está dentro da normalidade, se é elevado ou baixo e trazer uma informação muito importante sobre o mercado. Espero que este indicador possa ajudar no seu operacional.
Sucesso e bons trades!

[DESCRIÇÃO]
O indicador de Ponto de entrada mostra setas para cima / para baixo como um ponto de entrada para compra / venda. O sinal é baseado em EMA, MACD e Price Action.
Uma seta vermelha significa que é uma boa oportunidade para vender. Uma seta verde significa que é uma boa oportunidade para comprar. [AVISO E RECOMENDAÇÕES]
Negociar Forex e instrumentos financeiros alavancados envolve risco significativo e pode resultar na perda de seu capital investido. Você não deve investir mais do q

Bonjour cette vente nous vous apportera rien elle a juste pour but de récupérer des fond d’un broker malhonnête je n’ai rien à vendre ni à promouvoir bon trade à tous et passez votre chemin. Je doit continuer d’écrire pour valider les 300 caractères mais vraiment n’attendez rien de ce système , un groupe de personne c’est fait arnaquer par un broker qui ne veut pas valider de retrait alors je vais récupérer les fond différents mêmes s’il faut s’assoir sur une jolie Com’ prise par Mql5

Lows Highs Finder
Трендовый индикатор, дающий точные сигналы для входа в сделки. Идеальные точки входа в сделки для валют, крипты, металлов, акций, индексов. Наилучшие результаты на таймфрейме M15\H1 и выше!
Бывает на бирже маркетмейкер, не пускает цену у какого то уровня. С точностью до пункта. Вы хотите увидеть где? Индикатор находит и показывает на каком уровне цена ударилась в одно и то же место 2 или 3 раза! После этого, на следующей свече стрелкой указывает вход. + Свечной GA
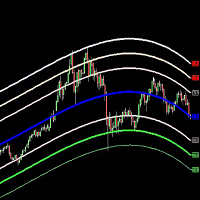
Belkhayate Gravity Center MT5 Custom
The Belkhayate center of gravity indicator is best used to confirm major turning points, and distinguish price extremes. Generally if price reaches the upper or lower levels one should expect a turn around coming soon, or at least a pull back towards the centre line if there is a strong trend. The upper and lower levels are red and green lines.
Our indicator use the same parameters as the well known trader M.Mostafa Belkhayate the inventor of the indi
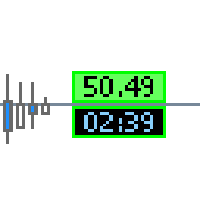
This tool gives you several informations about your broker and the current market events.
The top Infolabel shows the current spread price .
You can set whether the label should be displayed or hidden.
You can adjust price levels for automaticly change of background color.
The lower Infolabel shows the candle timer of the current time frame.
You can set whether the label should be displayed or hidden.
The bordercolor change to red if:
1. you have no connection to the tradeserver
2. y

Description
Range Detector is an indicator that identifies impulses in the market and displays their slope angles on the chart.
Recommendations
You can use this indicator to determine a trend and, accordingly, to determine the direction of opening a position or closing an opposite position.
Parameters
===== _INDICATOR_SETTINGS_ ===== - indicator settings
Maximum History Bars - maximum number of history bars for calculating the indicator. Average True Range Period - ATR indicator peri
GG Signal Scanner ATR base on ATR, MA and RSI indicators to determine trade times and entry points. The indicator scans all currency pairs in Market Watch or according to the list of currency pairs. The entry points will be listed of alerts and sent to the phone or email. Indicators are for use on one chart only and should not be used in conjunction with other indicators. Indicator should be used for M15 - H1 - H4 timeframe. In the strategy tester, the indicator only checks for 1 currency pair

The Premier League indicator links the price in a cyclical-wave relationship. Crossing points can be used as potential market reversal points. Thus, all crossing points will be optimal points at which the movement changes taking into account the indicator period. But do not forget that the approach must be complex, the indicator signals require additional information to enter the market.
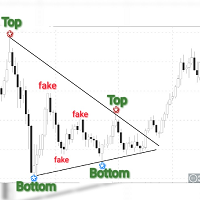
Obaforex Tops & Bottoms is a trading tool born out of a personal need to accurately filter tops and Bottoms and ensure consistency in the way tops and bottoms are picked for technical analysis. Mt4 version https://www.mql5.com/en/market/product/53637
It does not repaint (once top or bottom is printed, it don't disappear) It only prints tops and bottoms after a specified No of bars or candles to the right
This tool is expected to significantly improve the decision making of almost any form o

Индикатор Analytic Trade - это полноценная торговая система. Он состоит из 4 частей: Первая - это стрелочки, показывающие наиболее оптимальные точки открытия и закрытия ордеров. Стрелка вверх - сигнал на покупку, вниз - на продажу. Вторая - это информационная панель в правом верхнем углу. Крупным шрифтом обозначена текущая цена, над ней показаны: максимум дня, расстояние от текущей цены до него и разность максимума и минимума (в пунктах). Под ней расположены: минимум дня, расстояние до минимума,

Данный индикатор предназначен для мониторинга торговой активности вашего счета. Особенно полезен будет тем, кто торгует сразу на нескольких инструментах. В одном окне индикатора собрана наиболее важная информация о счете с детализацией по инструментам и мониторингом заработка. Описание настроек: Start from date history - с какой даты индикатор будет обрабатывать торговую историю Max symbol on screen - индикатор берет данные по символам из обзора рынка. В данной настройке вы можете ограничить
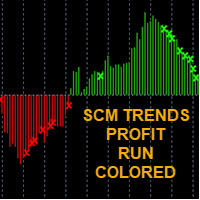
-EASY TO FOLLOW TRENDS -RED SELL / GREEN BUY -CROSS SIGNAL IS MEAN "TRENS WARNING" TO EXIT ORDER (WEAK TRENDS)
-WITH AUDIBLE ALERT ON/OFF
SCM indicator with different colors at levels 0, 100 and -100. The cross is a signal for " Exit" This exit signal is effective especially in short-term breakout trades, because it prevents early exiting at small corrections.
*****TIP EURUSD/BTC TF 10 min is work very Well****
****** GOLD TF15min is work very Well***** (after TF 15min show exit buy an

This Currency Meter Calculates Strength Using a currency basket of 28 pairs? This Currency Meter uses a basket of 28 currency pair to define strength. This is very important because it gives an wholesome view of the strength of a currency by considering its reaction to all major currencies paired with it.
This Currency Meter is Multi-timeframe!!! Majority of the currency strength indicators around the market today only has a single time frame view. Even with the so called multi-timeframe versi

FIRST 10 COPIES AT 30 USD, NEXT PRICE WOULD BE 50 USD
HAWA MOMENTUM & TREND PRO (MT5) Advanced trading indicator with proper pre-defined entry and exit levels with almost 80% win rate. Its smart and advanced algorithm detects trend and trend strength using momentum for maximum profits and send signals after filtering out market noise. SETTINGS: Please make sure all inputs are NOT "false" in indicator properties otherwise it will not display identified trades. Directory Location: Download f
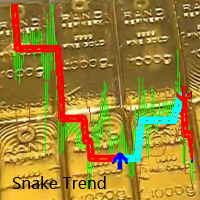
Conteúdo do índice: 1. O preço de referência, refere-se ao preço de referência. No curto prazo, o preço flutua continuamente e desordenadamente, e o destino de curto prazo parecerá imprevisível 2. Referência da direção da tendência
Sugira: Enfraquece as flutuações de curto prazo da linha K e segue a tendência de médio a longo prazo.
"Crescer juntos!" "QQ cooperativa: 556024" "Cooperação wechat: 556024" "Cooperative email: 556024@qq.com"
"A tendência está se formando ou morrend

The Inno Trend indicator tracks the market trend with reasonable reliability, ignoring sharp market fluctuations and noise around the average price. The Inno Trend indicator simplifies the decision-making process by recognizing reversals using a built-in algorithm, and then confirming signals at support / resistance levels, implements a kind of technical analysis based on the idea that the market is cyclical in nature. It can be used both for pipsing on small periods and for long-term trading.

This plots Fibonacci deviation levels above and below a moving average of the price. Companion indicator to the " Golden Bull Wave Trader " expert advisor which uses volume\price trend to determine price reversals. https://www.mql5.com/en/market/product/56291 The expert advisor and this indicator were created in order to: Identify ideal and repeatable trade entries with high level of certainty Create a day trading strategy which doesn’t require a hard SL and TP Use alternate risk management me
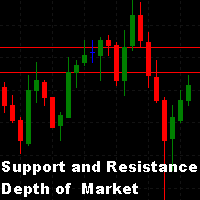
Muitas vezes buscamos pontos de suporte e resistência no gráfico. Uma das técnicas que pode-se utilizar é através da quantidade de lotes oferecidos no livro de ofertas. Este indicador busca os maiores lotes do livro de ofertas e desenha no gráfico em forma de linhas, com isso obtemos onde fica a maior concentração de lotes oferecidos no mercado da bolsa centralizada naquele momento, configurando assim possíveis linhas de suporte e resistência. - A quantidade de linhas a desenhar pode ser definid

A VWAP é um cálculo intradiário usado principalmente por algoritmos e negociadores institucionais para avaliar onde uma ação está sendo negociada em relação à sua média ponderada de volume para o dia. Os day traders também usam o VWAP para avaliar a direção do mercado e filtrar os sinais de negociação. Este indicador serve para analisar e calcular a Vwap a partir de um determinado ponto no gráfico, muito utilizado para analisar o início de um movimento da relação de preços com o volume. - M
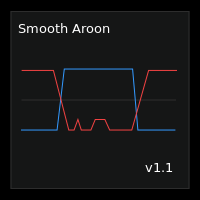
Smooth Aroon is a version of the Aroon Up and Down with smoothing and filtering.
Features :
Smoothing : You have smoothing from 0 to 99 . To smooth a signal, find the maximum value of the points in question then set the smoothing level above the maximum value. For example : If you want to smooth all signals below 30, then you should set the smoothing level above 30 This also smooths all signals above 70, since the Aroon Up and Down Oscillates between 0 and 100. Filtering : If you only
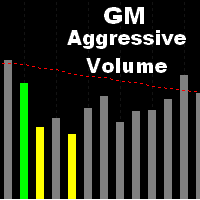
O volume é um recurso utilizado por analistas de várias metodologias, exatamente por mostrar a confirmação dos movimentos e o andamento do mercado. É um indicador que analisa a quantidade financeira que foi negociada durante um determinado período. Este indicador analisa a quantidade de volume a cada candle, quando ocorre um aumento excessivo deste, ele diferencia dos demais por uma barra colorida. Além de informar em formas de barras coloridas, esse indicador permite emitir um aviso sonoro qua

Секвента Демарка (Sequential) - индикатор, демонстрирующий развитие тренда, его структуру. Довольно точно отображает начальную и конечную точки, важные точки перелома. Срабатывает по открытию свечи, поэтому перерисовок не будет никогда.
Здесь нет сложных формул, только статистика, отсчёт свечей, выбранных по определённым критериям. При этом индикатор может давать очень точные сигналы для входа, особенно при поддержке какого-нибудь индикатора уровней, например, этого . Алгоритм нахождения сигнал
Saiba como comprar um robô de negociação na AppStore do MetaTrader, a loja de aplicativos para a plataforma MetaTrader.
O Sistema de Pagamento MQL5.community permite transações através WebMoney, PayPay, ePayments e sistemas de pagamento populares. Nós recomendamos que você teste o robô de negociação antes de comprá-lo para uma melhor experiência como cliente.
Você está perdendo oportunidades de negociação:
- Aplicativos de negociação gratuitos
- 8 000+ sinais para cópia
- Notícias econômicas para análise dos mercados financeiros
Registro
Login
Se você não tem uma conta, por favor registre-se
Para login e uso do site MQL5.com, você deve ativar o uso de cookies.
Ative esta opção no seu navegador, caso contrário você não poderá fazer login.