Conheça o Mercado MQL5 no YouTube, assista aos vídeos tutoriais
Como comprar um robô de negociação ou indicador?
Execute seu EA na
hospedagem virtual
hospedagem virtual
Teste indicadores/robôs de negociação antes de comprá-los
Quer ganhar dinheiro no Mercado?
Como apresentar um produto para o consumidor final?
Pagamento de Indicadores Técnicos para MetaTrader 5 - 31

Crash 1000 Alert is an indicator that alerts trader when price is in the CRASH ZONE. The defaults settings work best only on Crash 1000 Index but are also fully customizable.
How to use: When price enters the crash zone, the indicator will send out messages of a potential crash. Traders can use this info to enter sell trades and capitalize on the spike down. Notifications and alerts are sent to your mobile device and platforms respectively. NB: please make sure notifications are enabled

Long & Short Indicador - Versão Pro: Desbloqueie o Potencial Ilimitado da Sua Análise de Mercado! Sem Restrições para Qualquer Ativo
A versão Pro do Indicador Long & Short oferece total liberdade para usá-lo em qualquer ativo financeiro. Sem mais restrições - aplique o mesmo indicador a todos os seus ativos favoritos! Sem Restrições
Desfrute de todas as funcionalidades do indicador sem qualquer limitação. A versão Pro proporciona uma experiência completa e ilimitada, permitindo que

Description
Money Zones is an indicator that determines accumulation/distribution zones in the market. Green zones make it possible to look for buy entry points or sell exit points. Red zones, on the contrary, define the opportunity for selling or closing buys. The indicator has the ability to define money zones for two timeframes simultaneously on the same chart.
How to use?
Use this indicator to identify market zones as support/resistance zones to determine the best conditions for market e

Control Trading Support And Resistance
Es un indicador independiente del TimeFrame que permite proyectar niveles más relevantes del mercado en función del plazo de tiempo de la operativa. Los colores del indicador están escogidos para diferenciar entre los diferentes tipos de niveles y destacar a los más relevantes. Este indicador permite visualizar en un mismo gráfico los posibles objetivos relevantes que los diferentes traders pueden emplear siguiendo diferentes tipos de operativas en funció
Market Zones MT5 Este indicador proporciona una lectura fácil del mercado basado en niveles estadísticos de Gauss, al igual que la metodología Market Profile. Utilizando una formula exclusiva el indicador estima dinámicamente las zonas que mejor representan dónde los movimientos del mercado permanecerán la mayor parte del tiempo (aprox. 70% del tiempo). Esto nos permite mirar el mercado de una forma más simple evitando caer en movimientos no relevantes. El precio se mueve despacio dentro de la
Description:
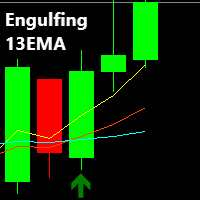
The Engulfing 13EMA is a Multi Timeframe Indicator that scans Multiple Symbols which will help you to identify potential trade set ups. As well as Forex, it can scan Crypto, Exotics, Metals, Indices, Energies or what ever else you have in your Market Watch list. You also have the option to enable/disable the time frames you want to scan. (M1,M5,M15,M30,H1,H4,D1,W1,MN1)
An alert is presented when the 13EMA passes through certain Engulfing candles, based on certain parameters with
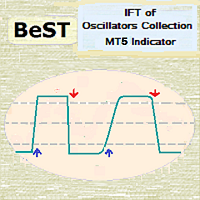
BeST_IFT of Oscillators Collection is a Composite MT4/5 Indicator that is based on the IFT ( Inverse Fisher Transformation ) applied to RSI , CCI , Stochastic and DeMarker Oscillators in order to find the best Entry and Exit points while using these Oscillators in our trading. The IFT was first used by John Ehlers to help clearly define the trigger points while using for this any common Oscillator ( TASC – May 2004 ). All Buy and Sell Signals are derived by the Indicator’s crossings of the Bu

Description :
VWAP (Volume-Weighted Average Price) is the ratio of the value traded to total volume traded over a particular time horizon. It is a measure of the average price at which pair is traded over the trading horizon. Read More.
All Symbols and All Timeframes are supported.
Indicator Inputs :
VWAP Mode : Mode of VWAP Calculation. Options can be selected : Single,Session,Daily,Weekly,Monthly
Volumes : Real Volumes,Tick Volumes
Price Type : Used price for calculating. O

This is a momentum Indicator adapted to work on lower timeframes for Boom and Crash Indeecies. However the indicator can work with other Synthetic Indecies.
The indicator trend colour is set default to Aqua, then sell signal, the colour changes to red and blue signifies buy signals. .
For non Boom nor Crash Indecies use a smaller period and slightly increase the deviation.

QuantXMarketScanner is a multi assets indicator for MT5
- Mathematical model based on 7 custom moving averages indicators - Adaptable on Currencies, Stocks and Crypto - Automatic setup, self optimized
About QuantXsystem Products: – Simple installation & integration into MT5 – Unlimited License after purchase (for one user) – Automatic pattern recognition to identify the best timing and price levels. – Trading indicators are displayed directly and automaticall

QuantXSTocks Trading Range Indicator for MT5:
INSTRUCTIONS TO USE OUR INDICATOR:- User needs to take trade on Arrow or after an Arrow CandleStick, You can achieve up-to 35-125 pips target by this Indicator. Best Timeframes for Stocks and Indices are M30 and H1: AMAZON M30 (50 pips) TESLA M30 (50 pips) APPLE M30 (50 pips) ADOBE M30 (50 pips) NASDAQ100 H1 (125 pips) The above are the approximate amount of pips you can achieve by this Indicator, Green arrow appears to be buy arrow while the Red ar
The moving average is the easiest indicator to recognize changes in the price of a currency.
It is excellent to set multiple indicators for each period or type and see the transition.
However, setting multiple moving averages is very troublesome, isn't it?
Moreover, displaying multiple currency pairs will increase the time and effort.
It is an indicator that saves you the trouble.
You can display multiple moving averages at once.
You can freely set up to 4 lines, line thickness, color a

Saiba em tempo real qual lado, compra ou venda, está exercendo maior pressão através de uma visualização simples e eficiente do Depth of Market. O indicador calcula a soma das ofertas nas profundidades especificadas e exibe o percentual de cada lado em relação ao total. O Indicador PressureBook é totalmente personalizável, nele você pode: Selecionar qual ativo deseja acompanhar. Por default, o ativo selecionado é o mesmo do gráfico em que o indicador foi inserido; Definir a quantidade de níveis
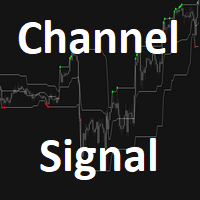
O indicador do canal Forex é projetado com valores extremos de preço para um período específico em mente.
O indicador é composto por três linhas distintamente coloridas que se assemelham às das Bandas de Bollinger.
Sinais básicos de negociação
Buy Signal: Vá longo quando o preço abre e fecha acima da linha média média do indicador e negocia ao longo da borda superior do canal.
Sinal de venda: Vá curto quando o preço abre e fecha abaixo da linha azul média do indicador e negocia ao longo da

>>> Comment ajouter des indicateurs personnalisés ou des EA à MT5 <<< > Ouvrez MT5, > allez dans Fichier> Ouvrir le dossier de données, > puis sélectionnez MQL / 5> 'Experts' ou 'Indicateurs' > et collez votre fichier MQL4 / EX4 ou MQL5 / EX5 dans ce dossier.
Lorsque vous redémarrez la plate-forme, vous devriez maintenant voir votre EA / indicateur personnalisé dans la fenêtre du navigateur.
Vous pouvez le faire glisser et le déposer sur le (s) graphique (s) de votre choix.
>>> Pour rec

Leave a review for this product, and receive another "Free" product that you choose. You can see my other products here: https://www.mql5.com/en/users/zakri/seller
Trend Detective is an advanced trend detection indicator which shows accurate entry points in direction of trend. It uses smart technology in order to detect entry points, trend changing points, and TP points. It also shows hit rate for current chart using selected parameters. Hit rate for this indicator on different charts can be 8

FXC iMACD-DivergencE MT5 Indicator
This is an advanced MACD indicator that finds trend-turn divergences on the current symbol. The indicator detects divergence between the MACD and the price movements as a strong trend-turn pattern.
Main features: Advanced divergence settings
Price based on Close, Open or High/Low prices Give Buy/Sell open signals PUSH notifications
E-mail sending Pop-up alert Customizeable Information panel Input parameters: MACD Fast-EMA: The Fast-EMA variable of the MACD indi
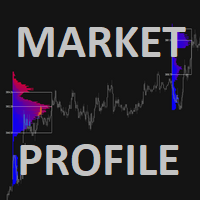
Concept of Market Profile was created at Chicago Board of Trade (CBOT) by trader Peter Steidlmayer and first published during the 1980s as CBOT product. Market profile by itself is not a stand-alone strategy, but a different way how you can view the market and make better trading decisions.
They have seen a market as an auction process which is affected by supply and demand the same way as every other auction, for example, development of prices of food, gas etc.
The price goes up as long ther
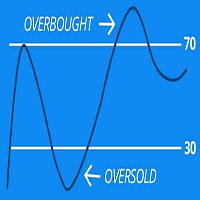
Scan all your favorite pairs with RSI, and get notified on your preferred time frames.
Settings are Customizable
Click to change time frame or open new pairs
Notification: Phone/Popup/Email The relative strength index (RSI) is a technical indicator used in the analysis of financial markets. It is intended to chart the current and historical strength or weakness of a pair/stock based on the closing prices of a recent trading period. The RSI is most typically used on a 14 period, measured on a

GIVE A LOOK TO MY OTHER PRODUCTS !
100 % PER MONTH PROFIT---- MY NEW SIGNAL HERE -------> https://www.mql5.com/en/signals/2162238?source=Site+Signals+My# BROKEN TRENDLINE ALERT IS A SIMPLE TOOL INDICATOR. JUST DRAW IN YOUR CHART A DYNAMIC OR STATIC TRENDLINE,AND THE INDICATOR WILL SEND YOU ALERT WHENEVER THE PRICE CROSSES BELOW OR ABOVE YOUR DRAWN TRENDLINE. IT WORKS IN ANY TIMEFRAME AND ANY CHART YOU WANT.JUST GOT A VPS AND DON'T STRESS IN FRONT OF YOUR COMPUTER.
FOR ANY KIND OF QUESTION ,

ALARME RSI (para Metatrader 5)
Este indicador funciona como um RSI normal com todas as suas configurações (periodicidade, cores, níveis, etc),
mas, adicionalmente, os alarmes podem ser definidos no nível superior e inferior (Exemplo 70 e 30), com a possibilidade de ajustar esses níveis movendo as linhas azul e vermelha para estabelecer os níveis superior e inferior.
Você também pode ativar e desativar uma função adicional que cria uma seta no gráfico quando o RSI superior ou inferior esperad

The Market Sessions Indicator for MT5 helps you predict market turnarounds by detecting major supply and demand areas. These pivot points tend to occur after a new session has started and the previous one is still open. It is also used to gauge how many points or pips the market moves on average during a session. This helps us to place better our take profits and stop losses. The indicator works on all forex pairs, gold, silver, commodities, stocks, indices and any other instrument that your

GIVE A LOOK TO MY OTHER PRODUCTS ! 100 % PER MONTH PROFIT---- MY NEW SIGNAL HERE -------> https://www.mql5.com/en/signals/2162238?source=Site+Signals+My# MACD Cross Alert is a tool indicator that notificate directly to your phone whenever the signal line crosses the base line. For more accurate signals,crosses are filtered like this : Buy Signal : SIGNAL LINE CROSSES ABOVE BASE LINE AND BOTH ARE ABOVE THE 0 VALUE Sell Signal : SIGNAL LINE CROSSES BELOW BASE LINE AN

O Termômetro de Mercado pode ser utilizado para ajudar os traders a identificarem períodos sonolentos ou turbulentos.
Ele auxilia os principiantes a verificar quando é o momento ideal para entrar nas operações, ou seja, quando o valor do termômetro está abaixo da sua média por vários períodos, identificando um mercado tranquilo. Quando o mercado está aquecido, ou seja, o termômetro está acima do triplo da sua média, é o momento de realizar lucros. O Termômetro mede até que ponto o extremo de um

Ao analisar séries temporais financeiras, os pesquisadores geralmente fazem uma suposição preliminar de que os preços são distribuídos de acordo com a lei normal (Gaussiana). Essa abordagem se deve ao fato de que um grande número de processos reais pode ser simulado usando a distribuição normal. Além disso, o cálculo dos parâmetros desta distribuição não apresenta grandes dificuldades. No entanto, quando aplicada aos mercados financeiros, a distribuição normal nem sempre funciona. Os retornos do

GIVE A LOOK TO MY OTHER PRODUCTS ! 100 % PER MONTH PROFIT---- MY NEW SIGNAL HERE -------> https://www.mql5.com/en/signals/2162238?source=Site+Signals+My# Breakout Wall is a very cool indicator. It paints a resistance and a support in the chart given by a " n " number of candles ( you can choose the parameter ),and give you an alert when a candle closes below a support or above a resistance.Very important tool if you trade daily candles for example..... Just close your pc and don'

O indicador identifica os padrões de 3 (três) Candles:
Três Soldados Brancos; Três Corvos Pretos; São padrões de reversão muito utilizados pelos Traders, pois eles tem uma Alta Probabilidade de mostrar a inversão do movimento atual do mercado.
Exemplificando, caso em uma tendência de Alta apareça Três Corvos Pretos há uma Alta Probabilidade de inversão do movimento Altista atual .
Os Três Soldados Brancos possuem as seguintes características: São 3 candles consecutivos com um bom corpo,

O indicador IndicateMe foi criado especialmente para remover o máximo de ruído possível dos sinais que ele fornece.
O indicador foi combinado com vários outros indicadores bem conhecidos. Indicadores que têm sido utilizados: "Média móvel, indicador estocástico, índice de força relativa, móvel".
Todos os indicadores usados podem ser ajustados por você. As configurações padrão são definidas com os valores que eu gosto de usar.
Defina alertas facilmente para se manter sempre informado sobre
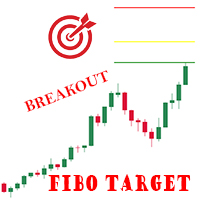
Indicador mostra no gráfico 3 níveis de expansão de Fibonacci, baseado no último Pivô rompido. Os pivôs são calculados com base na volatilidade (ATR), por isso funciona em qualquer ativo, em qualquer Timeframe. As linhas são exibidas apenas após o rompimento do pivô. Um comentário no canto superior esquerdo mostra o valor mínimo calculado para os pivôs. Parâmetros: Variação: variação mínima para considerar o pivô. Fator de multiplicação da ATR. (default 3) Periodo ATR: Período para cálculo da AT

Leave a review for this product, and receive another "Free" product that you choose. You can see my other products here: https://www.mql5.com/en/users/zakri/seller
Harmonic Patterns Detector indicator draws harmonic patterns on chart. Harmonic patterns have a high hit-rate of around 80% and are excellent for trade entries. They are used as price reversal points. Some of them have a long history of usage and were created by famous traders like H. M. Gartley. Many harmonic patterns are included
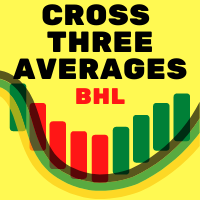
Esse indicador é baseado no sistema de três médias móveis onde: Primeira é a média rápida (MA1); Segunda é a média intermediária(MA2) e; Terceira é a média lenta(MA3). A teoria abordada nos livros de análise técnica nos informa que quando a primeira média ultrapassa a segunda média é um alerta para o trader, porém a confirmação do movimento se dá quando a segunda nédia ultrapassa a terceira. O indicador irá inserir o símbolo check quando ocorrer a confirmação do padrão.
Conheça Nossos Produtos

Plucking Machine
Plucking Machine is a trend indicator designed specifically for gold and can also be used on any financial instrument. The indicator does not redraw and does not lag. Recommended time frame H1. The current setting is applicable for all time periods. It shows the current direction of the market based on price movements. Corresponding products of indicators: https://www.mql5.com/zh/market/product/61388?source=Site+Market+Product+Page#description
The brother Indicator : http

PROMOTIONAL OFFER. NEXT PRICE WOULD BE 125 USD.
HAWA is pleased to introduce Price Action Setup indicator for all symbols with high success rate. It's advanced algorithm finds the spots for you where smart money is moving in or out of the market. Indicator will produce signals with pre-calculated entry and exit levels keeping money management in place. The system aims to achieve small, steady and consistent profits and reduce losses.
Unique Features: High Probability Success rate. Steady pro

Plucking Machine I Plucking Machine I is a trend indicator designed specifically for gold and can also be used on any financial instrument. The indicator does not redraw and does not lag. Recommended time frame H1. The current setting is applicable for all time periods. It shows the current direction of the market based on price movements. Corresponding products of indicators: https://www.mql5.com/zh/market/product/61388?source=Site+Market+Product+Page#description

This indicator provides you with MACD formula applied to volume-aware Accumulation/Distribution and OnBalance Volumes indicators. In addition to tick volumes it supports special pseudo-real volumes, synthesized for Forex symbols where real volumes are unknown. More details on the volume surrogates may be found in description of another indicators - TrueVolumeSurrogate and OnBalanceVolumeSurrogate (algorithm of the latter is used internally in MACDAD for AD and OBV calculation before they procee

GIVE A LOOK TO MY OTHER PRODUCTS ! 100 % PER MONTH PROFIT---- MY NEW SIGNAL HERE -------> https://www.mql5.com/en/signals/2162238?source=Site+Signals+My# Double MA Cross Alert,is a cool indicator that notificate you directly on your telephone or email when 2 Moving average ( you choose the parameters ) crosses. This is very important when you want to know a change of trend and you can't stay in front of your pc! The indicator give you the alert just when the next bar opens ,so give you a more

Automatic Fibonacci Tool Fibonacci retracements is a popular instrument used by technical analysts to determine potential Support and Resistance areas. In technical analysis, this tool is created by taking two extreme points (usually a peak and a minimum) on the chart and dividing the vertical distance by the key Fibonacci coefficients equal to 23.6%, 38.2%, 50%, 61.8%, and 100%. Our Automatic Fibonacci Tool is programmed to make thigs easier. Using this tool, there is no need to explicitly set

Advanced Support and Resistance Support and resistance levels are widely used in trading. They are important as they show some key price levels. Before applying any strategy, one may consider it necessary to draw support and resistance. However, this process can take much time especially if one is to analyse a lot of currency pairs, commodities or indices. This Advanced Support and Resistance tool was designed for traders at any level, amateur to professional. It plots key support and resistance

Tool for Identifying Potential Reversal Points and Trend Direction This tool is excellent for identifying potential market reversal points and trend direction. It works well in combination with confirming indicators such as MACD, Stochastic, RSI, which are standard on all MT5 platforms. Together, they form a reliable trading strategy. The settings allow for adjusting the channel’s distance and period. It is recommended to enter a trade when the signal line crosses the upper channel boundary and

Binary Options Trading Tool An excellent and reliable assistant in achieving your goals, this tool requires no additional filters as it already possesses everything necessary for success in the market. It is displayed as candles below the chart, providing clear signals for trading binary options. Key Feature: Candle Color Change Signal : Signals are generated based on the color change of the candle at its opening. Expiry Time : Expiry is set at 2 minutes or 2 candles, depending on the timeframe

O indicador mede o saldo de agressão acumulado. A fórmula é a seguinte: Acumulado = Acumulado do Candle Anterior + Volume de Compra - Volume de Venda.
Conheça Nossos Produtos
***** Gostou do produto? Então, nos ajude fazendo sua avaliação na aba " Comentário ". *****
Nota: Recomenda-se utilizar os valores padrões de configuração e VPS. É necessário as informações de negociações(Time nd Sales).
O indicador envia para o seu email ou celular informação quando o saldo acumulado inverte de

O indicador mede o saldo de agressão para cada Candle. A fórmula é a seguinte:
Agressão = Volume de Compra - Volume de Venda.
Nota: Recomenda-se utilizar os valores padrões de configuração e VPS. Não funciona em Forex.
Conheça Nossos Produtos
Parâmetros : Números de dias anteriores ao atual para cálculo; Divisor do Volume e; Habilita cálculo do candle atual; Histograma Estilo da linha e; Tamanho; Linha Estilo da linha e; Tamanho;
Acompanhe-nos no nosso sites e envie sua dúvida na aba
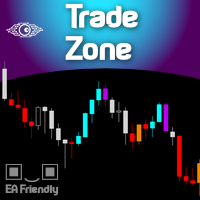
For those who are fans of Bill William's strategy, here it is the Trade Zone indicator filled with alerts and a better coloring system and EA ready (BUY & SELL buffers). And for those who don't know Bill Williams work, search Amazon for the title " Trading Chaos: Maximize Profits with Proven Technical Techniques ". This indicator internally uses the widely known Awesome Oscillator along with the Accelerator indicator, and when both are aligned it lights up the candles signaling a probable strong

Description
Bitcoin Manager is the best indicator for trading Bitcoin cryptocurrency. It is calculated based on the price deviation from the moving average line channel. Ascending and descending arrows indicate potential points and levels for opening buy and sell positions.
How to use?
We strongly recommend using this indicator on the H1 timeframe. An up arrow indicates a buy level. Down Arrow - Sell Level.
Parameters
Maximum History Bars - maximum count of history bars to calculate. _GRAP

O indicador plota no gráfico o volume de compra e de venda.
São gerados duas linhas correspondendo as médias dos volumes de compra e venda.
Suporte e dúvidas dos produtos no link Abaixo: Suporte
O Cruzamento das médias, o aumento do distanciamento das mesmas são bons indicativos de movimento do mercado. Conheça Nossos Produtos
Nota: Recomenda-se utilizar os valores padrões de configuração e VPS. É necessário as informações de negociações (Time and Sales).
Parâmetros : Agressão Números

根据高开低收价格确定反转点位,画出的极点折线。 The pole polyline is drawn according to the high opening and low closing price to determine the reversal point.
参数(Args):
1.周期数(Period)。参与界限计算的K柱数量。 2.界限(Divide)。计算方式包括: t1,顺高低价 (Buy min H,Sell max L) t2,逆高低价 (Buy min L,Sell max H) t3,收盘价 (Buy min C,Sell max C) t4,开盘价 (Buy min O,Sell max O) t5,高开低收价的一半 (HOLC/2) t6,高开低收价的一半+1 (HOLC/2+1) t7,高开低收价的一半+2 (HOLC/2+2) 3.跨越界限使用的价格(Price)。包括收盘价(C)和高低价(HL) 4.偏移(Of

If You Are Discretionary Trader This Tool Is A Must Chart Switcher ------> Linking Multi-Time Frame Charts / Syncing Indicators And Drawings. Main USP Of This Indicator: Is Opening Multi-Time Frame Multiple Charts {Up To 10 Charts} Of A Symbol With Just 1 Click. You Do not Have To Save Any Template As It has Been Save Auto When You Click Same Symbol Or Move To Another Symbol. It Is Divided Into 2 Parts: 1} COMMON MODE and 2} SYMBOL MODE 1} COMMON MODE: Under This Mode, You Can Sync Commo

Anchored VWAP (with no Volume) A unique development of one of the most useful VWAP indicators. This product allows you to get away from using the basics of VWAP, namely the volume. Everything is calculated without it. In addition, a convenient system for selecting starting points has been developed - by moving the "starting field" you indicate to the script the area, in which the extremum, from which the calculation will start, should be searched for. The main advantages of this development: con

This indicator calculates Correlation among currency pairs (Selected by user) to find the least and/or most correlated symbols in real time. Correlation ranges from -100% to +100%, where -100% represents currencies moving in opposite directions (negative correlation) and +100% represents currencies moving in the same direction.
Note The Correlation more than 80 (Adjustable) between two currency pairs, Shows that they are quite similar in the kind of movement and side. The Correlation less than
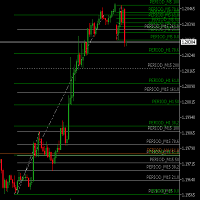
Sets and Updates Fibo-Retracemnet-Levels for Multi Timeframes. Helps to Find TradeZones combined over Multi-Timeframes. M1 M5 M15 H1 H4 D1 are analyzed and shown. Color Changes as soon 161 and 261 Retracements are reached to visualize possible Targets/ TakeProfit Zones . No Settings for Indicator available . Fibonacci retracements are set using a fixed Logic.

Profit Loss Meter For the serious trader this fun easy to use indicator allows you to measure Profit and Loss of current, closed or future trades on your forex account chart. It measures Currency Pairs And Indices plus estimates margin levels at the trade close point. The Profit/Loss indicator is based on MT5 native Crosshair instrument. TO ACTIVATED USE "HOT KEYS" ctrl+f just as you would for activating the Crosshair. left click and hold then drag in the direction in which you would like to m

Here I present you this awesome indicator I made. This is a nique combination witch puts you in the same level as MM's. So you can surf a lot of waves and identify the rally time, breakouts, and the perfect time to get in the market. ----
The SSL Channel is a great all-rounder based on 2 Simple Moving Averages, one of recent Highs, one of recent Lows. The calculation prints a channel on the chart consisting of 2 lines. This strategy gives a Long signal when price closes above the top of thes
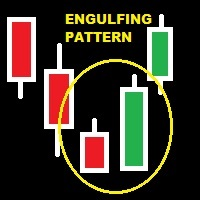
GIVE A LOOK TO MY OTHER PRODUCTS ! There are patterns that are more affidable then others.One of the most important is the engulfing pattern .It is very helpful to understand if there is a change of trend. This indicator find for you affidable engulfing patterns and send you an alert when a pattern is completely formed . To make this alert indicator more reliable,there is a parameter that you can change relative to the engulfing bar ( so the lost one closed before signal ). In fact you can cho

Sinal com base no indicador RSI, que indica compra marcando com uma seta verde quando o preco sai da região de sobrevendido, e sinaliza venda quando o preco sai da regiao de sobrecomprado. A sinalizacão é feita com uma seta verde para compra e seta rosa para venda. Permite configurar o nível de sobrecompra e de sobrevenda, além do período do RSI. Funciona em qualquer período gráfico.

GIVE A LOOK TO MY OTHER PRODUCTS !
100 % PER MONTH PROFIT---- MY NEW SIGNAL HERE -------> https://www.mql5.com/en/signals/2162238?source=Site+Signals+My# Morning and evening star are 2 famous and reliable candlestick patterns, very helpful to understand an imminent change of trend. This indicator finds for you this patterns on your chart and send you an alert just when a pattern is 100 % formed. To make this indicator more reliable,you

This indicator provides an original mix of WPR, VSA, and volume delta. It shows ratio of buy/sell volumes scaled on 100% range based on total volume change for a selected period. The convetional VSA (Volume Spread Analysis) studies interconnections of price action and volume change in absolute values, whereas WPR (Williams Percent Range) offers a convenient approach of price moves normalization into the fixed percentage metric: 0 - 100%. Hence overbough and oversold states are easily spotted. N

TrendMeasurer indicator manual / TMi manual The indicator is designed to help the user to find the end point of a strong trending price movement. Important - END. Not start. How the indicator works The first price impulse and its subsequent pullback form a certain "critical mass" which acts as "fuel" for further price movement. The production of this fuel indicates the potential end of the trend. Both volume and indicator calculated in a certain way from price data can be the fuel. The amount of

TrendMeasurer indicator / TMi The indicator is designed to help the user to find the end point of a strong trending price movement. Important - END. Not start. How the indicator works The first price impulse and its subsequent pullback form a certain "critical mass" which acts as "fuel" for further price movement. The production of this fuel indicates the potential end of the trend. Both volume and indicator calculated in a certain way from price data can be the fuel. The amount of "fuel" can be
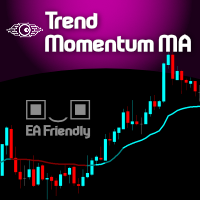
Imagine a simple and powerful line that gives you everything you need: Trend and Momentum . Welcome to the Trend Momentum Moving Average ! Visually it seems like a very simple Moving average, but in fact it is a VIDYA ( Variable/Volatility Index Dynamic Average ) type of moving average - originally created by Tushar Chande - and the main purpose of this special Moving Average is to understand and interpret the current volatility of the market and apply it as a smoothing factor for a traditional

The delta indicator is used to display the difference between the volume that passed on the exchange at the Ask price and above (market buys) and the volume that passed at the Bid price and below (market sales). This indicator shows the delta of each candle on the timeframe of your choice. The data is displayed as a colored histogram in a separate indicator window. The indicator is calculated from the tick history, therefore, to speed up the calculations and reduce the load on the system, the n

An effective indicator that highlights candles with increasing volumes, overshadowing those with shrinking volumes. Also suitable for Forex because it uses tick_volume.
You can set the colors to your liking. It will be easier to spot trends and possible reversals. The increasing volumes indicate the presence of large investors and therefore determine the reliability of the candle under observation

The trading system is designed to work with gold on time periods: 30M, 1H. The indicator allows you to adjust to the market situation.
Parameters for 1H : PERIOD=9F , FILTER=300 .
Parameters for 30M : PERIOD=22B , FILTER=450 .
A small adjustment to a specific broker is allowed .
If you change the amount of history displayed, you may also need to adjust the parameters.
The indicator is not redrawn.
"Gold n XAU" uses different rules for entering a trade and different rules

A distribuição de Cauchy é um exemplo clássico de distribuição de cauda gorda. Caudas grossas indicam que a probabilidade de uma variável aleatória se desviar da tendência central é muito alta. Portanto, para uma distribuição normal, o desvio de uma variável aleatória de sua expectativa matemática em 3 ou mais desvios padrão é extremamente raro (a regra dos 3 sigma), e para a distribuição de Cauchy, os desvios do centro podem ser arbitrariamente grandes. Esta propriedade pode ser usada para sim

Indicador en MQL5 que obtiene el promedio de 10 EMAS que son alineadas y procesadas según Fibonacci luego el promedio es suavizado" Se ingresa un número de 2 a N que multiplica los EMA-Fibonacci y por consiguiente aumenta los fibonacci, resultando un promedio. Se ingresa un número que suaviza los EMA-Fibonacci. Considerando los números 1/1 seria la suavización minima. Considerando los números 3/5 seria la suavización media. Considerando los números 10/30 seria la suavización alta.....etc
Daily Percentage Change (MetaTrader indicator) — calculates the change of currency rate related to the previous daily close and displays it in percentage points in the main chart window of the platform. Additionally, it can display the weekly and monthly percentage changes. Different colors can be set for positive or negative price increases. Also, a small customizable arrow helps to visualize the price change direction. If your broker uses an unconventional time zone, the indicator can use
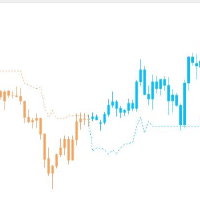
Stable trend index without clutter The index optimizes the moving average and removes the unstable clutter It can also be used in any other commodity It is best used in mainstream currencies such as EURUSD, USDJPY, GBPUSD and AUDUSD
The time period is 1 hour
I only know a little English, please forgive me if you don't understand I will always improve this indicator
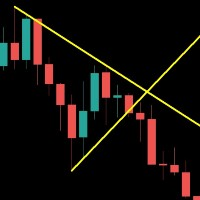
Save your time . Select area and the trend line will draw automatically . Draw a support and resistance line for the selected range with two mouse clicks . If you need to, you can also draw a line for support and resistance based on separate areas.
The resistance trend line is drawn based on the first and last highs inside the selected area; The support trend line is drawn based on first and last lows inside the selected area;

Non standard attitude to the standard moving average indicator. The essence of the indicator is to determine the strength and speed of the price direction by determining the tilt angle of the moving average. A point is taken on the fifteenth MA candle and a point on the last closed MA candle, a straight line is drawn between them, it is movable and on a hemisphere shows an angle of inclination from 90 degrees to -90. above 30 degrees is the buying area, below -30 degrees is the selling area. abo

GIVE A LOOK TO MY OTHER PRODUCTS ! 100 % PER MONTH PROFIT---- MY NEW SIGNAL HERE -------> https://www.mql5.com/en/signals/2162238?source=Site+Signals+My#
The Parabolic SAR (PSAR) helps trader identifying direction of the stock movement and also provides them with the entry and exit. This indicator on the chart appears as a series of dots either above or below the price bars. When the Dots are below the price bar is then the price movement is considered to be bullish and when the Dots are abo
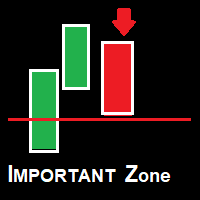
Zona Importante. O indicador Zona Importante é um indicador desenvolvido com todo meu conhecimento no mercado. o que voce podera esperar dele? o Indicador gerara alerta em toda e qualquer Reversao, seja uma reversao de fato ou um simples pullback ou seja a cada mudanca de direcao ocorrera um alerta. - Beneficios: - Nao deixara voce perder oportunidade.
O sell signal significa que uma nova onda de queda ocorrera. O buy signal significa que uma nova onda de alta ocorrer
O Mercado MetaTrader é o melhor lugar para vender robôs de negociação e indicadores técnicos.
Você apenas precisa desenvolver um aplicativo para a plataforma MetaTrader com um design atraente e uma boa descrição. Nós vamos explicar como publicar o seu produto no Mercado e oferecer a milhões de usuários MetaTrader.
Você está perdendo oportunidades de negociação:
- Aplicativos de negociação gratuitos
- 8 000+ sinais para cópia
- Notícias econômicas para análise dos mercados financeiros
Registro
Login
Se você não tem uma conta, por favor registre-se
Para login e uso do site MQL5.com, você deve ativar o uso de cookies.
Ative esta opção no seu navegador, caso contrário você não poderá fazer login.