Conheça o Mercado MQL5 no YouTube, assista aos vídeos tutoriais
Como comprar um robô de negociação ou indicador?
Execute seu EA na
hospedagem virtual
hospedagem virtual
Teste indicadores/robôs de negociação antes de comprá-los
Quer ganhar dinheiro no Mercado?
Como apresentar um produto para o consumidor final?
Indicadores Técnicos para MetaTrader 5 - 83
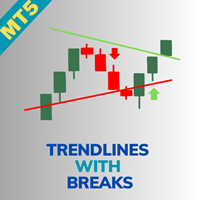
Indicator Name: Trendlines with Breaks [LuxAlgo] Overview: The Trendlines with Breaks [LuxAlgo] indicator provides traders with pivot point-based trendlines that highlight real-time breakouts. This tool is highly customizable, allowing users to adjust the steepness of trendlines, choose different slope calculation methods, and receive alerts on trendline breakouts. Key Features: Pivot Point-Based Trendlines: The indicator automatically generates trendlines based on pivot points, providing a clea

Buy Sell Storm
Professional indicator for trading on financial markets, designed for MT5 platform .
Trading on the indicator is very simple, Blue arrow to buy , Red arrow to sell.
The indicator does not redraw and does not change its values.
After purchase write to me and I will send you a Bonus in the form of an EA Buy Sell EA on this indicator.
( see the video of the EA on the indicator, the set file is attached).
In the default settings the Period parameter is set to

Trendline Wizard Overview: The Trendline Wizard is a powerful and versatile MetaTrader 5 indicator designed for traders who rely on trendlines for their technical analysis. This indicator automatically monitors specified trendlines and provides real-time alerts when price action interacts with these critical levels. Whether you’re a swing trader, day trader, or long-term investor, the Trendline Wizard is an essential tool to enhance your trading strategy. Key Features: Customizable Alerts : Set
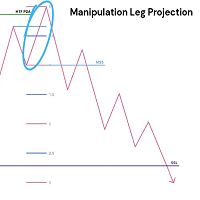
This indicator delves into using standard deviations as a tool in trading, specifically within the Inner Circle Trader (ICT) framework. Standard deviations are a statistical measure that helps traders understand the variability of price movements. These projections is use to forecast potential price targets, identify support and resistance levels, and enhance overall trading strategies. Key Concepts: Understanding Standard Deviations : Standard deviations measure how much a set of values (in thi

Resumo O Indicador de ATR Multinível e Bandas de Média Móvel é uma ferramenta poderosa projetada para ajudar os traders a identificar tendências de mercado, níveis de suporte e resistência, e volatilidade. O indicador combina múltiplas médias móveis com um multiplicador de ATR (Amplitude Média Verdadeira) para criar um gráfico de bandas visual ao redor da flutuação dos preços. Ajuda os traders a detectar possíveis áreas de reversão, condições de tendência e zonas de consolidação do mercado. Cara
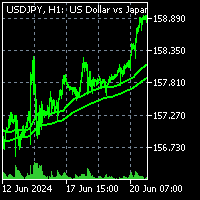
To get access to MT4 version please click here . This is the exact conversion from TradingView: "Liquidity Weighted Moving Averages" by "AlgoAlpha ". This is a light-load processing and non-repaint indicator. All input options are available expect time frame input . Buffers are available for processing in EAs. You can message in private chat for further information/changes you need. Thanks for downloading

Indicador TK - Rainbow Descrição: O indicador TK - Rainbow é uma ferramenta robusta para análise técnica, projetada para fornecer uma visão clara das tendências de mercado por meio de uma abordagem com várias linhas. Com 30 linhas calculadas em diferentes períodos, oferece uma análise extensa dos movimentos de preços. O indicador utiliza um esquema de duas cores para destacar tendências de alta e baixa, facilitando a interpretação das condições do mercado de relance. Principais Características:

Volume Delta Candles offer a straightforward way to analyze trading activity within each candle, making it easier to see what's happening without needing an extra volume indicator. This tool uses lower timeframe or real-time data to show the percentage of buying and selling volume within a candle as a colored bar. Make sure you understand Volume and Volume Delta before jumping in. If you’re not sure, reach out to me first for a quick rundown. But if you're already familiar, you're good to go! Ke

MACD ADX Oscillator for MT5 Elevate your trading strategy with the MACD ADX Oscillator – a powerful indicator that combines the best of the Moving Average Convergence Divergence (MACD) and the Average Directional Index (ADX) to provide unparalleled insights into market momentum and trend strength. Key Features: Dual Momentum Analysis : This indicator merges MACD's ability to detect changes in market momentum with ADX's strength measurement, giving you a comprehensive view of the market's directi

Percentage Price Oscillator (PPO) for MT5 Unlock deeper market insights with the Percentage Price Oscillator (PPO) for MT5 – a dynamic tool designed to measure price momentum and trend direction with precision. Core Features: Flexible Configuration : Customize the PPO to match your trading approach by adjusting the Fast Length, Slow Length, and Signal Length. The indicator is also versatile enough to adapt to any market condition with various source inputs. Intuitive Histogram Display : Choose t
Bem-vindos à teoria do Cubo de Tomas Lekim . A Teoria se baseia no calculo do maior padrao existente na natureza . Um padrao que contem todos os outros padroes e sequencias . Todos os padroes como numeros primos , Fibonacci e outras sequencias de numeros estao contidas na malha universal da minha teoria . É possivel perceber o padrao dos precos e o encontro entre as duas forças contraria existentes em toda a logica de negociacao e competicao . .Jogos em que um time compete com outro time . Jogo
Ekom Spike Detector
Navigate the volatile world of Boom and Crash indices with the Ekom Boom and Crash Spike Detector Indicator. This powerful tool detects explosive price movements, providing traders with accurate buy and sell signals 24/7.
Key Features:
- Accurate Spike Detection : Identify high-probability spike patterns in real-time - Clear Visual Signals : Displays clear buy and sell arrows on the chart for easy decision-making - Customizable : Easily switch from either Boom or Crash
FREE
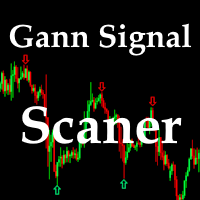
This indicator is based on the Gann Signal indicator and acts as a market scanner. All you need to do is fill in the selected currency pairs in the settings and that’s it. Next, the indicator itself will view all these currency pairs and time frames from M5 to D1 simultaneously. When a new signal appears, the indicator will give you an Alert and also draw the letter N where this new signal will be.
Você sabe por que o mercado MetaTrader é o melhor lugar para vender as estratégias de negociação e indicadores técnicos? Não há necessidade de propaganda ou software de proteção, muito menos problemas de pagamentos. Tudo é providenciado no mercado MetaTrader.
Você está perdendo oportunidades de negociação:
- Aplicativos de negociação gratuitos
- 8 000+ sinais para cópia
- Notícias econômicas para análise dos mercados financeiros
Registro
Login
Se você não tem uma conta, por favor registre-se
Para login e uso do site MQL5.com, você deve ativar o uso de cookies.
Ative esta opção no seu navegador, caso contrário você não poderá fazer login.