Regardez les tutoriels vidéo de Market sur YouTube
Comment acheter un robot de trading ou un indicateur
Exécutez votre EA sur
hébergement virtuel
hébergement virtuel
Test un indicateur/robot de trading avant d'acheter
Vous voulez gagner de l'argent sur Market ?
Comment présenter un produit pour qu'il se vende bien
Indicateurs techniques pour MetaTrader 5 - 83

Description of the Indicator Trend Stop shows the highest/lowest value of the last N periods. Can help traders identify the trend direction and potential stop levels. Use Trend Stop indicator to detects the trend direction.
Downtrend if the price crosses the Trend Stop line upwards Uptrend if the price crosses the Trend Stop line downwards
Use Trend Stop indicator to define optimal stop levels. Downtrend Place your stops above the Trend Stop line Uptrend Place your stops below the Tr
Optimized for Asia- London- US- Open-Session true Momentum - time-based Indicator
Filter
Daytime Weekdays Moving Averages Keltner-Channel
Advantages Optimized for Asia- London- US- Open-Session choose your personal times to trade - select Daytime and Weekdays Keltner-Channel => to reduce market noise - sideways movement will be hidden 3x Moving Averages => for the Trend Signal after close - no repaint
Alerts
Email Screen-Alert Push-Notification

FusionBlocks: Decode Market Structure Unlock the full potential of your trading with FusionBlocks, the ultimate MT5 indicator for smart money concepts (SMC) traders. Designed to provide a comprehensive understanding of market structure, FusionBlocks is an indispensable tool for traders looking to enhance their strategy and performance. Key Features Order Block Detection : Automatically identifies and draws order blocks on the chart, helping you pinpoint key areas of interest. Break of Structure

Pour un téléchargement gratuit, rejoignez notre groupe. Offre limitée dans le temps ! Nous vous présentons notre indicateur MQL5 innovant, conçu pour améliorer votre expérience de trading en fournissant des repères visuels clairs des limites des chandeliers journaliers sur des unités de temps inférieures. Cet outil est parfait pour les traders qui veulent rester informés de l'évolution des chandeliers journaliers, garantissant une meilleure prise de décision et une exécution stratégique. Caracté
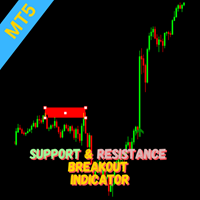
Indicator Overview This indicator utilizes the Zigzag indicator to identify potential support and resistance levels. When the price action breaks through one of these levels, a trading signal is generated. How it Works The Zigzag indicator is employed to pinpoint significant price highs and lows, forming potential support and resistance areas. A signal is triggered when the current candle closes beyond a previously established support or resistance level. Traders can consider entering a position
CLIQUER ICI POUR UN TELECHARGEMENT GRATUIT Cet indicateur de trading Identifie et trace automatiquement les blocs de contrat, zones essentielles marquées par des niveaux significatifs de support et de résistance. Ce puissant outil offre aux traders une visualisation claire et intuitive des points critiques du marché où les prix montrent une forte probabilité de rebond ou d'inversion . Les blocs de contrat, représentés par des rectangles colorés distincts, mettent en évidence les zones de support

VolaMetrics VSA | Un Puissant Allié dans l'Analyse Technique Le VolaMetrics VSA est un indicateur d'analyse technique qui combine la méthode Volume Spread Analysis (VSA) avec une analyse détaillée du volume des transactions . Conçu pour identifier et suivre les mouvements significatifs des prix , le VolaMetrics VSA utilise l'interaction entre volume et écart de prix pour fournir des insights précieux qui peuvent aider à prendre des décisions de trading. Les Fondements de la Volume Spread Anal

Breakthrough signal indicator for the MT5 platform: Your reliable assistant in the world of trading!
We are pleased to present you with an innovative signal indicator, which was created in collaboration with an outstanding mathematician. This indicator combines advanced algorithms and the best of the world of mathematical analysis, providing traders with a unique tool for predicting market movements.
Why is this indicator unique?
1 .Entry signals without redrawing If a signal appears, it
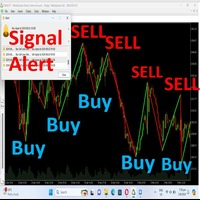
Hello Traders, *-For your bonus one indicator with SL,TP zone* just give your review, comment.Once finish developing I will give you**** Trend identification Indicator This is a indicator that will identify trend zone as bearish and bullish zone . This indicator can use for all pairs and any timeframe you can use it . *Green lime mean buy.Red line mean sell.You will receive alert sound when signal generate. The create best on high, low point and moving average calculation. You can customize valu
The VSA Scanner Dashboard is a multi-symbol, multi-timeframe scanner that displays VSA signals. It is based on the Volume Plus and VSA Signals indicator. Features Displays the VSA signal of the last closed candle. Monitors 28 customizable instruments (symbols) and up to 21 timeframes at the same time. Easily arrange symbols in any order. Each signal has a tooltip that displays the name and time of appearance. Click on each signal to open a new chart. All types of alerts (sound, pop-up, email,
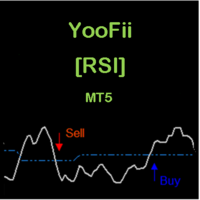
CONSTITUTION YooFii [RSI] is an indicator consisting of an oscillator and a dynamic level. The oscillator, dynamic level and warning signals can be adjusted via the inputs. It is designed for the MT5 platform only. APPLICATION This indicator should be used with a trend filter [e.g. two moving averages, MA 200 and MA 55] [see screen shots for more details]. when the oscillator crosses the dynamic level from bottom to top, we have a BULLISH move. when the oscillator crosses the dynamic level from

Adjustable Consecutive Fractals looks for 2 or more fractals in one direction and sends out a on screen alert, sound alert and push notification, for strong reversal points .
Adjustable Consecutive Fractals, shows the fractals on chart along with a color changing text for buy and sell signals when one or more fractals appear on one side of price.
Adjustable Consecutive Fractals is based Bill Williams Fractals . The standard Bill Williams fractals are set at a non adjustable 5 bars, BUT withe
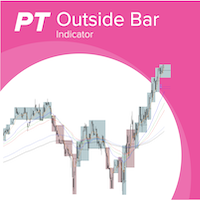
Outside bars (Außenstäbe) are important in professional price action trading and were made popular by Michael Voigt. Highs and lows of outside bars ( Aussenstäbe ) can be utilized as entry and exit for trades following different strategies. With combining different timeframes you can more easily detect the overall trend of the market, see potential resistance and support levels and also detect change in trend and framing of the market. Examples for strategies with inside bars (Innenstäbe) an

This MQL5 Speed Indicator script calculates the average speed of price movements for a selected financial instrument over a specified period. It uses the arithmetic mean to determine the average speed, which is computed by dividing the distance (change in price) by the time interval. The indicator then displays this value as a histogram in a separate window. Average Speed Calculation : The speed is calculated using the formula v = d t v = \frac{d}{t} v = t d , where d d d is the price differen
The "Order Block Indicator for MetaTrader 5" is an advanced trading tool designed to help traders identify key order block zones in the financial markets. Order blocks are areas of institutional buying and selling, often marking significant price levels where market reversals or continuations are likely to occur. This indicator provides a visual representation of these zones directly on the chart, enabling traders to make more informed trading decisions. Key Features: Accurate Order Block Identi

Session Box Indicator for MetaTrader 5
Description: The SessionBox indicator is designed to visually represent the trading sessions on a chart, specifically the Asian, European, and American sessions. This indicator draws customizable rectangles around each session, allowing traders to easily identify different trading periods. It also includes labels to denote each session, enhancing clarity.
Users only need to input the session start and end hours in their server time. Please note, the As
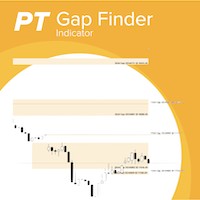
With the gaps finder indicator gaps between trading session are automatically added to you chart and you will never miss a gap which you can use in your trading strategies. Gaps often act as a magnet where the markets returns to or when a gap is closed often constitutes a reversal point.You don't have to draw manually gaps anymore. Key Features: Support for multiple trading sessions in a single chart, e.g market session and future session Configurable number of days to look back for gaps Highly
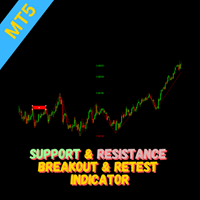
Overview The Breakout and Retest indicator is designed to identify potential trading opportunities by detecting price breakouts from significant support and resistance levels followed by a retest of the broken level. How it Works The indicator analyzes price data to determine key support and resistance areas. When the price decisively breaks through one of these levels and then retest it, then a potential breakout is signaled when it breakout again. To increase the probability of a successful t
You can use the indicator in trend following to detect trend changes. Each color change is a trading signal. It should be used on at least 1 hour charts. It is recommended to use it on 1-day charts. However, it should be noted that the number of meaningful candles (without gap) on your chart should be at least 80.
The calculation method is based on ATR, MA and CCI indicators. However, for a significant part of the calculation I have developed my own algorithm based on standard deviation and r

Elder Impulse Indicator Overview: The Elder Impulse Indicator is a powerful tool designed for traders who want to combine the strengths of trend-following and momentum strategies. Developed by Dr. Alexander Elder, this indicator helps traders identify potential entry and exit points by analyzing both price direction and momentum. It’s an essential tool for making informed decisions in various market conditions, whether you're trend-trading, swing trading, or looking for momentum shifts. Key Fea

"L'indicateur Ultimate Bot Alerts est un outil puissant pour MetaTrader 5 qui aide les traders à identifier les points d'entrée et de sortie potentiels sur le marché. Cet indicateur utilise un algorithme sophistiqué basé sur l'Average True Range (ATR) et l'action des prix pour générer des signaux d'achat et de vente.
Lorsque vous appliquez l'indicateur Ultimate Bot Alerts à votre graphique, vous verrez des flèches vertes pour les signaux d'achat et des flèches rouges pour les signaux de vente

Channel Vertex is a price action pattern formed by price Chanel and a triangle pattern . Price channels basically indicates possible support and resistance zones around a price movement and retracement or breakout at these levels can indicate possible trend continuation or reversal .
Majority of the times price fluctuations forms triangle patterns defined by 3 vertexes , these triangle patterns most times defines a trend continuation. A triangle pattern is a trend continuation pattern tha
Parfaitement conçu pour les traders qui apprécient la clarté, la précision et la facilité d'utilisation, cet indicateur de graphique Renko de pointe fournit tout ce dont vous avez besoin pour améliorer votre stratégie de trading. Contrairement aux générateurs traditionnels qui créent des graphiques hors ligne, cet indicateur délivre des graphiques Renko en temps réel directement sur votre plateforme de trading en direct. L'indicateur Live Renko fonctionne également parfaitement sur les Synthetic

Dans le monde du trading, la clé du succès réside dans la possession des bons outils au bon moment. Notre indicateur de profil de volume innovant a été développé avec un seul objectif en tête : offrir aux traders un accès sans précédent aux informations essentielles sur l'activité du marché. Cet outil de pointe vous permet de voir non seulement où et quand les volumes sont échangés, mais aussi de comprendre la profondeur du marché avec une clarté jamais vue auparavant. Caractéristiques Principal

Introducing our Smart Money Concepts (SMC) and Inner Circle Trader (ICT) indicator, specifically designed for professional traders seeking precision in their market analysis. This tool seamlessly integrates key SMC/ICT concepts directly into your charts, providing clear and accurate visual signals. Highlighted Features: Automatic Order Blocks: Automatically detects bullish and bearish Order Blocks, highlighting zones where institutions operate. Customize colors and styles to suit your trading st

Maximisez Vos Opportunités de Trading avec l'Indicateur "Auto Trendlines" Découvrez l'Indicateur "Auto Trendlines": "Auto Trendlines" est l'outil essentiel pour tout trader technique. Cet indicateur trace automatiquement les lignes de tendance, identifiant les niveaux de soutien et de résistance avec une précision chirurgicale. Il est idéal pour ceux qui cherchent à capitaliser sur les breakouts et les renversements du marché. Caractéristiques Principales: Traçage Automatique des Lignes de Tenda

Optimisez Vos Décisions de Trading avec l'Indicateur "autoFibo" Découvrez l'Indicateur "autoFibo": "autoFibo" est l'outil d'analyse essentiel pour les traders souhaitant exploiter pleinement les niveaux de Fibonacci sans avoir à les tracer manuellement. Cet indicateur automatise le processus de retracement de Fibonacci, offrant un accès visuel instantané aux zones clés de support et de résistance. Caractéristiques Principales: Retracement Automatique de Fibonacci: Trace automatiquement les nivea
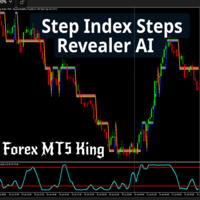
Unlock precision in your trading with the Step Index Steps Revealer AI . This advanced MT5 indicator is your ultimate tool for identifying key price levels on major forex pairs, including GBP/USD, EUR/USD, and others, as well as the step index
Key Features 1. Accurate Price Level Identification Plots precise key levels on major forex pairs like GBP/USD, EUR/USD, USD/JPY, and more. Ideal for traders looking to capitalize on bounce backs and breakouts with accuracy. 2. Optimized for Step Index C

Améliorez Votre Performance de Trading avec l'Indicateur "Better Volume" Découvrez l'Indicateur "Better Volume": Le "Better Volume" est l'outil essentiel d'analyse du volume du marché pour les traders souhaitant se démarquer. Il analyse les volumes de ticks avec une précision inégalée, grâce à sa fonction avancée de moyenne mobile (PERIOD_MA) et à des alertes d'achat et de vente personnalisables. Caractéristiques Principales: Analyse Avancée du Volume: Reconnaissez les pics de volume signalant d
O delta volume é uma ferramenta poderosa utilizada em várias estratégias de operação, especialmente no trading de futuros, ações e criptomoedas. Aqui estão algumas das principais estratégias onde o delta volume é frequentemente aplicado: Identificação de Tendências : O delta volume ajuda a identificar a direção da tendência predominante, mostrando se há mais pressão de compra ou venda. Isso pode ser útil para confirmar a força de uma tendência ou identificar possíveis reversões. Confirmação de B

Le SuperTrend est l'un des indicateurs techniques les plus efficaces et les plus utilisés dans le trading, idéal pour identifier la direction de la tendance et générer des signaux d'entrée et de sortie. Basé sur la volatilité et la tendance, cet indicateur s'adapte dynamiquement aux conditions du marché, offrant une référence visuelle claire pour les traders. Caractéristiques Principales : Détection de Tendance : Le SuperTrend suit la tendance du marché, dessinant une ligne qui se positionne au-
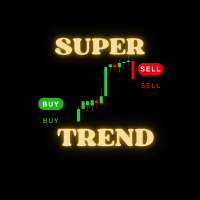
Welcome to Super Trend System. The system has a track record of 18 months with a consistence performance in a live account. It is designed with a great trend base determination algorithm that performs over 88% of forex pairs positively. The algorithm is also populated by multi-time frames to find an overall market trend direction. Kindly find the images for trades management. How to use the System? When the signal line turns red, that is Sell signal, wait until the new red line creates and edg

Nouvel Indicateur Combiné - 3 en 1 Vous cherchez des outils de trading qui peuvent améliorer votre analyse de marché et vos stratégies d'investissement ? Nous avons combiné trois de nos meilleurs indicateurs en une seule solution puissante et pratique, vous permettant de maximiser la valeur de votre trading. 1. Indicateur de Bloc d'Ordre (vendu précédemment à 32,90$) L'Indicateur de Bloc d'Ordre est un outil essentiel pour identifier les zones d'intérêt institutionnel fort sur le marché. Cet ind

O indicador media colors se baseia num canal que pode ser criado a partir de duas médias Media colors é um indicador de tendência utilizado no trading para identificar a direção predominante do mercado. Pode ser baseado na Média Móvel Simples (SMA) e na Média Móvel Exponencial (EMA) que dá mais peso aos preços mais recentes, tornando-a mais sensível às mudanças de preço. Como Funciona: Cálculo: A EMA é calculada aplicando um fator de suavização aos preços de fechamento de um ativo financeir

Indicateur financier SolarTrade Suite : Comet Market Indicator - Votre guide fiable dans le monde des marchés financiers !
Il s'agit d'un indicateur de période qui utilise des algorithmes spéciaux innovants et avancés pour calculer sa valeur, et qui présente également un design agréable et des fonctions supplémentaires.
Il est très facile de comprendre les lectures de cet indicateur : une ligne verticale verte est le début d'une nouvelle période. En tant que fonctions supplémentaires : - cl
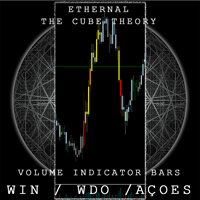
The Cube Bars Brasil pinta os candles de acordo com o volume , excelente para saber os picos de compra e venda . Pode ser regulado livremente pelo usario . Possui regulagem de parametro de entrada para que o usuario tenha a liberdade de regular o colume de acordo com o ativo que escolher . Possui 4 cores que diferenciam os candles de acordo com o tamanho do volume naquele instante
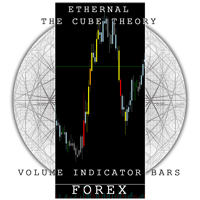
The Cube Bars Forex is an indicator for meta trader 5 created by me Tomas Lekim to color the candlesticks based on the volume peaks of the large investors in the forex market. It tracks the buy and sell peaks and paints the candles according to the amount of money invested by the other robots. It is a powerful tool against large robots because it identifies the moments when it must make decisions. It can be configured according to the currency pair you will use. It has 4 different colors so that

Indicateur "Fair Value Gap" (FVG) - Dévoilez le Pouvoir des Déséquilibres du Marché Le monde du trading regorge d'opportunités cachées, mais seuls ceux qui possèdent les bons outils peuvent les identifier et les exploiter efficacement. Notre Indicateur FVG est conçu pour vous aider à faire exactement cela. Si vous êtes un trader cherchant à améliorer sa capacité à lire le marché et à identifier les meilleurs points d'entrée et de sortie, l'Indicateur FVG est votre allié idéal. Qu'est-ce qu'un Fa
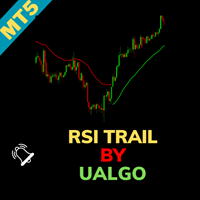
RSI Trail [UAlgo] Indicator for MetaTrader 5 The RSI Trail [UAlgo] indicator is a sophisticated technical analysis tool designed to enhance trading strategies by leveraging the Relative Strength Index (RSI) in conjunction with various moving average calculations. This indicator dynamically plots support and resistance levels based on RSI values, offering clear visual signals for potential bullish and bearish market conditions. Key Features:
Dynamic Support and Resistance Levels: The indicator
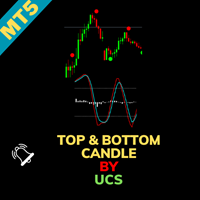
UCS_Top & Bottom Candle Indicator for MetaTrader 5 The UCS_Top & Bottom Candle is an innovative experimental indicator designed for MetaTrader 5. Based on momentum, this indicator identifies the top and bottom candles for most swing movements, assisting traders in making precise market entries and exits. Key Features: Momentum-Based Analysis: Utilizes momentum to detect the top and bottom candles for swing trading opportunities. Customizable Settings: Percent K: Set the Percent K value (default
Qu'est-ce que le "Schaff RSX" ? Le "Schaff RSX" combine l'efficacité de l'indice de force relative (RSX) avec la précision du cycle Schaff, créant ainsi un indicateur unique qui vous aidera à identifier facilement les meilleurs moments pour entrer et sortir du marché. C'est comme avoir un radar qui détecte les opportunités de trading cachées, vous offrant un avantage concurrentiel que les autres traders ne peuvent tout simplement pas se permettre d'ignorer. Pourquoi choisir le "Schaff RSX" ? Sim

Profil de marché HiperCube !
Un profil de marché est une représentation graphique qui combine les informations de prix et de temps sous la forme d'une distribution. Il affiche les informations de prix sur l'échelle verticale (axe des Y) et les informations de volume sur l'échelle horizontale (axe des X). Ce type de graphique fournit des informations sur l'activité du marché, permettant aux traders de visualiser et d'évaluer la juste valeur marchande en temps réel.
Fonctionnalités : Couleurs
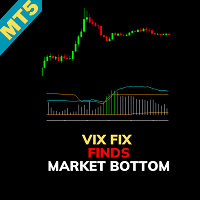
Indicator Name: CM_Williams_Vix_Fix Finds Market Bottoms Overview: The CM_Williams_Vix_Fix Finds Market Bottoms indicator is an advanced tool designed to identify market reversal points across various asset classes. Inspired by the original work of Larry Williams, this indicator provides similar insights to the VIX for stock indices but with the added flexibility of functioning effectively across all asset types. Key Features: Versatility Across Asset Classes: Unlike traditional indicators that

L'« Indice USD HiperCube (DXY /USDX) » est un indice de référence financier représentant la performance d'un groupe spécifique d'actifs, comme les actions, les obligations ou les matières premières, avec des valeurs libellées en dollars américains. Ces indices aident les investisseurs à suivre et à comparer la performance de secteurs ou de marchés particuliers au fil du temps. En étant exprimé en USD, l'indice fournit une mesure cohérente pour évaluer les investissements, quelle que soit la dev
Indicateur de Confirmation d'Entrée pour MT5 : Une Solution de Trading Précise pour les Indices de Volatilité L'Indicateur de Confirmation d'Entrée pour MetaTrader 5 (MT5) est un outil puissant et polyvalent, spécialement conçu pour les traders qui se concentrent sur le trading des indices de volatilité. Que vous souhaitiez tirer parti de la poursuite d'une tendance ou identifier des points d'inversion clés, cet indicateur fournit des signaux clairs et utiles qui peuvent améliorer votre stratégi
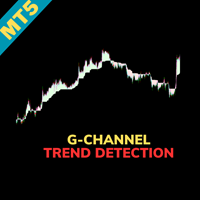
Indicator Name: G-Channel Trend Detection Overview: The G-Channel Trend Detection indicator offers a unique approach to trend analysis, leveraging AlexGrover's G-Channel methodology. This indicator provides a clear and simplified view of market trends by identifying bullish and bearish conditions based on price interactions with the G-Channel boundaries. Key Features: Trend-Based Market Analysis: The indicator determines trend direction by monitoring price action relative to the G-Channel bounda

CVD SmoothFlow Pro - Analyse de Volume Illimitée pour Tout Actif ! CVD SmoothFlow Pro est la solution ultime pour les traders recherchant une analyse de volume précise et illimitée. En utilisant le calcul du Cumulative Volume Delta (CVD) avec un filtrage avancé du bruit, la version Pro offre la flexibilité et la précision nécessaires pour trader tout actif financier. Que propose CVD SmoothFlow Pro ? Analyse Claire : Filtre le bruit du marché et met en avant les mouvements de volume signifi

Le Super Indicateur est une solution de trading complète adaptée aux traders débutants et expérimentés. Il combine plus de 5 indicateurs pour donner l'alerte Clarté du signal : offre des signaux fléchés pour des points d'entrée et de sortie clairs. Alertes en temps réel : tient les traders informés grâce aux alertes d'entrée et de sortie de transactions. Caractéristiques: Ne pas repeindre Activations maximales 7+ stratégies 5 indicateurs tout en un Points et flèches d'entrée et de sortie Alertes

DYJ SmoothedMA Strategy is a very simple but powerful system to get forex and s ynthetic market trend direction. This indicator is actually a moving average indicator containing 10 smoothing algorithms in a file . The indicator can help you to see the whole trend break out/rebound signal. And these BUY and SELL signals are sent out. You can use DYJ GameDevice follow-up software to receive these signals and realize automatic opening and closing of positions. And can use the game strategy fu

The Spike Forecaster SFD is a system that was developed to catch spikes, it simple to use, its just plug and play.
It will give both Buy Alerts and Sell Alerts through arrows white and red respectively.
The system was designed to make it easier for those traders who might be busy to analyse the market hence it will just give you simple alerts to know the direction of the market. Regards
Spike Forecaster

This is a early support and resistance indicator. It will allow you to choose how many candles back. You can use it on all timeframes. Change the color as you like. You can use it with other indicators for better entry prediction it will give you trend for bear market and bull market. It will help you predict sideways market trending market and falling market. Save trading
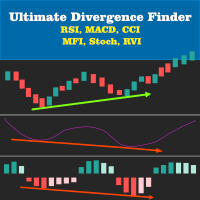
Multi Indicator Divergence Finder Enhance your trading strategy with the Multi Indicator Divergence Finder! This versatile tool is engineered to help traders quickly and accurately identify both regular and hidden divergences across multiple popular indicators simultaneously, including RSI, MACD, CCI, Stochastic, MFI, and RVI. Experience real-time divergence detection with signals plotted directly on your charts. Key Features: Simultaneous Multi-Indicator Divergence Detection : Detect regular an

Contact us to receive a comprehensive user guide after purchasing. Enhance your trading experience with the Hydra Trend Rider Indicator, meticulously designed by MQL5 silver award winning developer to provide you with unparalleled market insights and empower your decision-making process. This advanced tool is perfect for traders seeking precision and efficiency in their trading strategies. Join our MQL5 Channel Indicator Features: Multiple Timeframe Dashboard: Gain a comprehensive view of the
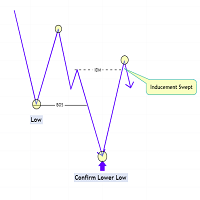
The Market Structure with Inducements & Sweeps indicator is a unique take on Smart Money Concepts related market structure labels that aims to give traders a more precise interpretation considering various factors.
Compared to traditional market structure scripts that include Change of Character (CHoCH) & Break of Structures (BOS) -- this script also includes the detection of Inducements (IDM) & Sweeps which are major components of determining other structures labeled on the chart.
SMC &

Previous Candle Levels MT5 affiche les niveaux de bougies précédents, il affiche les niveaux d'ouverture (Open), du prix le plus haut (High), du prix le plus bas (Low) et du prix de clôture (Close) de la bougie précédente sur différentes périodes. Ces niveaux sont souvent appelés OHLC. Il est conçu pour aider le trader à analyser le marché et à faire attention aux niveaux OHLC de la bougie précédente sur différentes unités de temps. Nous savons tous que les niveaux OHLC mensuels (MN), hebdoma
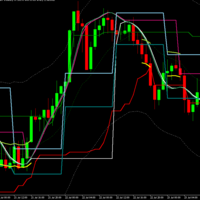
Mega Analyzer MT5 Indicator: A Comprehensive Trading Solution In the dynamic world of trading, having an edge can make all the difference. The "Mega Analyzer MT5 Indicator" offers traders that edge, providing a powerful tool that deciphers market movements with precision and clarity. Designed for both novice and experienced traders, this indicator is tailored to enhance decision-making and optimize trading strategies by revealing key price levels and market conditions that often go unnoticed by

VolumeSecret : Le Pouvoir du Volume entre Vos Mains Dans le monde complexe de la programmation, nous faisons constamment face à des obstacles qui nous poussent à grandir et à évoluer. Nous comprenons profondément les difficultés que le marché impose et comment les traders luttent pour atteindre une performance optimale. C’est pourquoi nous travaillons sans relâche sur des solutions innovantes pour rendre la prise de décision sur le marché plus fluide et précise. VolumeSecret est le fruit de cet
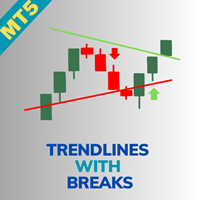
Indicator Name: Trendlines with Breaks [LuxAlgo] Overview: The Trendlines with Breaks [LuxAlgo] indicator provides traders with pivot point-based trendlines that highlight real-time breakouts. This tool is highly customizable, allowing users to adjust the steepness of trendlines, choose different slope calculation methods, and receive alerts on trendline breakouts. Key Features: Pivot Point-Based Trendlines: The indicator automatically generates trendlines based on pivot points, providing a clea

Buy Sell Storm
Professional indicator for trading on financial markets, designed for MT5 platform .
Trading on the indicator is very simple, Blue arrow to buy , Red arrow to sell.
Attention, discount on all products until October 7th.
The indicator does not redraw and does not change its values.
After purchase write to me and I will send you a Bonus in the form of an EA Buy Sell EA on this indicator.
( see the video of the EA on the indicator, the set file is attached).
In

Présentation L'indicateur Multi Level ATR et Moving Average Band fournit une analyse complète des mouvements de prix en tenant compte de la volatilité. La représentation visuelle à travers plusieurs bandes facilite l'identification des phases de tendance et de consolidation ainsi que des points de retournement potentiels. Grâce aux options de personnalisation, les utilisateurs peuvent adapter l'indicateur à leurs besoins de trading spécifiques. Fonctionnalités Affichage de plusieurs bandes : Niv
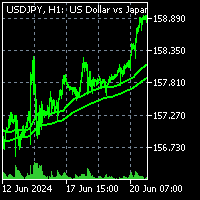
To get access to MT4 version please click here . This is the exact conversion from TradingView: "Liquidity Weighted Moving Averages" by "AlgoAlpha ". This is a light-load processing and non-repaint indicator. All input options are available expect time frame input . Buffers are available for processing in EAs. You can message in private chat for further information/changes you need. Thanks for downloading

Indicateur TK - Rainbow Description : L’indicateur TK - Rainbow est un outil puissant d’analyse technique conçu pour offrir une vue claire des tendances du marché grâce à une approche multi-lignes. Avec 30 lignes calculées sur différentes périodes, il offre une analyse approfondie des mouvements de prix. L’indicateur utilise un schéma de deux couleurs pour mettre en évidence les tendances haussières et baissières, facilitant ainsi l’interprétation des conditions du marché en un coup d'œil. Princ
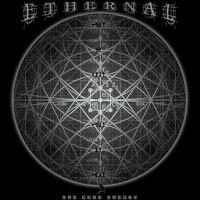
Welcome to Tomas Lekim's Cube theory. The Theory is based on the calculation of the largest pattern existing in nature. A pattern that contains all other patterns and sequences. All patterns such as prime numbers, Fibonacci and other number sequences are contained in the universal mesh of my theory. It is possible to perceive the price pattern and the meeting between the two opposing forces that exist in the entire logic of negotiation and competition. .Games in which a team competes with anothe
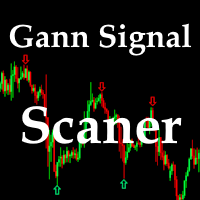
This indicator is based on the Gann Signal indicator and acts as a market scanner. All you need to do is fill in the selected currency pairs in the settings and that’s it. Next, the indicator itself will view all these currency pairs and time frames from M5 to D1 simultaneously. When a new signal appears, the indicator will give you an Alert and also draw the letter N where this new signal will be.

Ekom Spike Detector Pro
Take your trading to the next level with the Ekom Boom and Crash Spike Detector Indicator Pro, designed for serious traders who demand more. This advanced version provides: Key Features: - Accurate Spike Detection: Identify high-probability spike patterns in real-time using price action - Clear Visual Signals: Displays clear buy and sell arrows on the chart for easy decision-making - Customizable: easily change arrows and line colors and also select wether Boom or

1. What is this Due to the limitation of MT5 software, we can only see the minimum 1-minute candlestick chart. Sometimes this is not enough for high-frequency traders, or we want to see a more detailed candlestick chart. This tool allows you to see: A candlestick chart composed of N seconds, which allows you to better understand the price fluctuations. For example, each candle line has 20 seconds, or 30 seconds.
2. Parameters: SecondCandle = 20; // The second cnt for one candle, Need
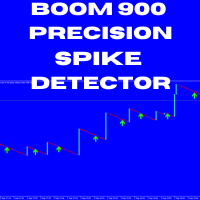
Boom 900 Precision Spike Detector The Boom 900 Precision Spike Detector is a powerful tool designed to help traders accurately identify spike opportunities in the Boom 900 market. With advanced features and precise alerts, this indicator takes the guesswork out of trading, enabling you to maximize your profits with confidence. Key Features: Non-Repainting Signals: Get reliable signals without repainting, ensuring your trading decisions are based on accurate, real-time data. Audible Alerts: Stay
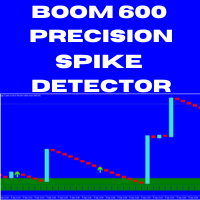
Boom 600 Precision Spike Detector The Boom 600 Precision Spike Detector is your ultimate tool for trading the Boom 600 market with precision and confidence. Equipped with advanced features, this indicator helps you identify potential buy opportunities and reversals, making it an essential tool for traders aiming to capture spikes with minimal effort. Key Features: Non-Repainting Signals: Accurate, non-repainting signals that you can trust for reliable trading decisions. Audible Alerts: Stay on t
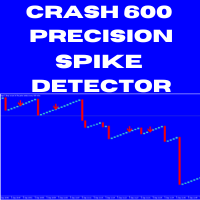
Crash 600 Precision Spike Detector The Crash 600 Precision Spike Detector is an essential tool designed to help traders navigate the Crash 600 market with accuracy and efficiency. Packed with advanced features, this indicator provides precise alerts that allow traders to capture spikes and reversals with confidence. Key Features: Non-Repainting Signals: Dependable, non-repainting signals that ensure your trading decisions are based on real-time, accurate data. Audible Alerts: Receive sound notif

In the context of trading, Malaysia SNR (Support and Resistance) refers to the technical analysis of support and resistance levels in financial markets, particularly for stocks, indices, or other assets traded. This is single timeframe version. Multiple timeframe version is avaiable here . There are three type of Malaysia SNR level Classic , GAP and Flipped 1. Classic Support is the price level at which an asset tends to stop falling and may start to rebound. It acts as a "floor" where demand is
Découvrez comment acheter un robot de trading sur le MetaTrader Market, le magasin d'applications de la plateforme MetaTrader.
e système de paiement de MQL5.community prend en charge les transactions via PayPal, les cartes bancaires et les systèmes de paiement populaires. Nous vous recommandons vivement de tester le robot de trading avant de l'acheter, pour une meilleure expérience client.
Vous manquez des opportunités de trading :
- Applications de trading gratuites
- Plus de 8 000 signaux à copier
- Actualités économiques pour explorer les marchés financiers
Inscription
Se connecter
Si vous n'avez pas de compte, veuillez vous inscrire
Autorisez l'utilisation de cookies pour vous connecter au site Web MQL5.com.
Veuillez activer les paramètres nécessaires dans votre navigateur, sinon vous ne pourrez pas vous connecter.