YouTube'dan Mağaza ile ilgili eğitici videoları izleyin
Bir alım-satım robotu veya gösterge nasıl satın alınır?
Uzman Danışmanınızı
sanal sunucuda çalıştırın
sanal sunucuda çalıştırın
Satın almadan önce göstergeyi/alım-satım robotunu test edin
Mağazada kazanç sağlamak ister misiniz?
Satış için bir ürün nasıl sunulur?
MetaTrader 5 için teknik göstergeler - 83

Tatino Super Signals is Non Repaint Indicator for Binary Option trading and Forex trading. Recommendations:
Timeframe: All timeframes. For best results we recommend using it on M1, M5 and M15 timeframes. Currency pairs: All Pairs Account type: All Type Broker time: Any Brokers : Alls Binary Trading : Expired 1 Candle Buffer Buy=1, Sell=0, Entry Next Candle Recommended Forex trading stop loss : 15 pips Recommended Forex tradingTake profit levels : 15 pips
Specifications:
Does not repaint Pa

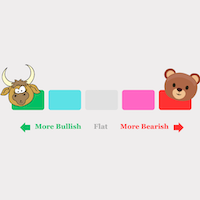
RFX5 Bull Bear Powers indicator shows the absolute power of bulls and bears controlling the market. Both powers are shown simultaneously with red and green colors for bear and bull powers respectively. When red line goes over the green line it means that bears are controlling the market. When green line goes over the red line it means that bulls are controlling the market. The green/red horizontal symbol line at the bottom of the indicators shows which party has more strength. Time Frame: M3
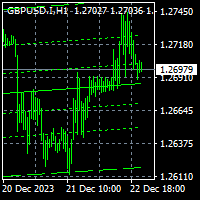
To get access to MT4 version click here . This is the exact conversion from TradingView: "Linear Regression Channel" by "LonesomeTheBlue". This is a repaint indicator. Buffers are not available for processing. You need to parse objects on chart. All input fields are available. You can message in private chat for further changes you need. Thanks for downloading

The underlying strategy of this indicator is based on identifying momentum in the market and attempting to capture the direction of the trend through transitions between bullish and bearish moments. Utilizing bands around the RWMA allows for identifying potential overbought and oversold situations in the market.
1. Calculation of the Range Momentum Index (RMI): The RMI is based on a combination of the Relative Strength Index (RSI) and the Money Flow Index (MFI), both of which are momentum indi

The PUA MultiType Pivot indicator is built on the daily chart of the previous day. The PUA MultiType Pivot indicator is one of the most popular tools in technical analysis, used by traders to identify potential reversal points in financial markets. This indicator constructs three types of Pivot points: Classic, Fibonacci, and Camarilla, each offering its unique approach to market analysis. The advantages of this indicator include: Simplicity and Clarity PUA MultiType Pivot provides clearly defi
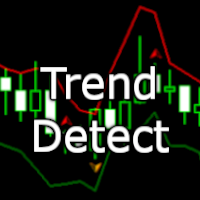
Trend change detector is an indicator for Metatrader 5.It can help you determine the change in a local trend to open a correct position. It has 2 parameters. Period and mistake offset percent. You can change the period parameter to capture little changes in trend. There are two lines: the red one and the green one. You can use them as a local support and resistance level. Arrows show the change in a trend. Up arrow the price will go down and Down arrow the price will go up. Also, by changing m

Created by imjesstwoone and mickey1984, this trade model attempts to capture the expansion from the 10:00-14:00 EST 4h candle using just 3 simple steps. All of the information presented in this description has been outlined by its creators, all I did was translate it to MQL5. All core settings of the trade model may be edited so that users can test several variations, however this description will cover its default, intended behavior using NQ 5m as an example. Step 1 is to identify our Price Ra

Liquidity Pro The Liquidity Pro highlights liquidity and supply & demand zones in any financial instrument, including currency pairs, cryptocurrencies, commodities and indices. The Liquidity Pro highlights "Supply & Demand" zones, down to the present minute, providing optimal trade entries and exits, when conducting chart analysis or initiating trades. The Liquidity Pro algorithm automatically detects your trading pair, enabling you to instantly view liquidity, supply, and demand zon es. The i

Overview:
The Custom_Timeframe_MAs indicator for MetaTrader 5 lets you study different timeframes using M1 candles. It offers 12 moving average methods for analyzing trends. Why It's Useful: Versatile Timeframes: Even though MetaTrader has fewer timeframes, this indicator expands options by using M1 candles. Various Moving Averages: Choose from 12 moving average types: SMA, EMA, DEMA,TEMA,WMA, VWMA,SMMA, HullMA, LSMA, ALMA, SSMA, TMA, to understand price movements better. For Automated Trading

El indicador Global Average es una media móvil que difiere significativamente de las medias móviles tradicionales. Su función principal es proporcionar un precio objetivo de take profit que sirve como referencia para la estrategia de regresión a la media. Este manual detallará la estrategia de Venta/Compra basada en este indicador, que implica medir el primer impulso del precio despues de romper la media del indicador, luego avanzar con el nivel de Global Average , y vender/comprar cuando el pre

The BS Vwap 5 Bands indicator is an advanced tool that integrates price and volume data, providing a comprehensive view of market dynamics. Designed with a focus on performance and tested under real trading conditions, this indicator aims to deliver valuable insights to traders. Its innovative approach combines VWAP with five distinct bands, revealing whether the price is aligned with the "fair price" and indicating overbought or oversold conditions. Additionally, the indicator offers visual cus
The Donchian Channel Indicator helps to identyfy the market trend and the breakouts of the channel. Breaking above means the momentum of the market is highly bullish. Breaking below means the momentum of the market is highly bearish.
SETTINGS: PERIOD - default value 20. The number of last candles beeing taken into account when generating the line. OFFSET - default value 0. The percentage number that makes the channel bigger or smaller. LINE_COLOR - default color is set Blue. Here you can set wh
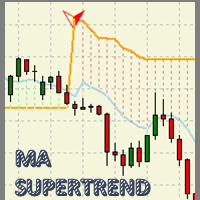
MA Super Trend MT5 An indicator based on the average maximum and minimum of a candle period, and next to the average true range (ATR) result in a powerful visual work tool to optimize the trend zones and potential areas of market entry. With great adaptability in any type of financial asset and with a potential for visual simplification in the graph, which will make the graph a simple work table. An indicator created to measure: - For MT5 desktop platform. - Great for Day trading, Swing Trading

Elevate Your Trading Experience with the famous UT Bot Alert Indicator!
Summary: The UT Bot Alert Indicator by Quant Nomad has a proven track record and is your gateway to a more profitable trading journey. It's a meticulously crafted tool designed to provide precision, real-time insights, and a user-friendly experience.
Key Features: 1. Precision Analysis: Powered by advanced algorithms for accurate trend identification, pinpointing critical support and resistance levels. 2. Real-time Alert
Introducing the Pivot Point SuperTrend MT5 version of the Trading View indicator by LonesomeTheBlue.
A revolutionary script designed to optimize your trading strategies by combining the power of Pivot Points with the precision of SuperTrend indicators. This unique algorithm offers an enhanced approach to identifying and staying within trends, delivering unparalleled performance in today's dynamic markets.
Key Features: Enhanced Trend Identification: By integrating Pivot Points and calculating

The new update makes this indicator a complete tool for studying, analyzing and operating probabilistic patterns. It includes: On-chart Multi-asset percentage monitor. Configurable martingales. Twenty-one pre-configured patterns, including Mhi patterns and C3. An advanced pattern editor to store up to 5 custom patterns. Backtest mode to test results with loss reports. Trend filter. Hit operational filter. Martingale Cycles option. Various types of strategies and alerts. Confluence between patter

Aşağıdan yukarıya tüm karelerde trend grafikleri sunarak işlem yapmanızı kolaylaştırır. Yükseliş trendine dokunursa satış için iyi bir fırsattır ve hedef düşüş trendidir veya tam tersi. Düşüş trendine dokunursa iyi bir satın alma fırsatıdır ve hedef yükseliş trendidir. Trendi otomatik olarak yeniden çizebilir. Daha yüksek kareleri izleyebilir ve spekülasyon için daha düşük karelerle işlem yapabilirsiniz.

TREND HARMONY MT5 – Multi Timeframe Trend and Phase and Pullback Level Visualizer indicator for Metatrader5 The TREND HARMONY indicator automates deep trend analysis and generates visualizations for you. Take control of your trades by eliminating uncertainty! Revolutionize your trading experience with precision and insight through the TREND HARMONY Multi Timeframe indicator – your ultimate MT5 trend visualization indicator. [ Features and Manual | MT4 version | All Products ]
Are you tir

MasterOBV: Pazar Trendlerini Hassasiyetle Yönetin! MasterOBV , hacim , pozitif korelasyon ve Hareketli Ortalama (MA) kombinasyonunu kullanarak finansal piyasalarda trendleri tanımlama yeteneğini artıran bir teknik analiz göstergesi dir. Ana Özellikler: Akıllı Hacim: Ticaret hacmini analiz ederek trend gücündeki önemli değişimleri belirler. Pozitif Korelasyon: Korele olmuş varlıkları dahil ederek daha geniş ve doğru bir bakış açısı sağlar, çiftlerin hacmine dayalı olarak fiyat kayması

To get access to MT4 version click here . This is the exact conversion from TradingView: "Trendlines with Breaks" by LuxAlgo
This is a REPAINT indicator. Buffers are available for processing. However there are objects on chart to process also. All input fields are available. Alerts are generated based on bars closure. You can message in private chat for further changes you need. Thanks for downloading
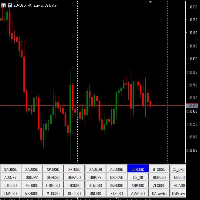
"Symbol Changer" is an indicator created for the Metatrader 5 (MT5) platform, providing the ability to change symbols. To perform all operations with this indicator, use the following characteristics:
Characteristics: Installation: To install the indicator on the MT5 platform, place your .mq5 code in the Indicators folder and restart MT5. Visualization: On the chart, the "Symbol Changer" indicator places special buttons to change symbols. Initial Settings: There are no additional settings for t

The GGP Trendlines with Breaks Alert MT5 Indicator is a technical analysis tool that can assist investors in identifying market trends. The indicator returns pivot point based trendlines with highlighted breakouts. Users can control the steepness of the trendlines as well as their slope calculation method. This indicator is MT5 conversion of the Trendlines with Breaks Indicator by “ LuxAlgo “ in Trading View website and some alert methods are added to provide real-time alerts when a trading sign

The GGP Chandelier Exit Alert MT5 Indicator is a volatility-based indicator that identifies stop loss exit points for long and short trading positions. Chandelier Exit is based on the Average True Range (ATR) indicator. It is designed to keep traders in the trend until a defined trend reversal happens. Traders use CE to maximize their returns in a trade and make stop loss exit decisions. It is based on the principle that a trend reversal is highly probable when the price of an asset moves agains

GIVE A LOOK TO MY OTHER PRODUCTS ! 100 % PER MONTH PROFIT---- MY NEW SIGNAL HERE -------> https://www.mql5.com/en/signals/2162238?source=Site+Signals+My# Smoothed MA cross alert,is a cool indicator that notificate you directly on your telephone or email when 2 Smoothed Moving average ( you choose the parameters ) crosses. This is very important when you want to know a change of trend and you can't stay in front of your pc! The indicator give you the alert just when the next bar opens ,so give

Introducing our groundbreaking indicator designed to elevate your trading strategy! Unlock the power of precise volume analysis with Buy, Sell, and Neutral indicators. Tailor your approach with customizable levels based on timeframes and moving average methods.
Key Features: Dynamic Volume Insights Instantly identify Buy, Sell, and Neutral volumes for informed trading decisions. Gain clarity on market sentiment like never before. Adaptable Level Configuration Customize and adapt levels to match

Introducing our cutting-edge product, an innovative MACD Oscillator with a dynamic level enhanced by a decimal point Moving Average (MA) also with the versatility of multiple moving average modes. This advanced trading tool brings precision and flexibility to your technical analysis, offering a seamless experience for traders seeking a competitive edge in the financial markets.
Key Features: Dynamic Level Precision Our MACD Oscillator is equipped with a dynamic level feature, providing traders

Chart Clarity Dashboard
The Chart Clarity Dashboard provides clear insights into price movements for various financial instruments like currency pairs, cryptocurrencies, equities, commodities, and indices. This dashboard displays detailed price information in real-time, making it easier for traders to make decisions quickly. It shows price movements down to the second, giving you essential data before you trade or analyze charts. Chart Clarity Dashboard allows you to monitor price changes acro

Volume Clarity Pro The Volume Clarity Pro provides clarity in the movement of price for any financial instrument, including currency pairs, cryptocurrencies, equities, commodities and indices. The Volume Clarity Pro maps out where price is consolidating, retracing, resisting or settled in areas of support. The Volume Clarity Pro accurately displays the month's price action, offering crucial data about your selected trading pair for chart analysis and trade initiation. The Volume Clarity Pro is

Introducing our revolutionary intra-day trading indicator, meticulously crafted to optimize your trading insights within the 24-hour market cycle. Immerse yourself in historical data with precision using two distinctive modes - "All History" and "Last X Hours."
Key Features: All History Mode Uncover a comprehensive view of the day's dynamics. Instantly analyze the preceding day's high and low, 50% mid-point, and the open versus close price for the current day. Decode critical patterns to inform

Gobbo è un indicatore professionale che evidenzia il trend del mercato con un aspetto grafico chiaro e comprensibile, è basato sulla Moving Average e può essere impostato su qualsiasi periodo di intervallo, di default impostato sul periodo 14, scegliendo un periodo più alto evidenzierà meno cambi di tendenza per un approccio sul medio o lungo periodo, con un periodo più basso più cambi di tendenza per un approccio sul breve termine L'aggiornamento e l'adattamento al time frame scelto avviene in

Crash Spike Master, Crash piyasalarında işlem yapmak için gelecektir. 1 dakikalık zaman diliminde Crash 300, 500 ve 1000 piyasalarında çalışacak şekilde tasarlanmıştır. 2 farklı ticaret modu bulunmaktadır (Agresif ve Normal). Agresif mod, sarı ve mavi okları çizecektir. Doğru seçimi yapmanıza yardımcı olacak iki farklı koşul. İlk işlemi sarı ok üzerine girin ve ikinci işlemi mavi mum üzerine girin. Bu modda stop-loss, mavi oktan 10 mum uzakta olacaktır. Normal mod, yalnızca grafikte kırmızı okla

"QuantumEdge FairValueGap Pro" - The Ultimate Trading Edge!
Elevate your trading experience with the QuantumEdge FairValueGap Pro, your all-in-one solution for unparalleled market insights and precision trading. This cutting-edge indicator brings quantum-level analysis to your fingertips, empowering you with advanced tools to navigate the financial markets.
Key Features:
1️⃣ FairValue Precision: Gain a quantum-edge perspective on market fairness, with a focus on pinpointing the most lucr
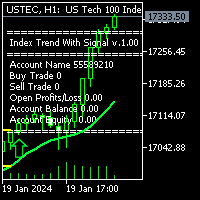
Description: Index Trend with Signal: is the Best working on DE40, USTEC, US30, US500 index on H-1 time chart with default settings. You don't need to change any settings. Easy to install and ready to start working. First of all this Index Trend with Signal Indicator is Non-Repainting, Non-Redrawing Indicator, which is best tool for Index Traders. For limited time only 50% OFF, Now 51$ only. 10 purchases left & the price increases to 30$ and final price will be 300$
Contact me right after th

BreakHarmony Multi-Timeframe Breakout Indicator for MT5
The BreakHarmony Multi-Timeframe Breakout Indicator for MT5 is a highly advanced tool providing information on breakout points across different timeframes, aiding traders in decision-making and understanding market movements. [ Features and Manual | MT4 version | All Products ] The indicator tracks breakout points on price charts across 6 timeframes. Breakout prices are indicated with the closing price of the correspondi

Altın Desen, Fibonacci dizisindeki altın orana dayalı 3 mumlu bir konfigürasyondur.
Altın oran 1,618'dir. Varyasyonları 0,618, 2,618 ve 3,618'dir. Bu göstergede sonuçlar 2,618 ile en iyi sonuçtur.
Altın formasyonu normal bir mum ve ardından ilk mumun en az 2,618 katı büyüklüğünde kapanış fiyatına sahip daha büyük bir mumdan oluşur.
Altın Boğa Deseni yükseliş mumlarından, Altın Ayı Deseni ise düşüş mumlarından oluşur.
Sinyale ek olarak, son 2 mumun üzerine yayılan, mavi bir çizgi olarak

Vision è un indicatore professionale che legge i dati storici del periodo impostato e in base a tali elabora una previsione scrivendo l'andamento sul grafico, l'impatto visivo eccellente rende chiaro l'andamento del prossimo trend e mette a fuoco il prezzo d'ingresso il posizionamento di ordini e la distanza per SL e TP, di default è impostato con un rapporto bilanciato 24 a 24 ciò significa che in base alle ultime 24 candele prevederà scrivendo sul grafico l'andamento delle 24 candele successi

Jurik Gelişmiş MA (JurMA), Mark Jurik tarafından tasarlanan orijinal JMA üzerinde geliştirilmiş, yeniden boyanmayan bir teknik göstergedir.
Geleneksel hareketli ortalamalarda mevcut olan gecikmeyi azaltmak, pürüzsüzlüğü iyileştirmek ve gürültüyü azaltmak için tasarlanmıştır. JurMA piyasa oynaklığına uyum sağlar ve kullanıcı tarafından hassasiyet için ince ayar yapılabilir, bu da onu finansal piyasalardaki eğilimleri ve tersine dönüşleri belirlemek için yararlı hale getirir. Bu uyarlanabilirli

TrendOnClose, İkili piyasa yatırımcıları için tasarlanmış, belirli mum döngüleri içindeki trendlerin ve karşı trendlerin istatistiksel analizine odaklanan sofistike bir göstergedir.
Her döngü, bir sonraki döngünün başlangıcına kadar sonraki istatistiksel analiz için trend yönünü (YUKARI / AŞAĞI - BOĞA / AYI) belirleyen mum KAPANIŞ fiyatı ile tanımlanır. İstatistiksel analiz iki konfigürasyonla çalışır:
⦁ SONRAKİ MUM OLARAK İSTATİSTİKSEL HEDEF: Algoritma, döngü içindeki sonraki muma odaklanır.

Простой индикатор тренда в NRTR виде с отрисовкой линий стоплосса и тейпрофита, цвет и направление движения которых определяются действующим трендом. Индикатор имеет возможность подавать алерты, отправлять почтовые сообщения и push-сигналы при смене направления тренда. Следует учесть что значение входного параметра индикатора Deviation of the take profit line in points для каждого финансового актива на каждом таймфрейме необходимо подбирать индивидуально!

HAshi-E is an enhanced way to analyze Heiken-Ashi signals.
Briefing:
Heiken-Ashi is particularly valued for its ability to filter out short-term volatility, making it a preferred tool for identifying and following trends, helps in decision-making regarding entry and exit points, and assists in distinguishing between false signals and genuine trend reversals. Unlike traditional candlestick charts, Heiken-Ashi candles are calculated using average values of previous bars, creating a smoother, mo

An indicator to show the current U.S. Dollar Index ( USDX , DXY , DX ). It is a weighted geometric mean of the dollar's value relative to the following select currencies: Euro (EUR), 57.6% weight. Japanese yen (JPY) 13.6% weight. Pound sterling (GBP), 11.9% weight. Canadian dollar (CAD), 9.1% weight. Swedish krona (SEK), 4.2% weight. Swiss franc (CHF) 3.6% weight.
You can request me to customize a similar indicator with weighted and currency pairs you desire. Just call me on MQL5, thanks

Functional in the Forex market. Functional on the B3 market - Bolsa Brasil Balcão. Motivation The Price Guide indicator is a tool that helps you insert support and resistance points at the chosen price and in the quantity you want, it depends on the agility of its configuration. This FULL version will work in Meta Trader 5 on all accounts and Strategy Tester . To test on the DEMO account , download the free version at: https://www.mql5.com/pt/market/product/111620 Operation The method

" Base Market Signals " A powerful and innovative technical analysis indicator designed to revolutionize your trading experience. Engineered by Southern Star Trading, this indicator is your key to unlocking profitable market insights in the ever-changing world of financial markets.
Key Features:
1. Dynamic Signal Detection: Base Market Signals employs sophisticated algorithms to dynamically identify potential trend reversal points, providing you with timely and accurate signals.
2. Versatile
Introducing the Engulfing Goddess Metatrader 5 (MT5) Indicator , a revolutionary tool designed for traders who seek to harness the power of candlestick patterns in their trading strategy. This indicator is built on the principles of engulfing candlestick patterns , a popular method used by successful traders worldwide. Our Engulfing Goddess Indicator stands out with its ability to detect various kinds of engulfing patterns . It employs a range of filters, providing you with a comprehensive anal

Designed by Welles Wilder for daily commodity charts, the ADXW is now used in various markets by technical traders to assess the strength of a trend or even a trend for short- or long-term trades.
The ADXW uses a positive (DI+) and negative (DI-) directional indicator in addition to its trend line (ADX).
According to Wilder, a trend has strength when the ADX signal is above 25; the trend is weak (or the price has no trend) when the ADX is below 20. The absence of a trend does not mean that th

On-Balance Volume (OBV) is a technical indicator that relates volume and price to identify price movements. The basic idea behind OBV is that changes in volume generally precede price changes. The indicator accumulates volumes for periods when the price closes higher and subtracts volumes for periods when the price closes lower. This results in a value used to identify the direction of the asset's trend.
The interpretation of the OBV is simple: a rising OBV suggests that buyers are willing to

In the realm of technical analysis, ParbMA emerges as a highly intuitive tool for examining the Parabolic SAR trend . This innovative approach leverages a customizable line, distinguished by its versatility in color, shape, and width options. Such flexibility enhances visual analysis and significantly aids in strategizing and decision-making.
The ParbMA (Parabolic Moving Average) is a custom technical indicator that combines the concepts of J. Welles Wilder's Parabolic SAR (Stop and Reverse) a

Uncover high-probability opportunities in trending markets with the Brilliant Entries Indicator. Its clear visual signals can be followed and incorporated with market structure to provide you with accurate entries. Give it a try and gain an edge in your trading strategy.
It can be used on it's own but i highly recommend to used it as part of a wider strategy to provide you with confluence.
It works on all timeframes but will work very good doing market structure 2 x timeframes higher and then

Introducing the True Currency Strength Indicator - Your Ultimate Guide to Market Mastery! Are you tired of guesswork when it comes to trading? Ready to elevate your trading strategy to a whole new level? Look no further! We present to you the True Currency Strength Indicator - the game-changer in the world of Forex trading. Unleash the Power of Multi-Currency Analysis: Gain a competitive edge with our revolutionary indicator that goes beyond traditional single-currency analysis. The Tru
By using (MOMENTUM and VELOCITY and ACCELLERATION) and the power of machine learning we can accurately calculate the current strength of the currencies of each time frame. - It's really easy to use: Choosing to trade between currency pairs that have clear and dominant trends will give you a great advantage. -The currency pair strength meter is rated from -100 to + 100

Subscribe to the 'MA7 Trading' channel to receive notifications about new programs, updates and other information. Ask questions in the profile on the MQL5 .
Description of work
The 'MA7 Agave' indicator is based on the standard Average Directional Movement Index (ADX) indicator. Shows the intersection of the +DI and -DI lines. Detailed information about the 'MA7 Agave' indicator.
Indicator settings
General settings: ADX period - Average Directional Movement Index indicator period.
'MA7 Flax

This indicator helps you identify support and resistance levels. Also it adds break points when level is broken. Price sometimes goes back to break point. It has 4 technical parameters and 4 buffers for expert advisors. Buffer indexes: 0 - Resistance, 1 - Support, 2 - Resistance break point, 3 - Support break point". Number of Levels: Determines how many levels are on graph ( if 3 - 3 levels of support and 3 levels of resistance) Tolerance in percentage %: This parameter is used to filter out

Currency Strength Dynamic Döviz Gücü Dinamik, para birimi gücünün bir göstergesidir. Döviz gücü, bir para biriminin parçası olduğu döviz çiftlerinin çoğunun veya tamamının trend yönünü ifade eder.
Gösterge, MACD göstergesine benzer şekilde, en popüler 28 döviz çifti (majör ve minör) üzerindeki hareketli ortalamalar arasındaki farkın okunmasına dayanmaktadır.
Avantajları Benzersiz salınımlı hesaplama yöntemi Belirli para birimlerinin satırlarını devre dışı bırakmak veya etkinleştirmek için düğ

Accurate Gold göstergesi, deneyim seviyesinden bağımsız olarak kullanıcı dostu bir araçtır ve kullanımı oldukça sezgiseldir. Altın piyasasındaki M5 zaman diliminde kesin sinyaller arayan tüccarlar için tasarlanmıştır. Bu gösterge, fiyat hareketlerini ve hacim dinamiklerini analiz etmek için gelişmiş matematiksel algoritmaları kullanarak kesin alım ve satım sinyalleri üretir. Bu göstergenin, repainting özelliği de dahil olmak üzere karakteristik özellikleri, tüccarlara potansiyel piyasa dönüşle

Compared to simple or exponential moving averages, slow adaptive trend lines might offer a more nuanced view of the trend by adjusting their sensitivity based on market conditions. However, their slow nature might also mean they are late in signaling reversals when market conditions change rapidly - and that is the difference between them and our SlowAMA .
SlowAMA was designed to be a better long-term trend indicator than EMA and other Moving Averages. It uses our JurMA calculations, reducing

HAshi-E, Heiken-Ashi sinyallerini analiz etmenin gelişmiş bir yoludur.
Brifing:
Heiken-Ashi özellikle kısa vadeli dalgalanmaları filtreleme kabiliyeti nedeniyle değerlidir, bu da onu trendleri belirlemek ve takip etmek için tercih edilen bir araç haline getirir, giriş ve çıkış noktalarına ilişkin karar vermeye yardımcı olur ve yanlış sinyaller ile gerçek trend dönüşlerini ayırt etmeye yardımcı olur. Geleneksel mum grafiklerinin aksine, Heiken-Ashi mumları önceki çubukların ortalama değerleri

Süpürme Deseni Bu son teknoloji araç, hem düşüş eğilimi rotasyonunu hem de yükseliş trendi rotasyonunu benzersiz bir doğrulukla tanımlamak için tasarlanmıştır,
bilinçli ticaret kararları vermenizi ve piyasada bir adım önde kalmanızı sağlar. MT4 Sürümü: WH Sweep Pattern MT4 Süpürme Deseni Özellikleri:
Farklı renkler ve stiller kullanarak, grafiğinizdeki düşüş ve yükseliş eğilimi rotasyonunu otomatik olarak algılar ve çizer. Size bir uyarı (ses, e-posta, anlık bildirim) gönderir ve grafiğ

Algo Map Lite ile tanışın - ticaret deneyiminizde devrim yaratmak için tasarlanmış son teknoloji bir yazılım. Bu gelişmiş araç, işlem seanslarınızla kusursuz bir şekilde bütünleşerek her durumda kapsamlı bir kırılma seviyesi analizi sağlar.
Sezgisel arayüzü ve gerçek zamanlı seviye yazdırma işlevselliğine ek olarak Algo Map Lite, performans iddialarını güçlendirmek için titiz kazanma oranı ölçümlerini bir araya getirmesiyle öne çıkıyor. Şeffaflık ve güvenilirliğe olan bağlılığımız, son 1000

Our goal is to empower every trader with their own unique trading system.
Indicator - Red-Green Series
Ultimate simplicity: Red for uptrend, green for downtrend! It can be used independently or in combination with other indicators. This is a red-green indicator based on the crossover of two moving averages. We have more indicators in store and will be adding them gradually. Friends who make a purchase are kindly requested to contact us after their purchase.
In the world of financial trading,

AlphaWave Göstergesi ile İşlemlerinizin Potansiyelini Serbest Bırakın! İşlemlerinize Huzur Katın: AlphaWave Göstergesi, grafikleri yumuşatarak ve trendin yönünü hassas bir şekilde okuyarak işlemlerinize huzur katmak için tasarlanmıştır. Net işlem kararları vermek hiç bu kadar kolay olmamıştı. 10 Modlu Devrim Niteliğinde Bir Düzeltme Teknolojisi: AlphaWave Göstergesi ile grafiklerin düzgün ve net bir şekilde görüntülenmesini keşfedin. Devrim niteliğindeki düzeltme teknolojisi, sadece bir değil, t

Her gün belirli bir zaman diliminde çalışan bir PIVOT'u kaç kez aradınız?
Birçok yatırımcı, NYSE açılmadan 2 saat öncesinden 1 saat sonrasına veya NYSE açılışından 30 dakika sonrasına kadar her gün belirli bir zaman aralığına dayalı olarak günün trendinin yönünü tahmin etmek ister.
Bu gösterge, belirli bir zaman aralığı (saat ve dakika) belirlemenize olanak tanır ve bu aralıktan aynı zaman aralığındaki bir sonraki güne kadar bir pivot çizer. Buna dayalı olarak beş çizgi gösterir: medyan, yüks

Subscribe to the 'MA7 Trading' channel to receive notifications about new programs, updates and other information. Ask questions in the profile on the MQL5 .
Description of work
The 'MA7 Flax' indicator is based on the standard Average True Range (ATR) indicator and candle data. Shows candles that are larger in size relative to the ATR indicator value. Detailed information about the 'MA7 Flax' indicator.
Indicator settings
General settings: ATR period – Average True Range indicator period; AT

Subscribe to the 'MA7 Trading' channel to receive notifications about new programs, updates and other information. Ask questions in the profile on the MQL5 .
Description of work
The 'MA7 Viola' indicator is based on the standard Moving Average (MA) indicator. Shows a sharp increase or decrease in the moving average. Detailed information about the 'MA7 Viola' indicator.
Indicator settings
General settings: Difference – difference between the last two MA values, percentage; Period ; Method ; Ap

We have turned one application of the RSI indicator into a separate indicator, represented by red and green bars, which is incredibly simple and effective.
By simply inputting the parameters for the RSI, you can obtain the RSI indicator represented by red and green bars. The application of the RSI indicator has been expanded into a powerful new indicator, visually presented through red and green bars, undoubtedly an innovative move in the field of financial technical analysis. The design of th

RSI Barometer Pro provides traders and investors with intuitive insights into market sentiment and potential trend reversals by representing RSI values using red and green bars. The meticulous design of red and green bars in RSI Barometer Pro visually showcases market dynamics. When the bars appear green, it indicates that the RSI is below 50, suggesting a relatively stable market phase. Conversely, when the bars turn red, it signifies that the RSI is above 50, indicating potential market volat

The implementation of the Trend Turn trend indicator is simple - in the form of lines of two colors. The indicator algorithm is based on standard indicators as well as its own mathematical calculations.
The indicator will help users determine the direction of the trend. It will also become an indispensable advisor for entering the market or closing a position. This indicator is recommended for everyone, both beginners and professionals.
How to interpret information from the indicator. We sell

Product Name: RSI Momentum Gauge
Product Description: The RSI Momentum Gauge is an advanced indicator that transforms the traditional concept of overbought and oversold signals from the RSI (Relative Strength Index) into a visually intuitive representation using red and green bars. Designed to empower traders and investors with actionable insights, this innovative indicator provides a clear assessment of market conditions and potential trend reversals. The RSI Momentum Gauge's distinctive feat

Pips on Candles shows the number of pips involved in each candle on the chart. It is possible to set 3 different ranges for counting on each single candle via the RangeType parameter: With "HighLow" you count the pips present between the minimum and the maximum. The number is shown under each candlestick on the chart. With "OpenClose" you count the pips present between the opening and closing price of the candle. The number is shown under each candlestick on the chart. With "HighDistAndLowDist"

The Lyxes indicator is designed to detect price trends and allows you to quickly determine not only the direction of the trend, but also understand the levels of interaction between buyers and sellers. The indicator works on all timeframes and currency pairs. The indicator gives fairly accurate signals and is commonly used in both trend and flat markets. It is advisable to use the indicator in conjunction with other tools for more reliable signals and more informed decisions. The indicator does

The Reversal Trend indicator was created on the basis of the original indicators for searching for extremes, the indicator is well suited for determining a reversal or a large sharp jerk in one direction, thanks to it you will know when this happens, it will notify you by the appearance of a blue dot to buy red to sell.
It is based on the process of identifying the rate of change in price growth and allows you to find entry and exit points from the market.
a fundamental technical indicator th
MetaTrader mağazası, geliştiricilerin alım-satım uygulamalarını satabilecekleri basit ve kullanışlı bir sitedir.
Ürününüzü yayınlamanıza yardımcı olacağız ve size Mağaza için ürününüzün açıklamasını nasıl hazırlayacağınızı anlatacağız. Mağazadaki tüm uygulamalar şifreleme korumalıdır ve yalnızca alıcının bilgisayarında çalıştırılabilir. İllegal kopyalama yapılamaz.
Alım-satım fırsatlarını kaçırıyorsunuz:
- Ücretsiz alım-satım uygulamaları
- İşlem kopyalama için 8.000'den fazla sinyal
- Finansal piyasaları keşfetmek için ekonomik haberler
Kayıt
Giriş yap
Gizlilik ve Veri Koruma Politikasını ve MQL5.com Kullanım Şartlarını kabul edersiniz
Hesabınız yoksa, lütfen kaydolun
MQL5.com web sitesine giriş yapmak için çerezlerin kullanımına izin vermelisiniz.
Lütfen tarayıcınızda gerekli ayarı etkinleştirin, aksi takdirde giriş yapamazsınız.