Nuevos indicadores técnicos para MetaTrader 5 - 34
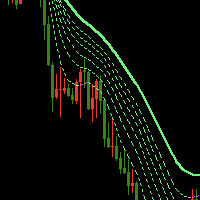
The Waterfall Trend Indicator MT5 uses line regression algorithm, using "Waterfall" in its name is in that it like waterfall when there is a strong down market trend. The indicator draws seven lines, one of which is sold line, others are dash line, the sold line is more stable. Indicator introduction The indicator can effectively filter price noise since it is calculated with line regression. It can be used to analyze market trend and design new expert that is based on trend. When the trend lin

Percentile of Historical Volatility and Correlation Coefficient shows if the asset is cheap or expensive based on the volatility. It is used to determine a good entry point. It has two indicators built in: Historical Volatility is ranked percentile wise and its correlation to price action which gives an indication of the direction of a possible future move. Together the both indicators can give good entries and direction. Historical Volatility is a statistical measure of the dispersion of retu

This z-score indicator shows the correct z-score of an asset, as it uses the normalized price data for calculation, which is the only correct way. Z-score is only applicable for normal distributed data, therefore not the actual price is considered, but the normalised returns, which were assumed to follow a normal distribution. Returns are mean reverting and assumed to follow a normal distribution, therefore z-score calculation of returns is more reliable than z-score on price, as price is NOT m

Critical Trading, Currency Strength This indicator allows for viewing true value changes in the 8 major currencies, this ability has many applications for simple and advanced forex trading. No need to switch to inaccurate 3rd party applications or websites. Trend catching: No need to watch 28 charts, pair up the strongest and weakest performing pairs. Optimize entries: Show the currencies of your current chart and enter on reliable pullbacks for further confluence on your trades. Currency perfo
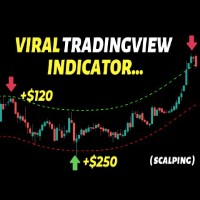
This indicator builds upon the previously posted Nadaraya-Watson Estimator. Here we have created an envelope indicator based on kernel smoothing with integrated alerts from crosses between the price and envelope extremities. Unlike the Nadaraya-Watson Estimator, this indicator follows a contrarian methodology. Settings
Window Size: Determines the number of recent price observations to be used to fit the Nadaraya-Watson Estimator.
Bandwidth: Controls the degree of smoothness of the envelop
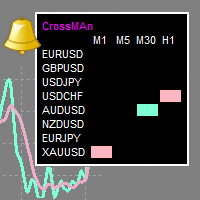
"CrossMAn" is a table indicator that gives signals about the intersection of two moving averages, on selected instruments and time periods.
The intersection of moving averages is one of the most popular signals on the stock exchange.
The signal is displayed as colored rectangles in the table. Thus, you can assess at a glance which tool should be paid attention to.
(Crossman does not add moving averages to the chart.)
The indicator table can be dragged with the mouse.
The size of the table

Sniper2 , Cuenta con puntos de lineas , con colores que te estan mostrando una entrada , que funcionan como soporte y resistencia ! las lineas de puntos verdes verde muestra entrada en venta , las lineas de puntos rojos muestra entrada en compra , fijarse en los soportes que funcionan como roptura para agarrar velas largas en mayor temporalidad . funciona para forex todo los pares funciona para indices sinteticos todo los pares ! indicador en oferta !

Sniper Clock Oscillator . es un indicador donde cumple con la estrategia del cruce de la linea de 50 con una linea azul y otra roja . se envia un alerta dando entrada en compra o venta ! muy efectivo y facil de usar se usa en los mercados de indices sinteticos ideal para los volatilitys y jumps . se usa en los mercados de forex , en todos los pares de divisas . se usa para scalping y para intra diario . sirve para agarrar largaas tendencias a altas temporalidades tambien ! Buen profit !

Rango Sniper ,
cuenta con una banda programado para cazar entradas perfectas .
lleva dos lineas que sirve para cazar pivots perfectos cuando salen las velas de la banda ,
sirven para todos los pares de indices sinteticos , perfecto para volatility y jumps
sirve tambien para el marcado de forex , se opera en todo los pares
sirve para hacer scalping y temporalidades mas altas !

Moving Level , Indicador especial para cazar tendencias y hacer scalping ! programado para usarlo en cualquier temporaliadad, cuenta con la extrategia del volumen de tendencia marcando una flecha si es long o short acompañado por los colores azul yellow y rojo cuando marca la linea yellow con la flecha hacia arriba y va acompañado por lineas azules es tendencia alcista Cuando marca la flecha hacia abajo con la linea yellow y va acompañado de lineas rojas es tendencia bajista , Se usa en

Defining Range ( DR ) and Implied Defining Range ( IDR ) indicator Pro with added features from free version
Show DR and IDR ranges Sessions on the chart for RDR Regular defining range (New York Session)
ADR After defining range (Asian session) ODR Outside defining range (London Session)
Buttons on chart to enable / disable :
Show Imbalance ( IMB ) Show Volume Imbalance ( VIB ) Show Gap's between open and close
Show Standard Deviation ( SD )
Show last 3 Sessions

The purpose of using Smart money index (SMI) or smart money flow index is to find out investors sentiment. The index was constructed by Don Hays and measures the market action. The indicator is based on intra-day price patterns. The beginning of the trading day is supposed to represent the trading by retail traders. The majority of retail traders overreact at the beginning of the trading day because of the overnight news and economic data. There is also a lot of buying on market orders and shor
FREE
An Ultimate Tool for quick and efficient market analysis. Unique combination of solid indicators defining market direction for trend tracking and filtration designed for you to stay on the right side of the market.
Market Rider Tools gives you access to one of the most used from professional trades indicators on worldwide, which were not build in for MT4 and MT5 terminals . These are unique non-repainting indicators designed to be used on all time frames for all instruments classes: Fo

An Ultimate Tool for quick and efficient market analysis. Unique combination of solid indicators defining market direction for trend tracking and filtration designed for you to stay on the right side of the market.
Market Rider Oscillators gives you access to one of the most used from professional trades indicators on worldwide, which were not build in for MT4 and MT5 terminals . These are unique non-repainting oscillators designed to be used on all time frames for all instruments class

Indicador Regressão Linear – Par de Ativos - INTRADAY Indicador é um oscilador que faz o plot do Resíduo resultado da regressão linear entre os dois ativos inseridos como input do indicador, representado pela fórmula: Y = aX + b + R Onde Y é o valor do ativo dependente, X é o valor do ativo independente, a é a inclinação da reta entre os dois ativos, b é a intersecção da reta e R é o resíduo. O resíduo representa a quantidade da variabilidade que Y que o modelo ajustado não consegue explicar. E
FREE

Indicador Regressão Linear – Par de Ativos Indicador é um oscilador que faz o plot do Resíduo resultado da regressão linear entre os dois ativos inseridos como input do indicador, representado pela fórmula: Y = aX + b + R Onde Y é o valor do ativo dependente, X é o valor do ativo independente, a é a inclinação da reta entre os dois ativos, b é a intersecção da reta e R é o resíduo. O resíduo representa a quantidade da variabilidade que Y que o modelo ajustado não consegue explicar. E os resíduos
FREE

Fibonacci retracement levels—stemming from the Fibonacci sequence—are horizontal lines that indicate where support and resistance are likely to occur. Each level is associated with a percentage. The percentage is how much of a prior move the price has retraced. The Fibonacci retracement levels are 23.6%, 38.2%, 61.8%, and 78.6%. While not officially a Fibonacci ratio, 50% is also used. The indicator is useful because it can be drawn between any two significant price points, such as

Build your own model to predict averages of turning points of the Triple Moving Average Oscillator. It is simple. Rate me with stars. Just load the indicator Triple Moving Average Oscillator in you platform and choose the period. Scroll through to observe the averages of the highs and lows over a period of time. Add the levels for a buy and a sell on the Triple Machine and this will show the average of highs and lows to look for buys and sell. You can load multiple copies with multiple levels.

The diamond top and bottom are reversal patterns. It represents a rally to a new high with a drop to a support level followed by a rally to make a new high and a quick decline, breaking the support level to make a higher low. The bounce from the higher low is then followed by a rally, but making a lower high instead. Once this behavior is identified, prices then break the trend line connecting the first and second lows and start to decline further. You can find MT4 version hier
Indicator show
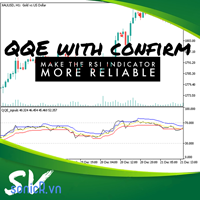
New QQE with confirm The relative strength index (RSI) is a technical indicator of momentum that measures the speed and change of price on a scale of 0 to 100, typically over the past 14 periods. Cause RSI measures the speed and change of price, trader normally use this indicator in two way: + Buy when oversold, sell when overbougth. + buy or sell when identifying divergence from rsi with price. In two way, it wrong when rsi in overbouth (for example) for long time or divergence. Even price ju

The problem with trading candlestick patterns becomes obvious, after some experience in live markets. Hypothetical branching of candlestick patterns, are not necessary for successful trading. As a Price action trader, my principle is to keep things simple and consistent. My focus is on buying and selling pressure, which is visible in market structure. Trade Management and discipline are my secondary core elements. This indicator detect 4 Simple but Effective Price action Patterns! Yellow = Insi
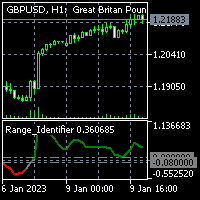
To get access to MT4 version please click here . - This is the exact conversion from TradingView: "Range Identifier" By "Mango2Juice". - All twelve averaging options are available: EMA, DEMA, TEMA, WMA, VWMA, SMA, SMMA, RMA, HMA, LSMA, Kijun, McGinley - This is a light-load processing and non-repaint indicator. - Buffer is available for the main line on chart and not for thresholds. - You can message in private chat for further changes you need.
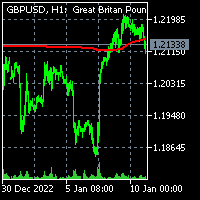
To get access to MT4 version please click here . - This is the exact conversion from TradingView: "Trend Regularity Adaptive Moving Average","TRAMA" By " LuxAlgo ". - This is a light-load processing and non-repaint indicator. - Buffer is available for the main line on chart. - You can message in private chat for further changes you need. Thanks for downloading

This indicator labels swing highs and swing lows as well as the candle pattern that occurred at that precise point. The indicator can detect the following 6 candle patterns: hammer , inverse hammer , bullish engulfing , hanging man , shooting star and bearish engulfing .
The notations HH, HL, LH, and LL you can see on the labels are defined as follows:
HH : Higher high
HL : Higher low
LH : Lower high
LL : Lower low
Setting
Length: Sensitivity of the swing high/low de

The Trend Snatcher is a multi-timeframe indicator that detects swings on the price market chart. Important levels, such as Supply and Demand levels, Trendline touches, reversal patterns, and others, can also be added as confluence when making trading decisions.
The indicator employs two lines that aim for the highest selling and lowest buying levels. When the two lines cross, a signal is generated.
All trading instruments are compatible, including currency pairs, synthetic indices, metals

## Si no puede usar la versión de demostración, contáctenos por mensaje.
## Opere profesionalmente usando WAPV Full y sea capaz de rastrear ¿Dónde está el dinero de los grandes jugadores? Imagina que tienes en tus manos una herramienta que solo hace la lectura de los principales jugadores del mercado, mostrando las mejores regiones comerciales basado en el análisis de Precio y Volumen. WAPV Full es una herramienta completa, 100% enfocada a la operativa de R. Wyckoff Además de mapear los mov

The Fair Value Gap (FVG) is a price range where one side of the market liquidity is offered, typically confirmed by a liquidity void on the lower time frame charts in the same price range. Price can "gap" to create a literal vacuum in trading, resulting in an actual price gap. Fair Value Gaps are most commonly used by price action traders to identify inefficiencies or imbalances in the market, indicating that buying and selling are not equal. If you're following the ICT Trading Strategy or Smar
FREE

Funciones
Indicador para el Trading de Retroceso de Fibonacci Se dibuja un gráfico de Fibonacci basado en la barra previa seleccionada entre 1H, 4H, 1D y 1W. Cuando el precio del mercado toca el nivel de Fibonacci, cambia el color y se muestra la hora del toque. El gráfico de Fibonacci se dibuja en los niveles -23.6, 0, 23.6, 38.2, 50, 61.8, 76.4, 100 y 123.6, y el gráfico se refresca cuando se actualiza la barra.
Variables
Marco de tiempo: Se dibuja un gráfico de Fibonacci con el marco
FREE

The volatility scanner indicator is a tool that helps traders identify and analyze volatility in all the market timeframes for the current chart. This way you can find potentially profitable trades on every timeframe for the current symbol.
What It Does? Scan all timeframes to find a volatility contraction. Color the button yellow if there is a volatility squeeze at that timeframe. Clicking on the button instantly changes timeframe.
How To Use It? Just put it on the chart and click on the y

Better Period Separators For MetaTrader 5 The built-in period separators feature doesn’t allow users to specify the time period, so you can use this indicator to create more customizable period separators. On intraday charts, you could place period separators at a specific time, you could also place extra period separators at a specific time on Monday to mark the start of a week. On higher timeframe charts, this indicator works the same as the built-in period separators, On the daily chart, per
FREE
This is an indicator meant to catch trends as they are coming from a retracement .it can be used for any symbol . We can use this indicator to catch spikes or sculp for Boom , Crash ,Range Break . it offers a sell signal and buy signal and an exit signal which can also be used to enter price reversal if you see fit the indicator has a higher time frame filter system which can go up to 2 levels of time filtering which will give you more accurate signals based on the trend ,this feature can be tur
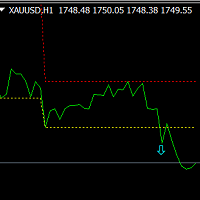
This is an MT4 indicator based on algorithmic fluctuation statistics, which mainly includes two parts: one is display the fluctuation area, and the other is to display the signal at the same time if there is a signal generated.
Its main principle is to conduct data statistics based on the specified extreme value fluctuation radius, and draw the fluctuation area. If the breakthrough area is displayed, the signal in the same direction will be displayed. Advantage:
Suitable for all breeds. App

Indicator for fast navigation through financial instruments. When you click on the button, you go to the chart of the financial instrument, the name of which was written on the button. In other words, the indicator opens or unfolds an existing chart window. For each chart, you can customize the name of the financial instrument, text color and background color; in total, you can customize symbols buttons that you trade often. The indicator can be installed on any charts for which you need to swit
FREE

This indicator shows external bars ("Aussenstäbe") in the chart in candle form.
The colors of the candles can be set individually.
Also different colors for bearish and bullish bars are possible.
In addition, the color of the wicks or outlines is also adjustable.
Outside bars are mentioned e.g. by Michael Voigt in the book "Das große Buch der Markttechnik".
All other candles are inner bars.

ZigZag Esmeralda El indicador Zig Zag Esmeralda se basa en patrones de 4 puntos La condición de monotonocidad de tendencia alcista comienza con aparición de patrones alcistas para máximos y mínimos Se aplica una lógica similar para la tendencia bajista Esta programado para indices sinteticos y forex ! Se utiliza en sinteticos en los pares volatiles y jumps apto para todas las temporalidades , tanto como para scalping como para intradiario.

Winner Oscillator . Como bien se llama es un oscillator que consta con una estrategia de velas heikin ashi + un oscillador programado para agarrar rebotes perfectos como bien se ve en la foto sirve para hacer scalping y intradiario . funciona para toda las temporalidades ! y tambien para todo los pares de forex y indices sinteticos funciona muy bien tambien en los volatilitys, jumps , crash y boom !

Ice Up . es un indicador donde cumple la funcion profesional de un zigzag junto con soporte y resistencia perfecto para agarrar tendencias largas y cortas . en la nueva version de Ice mejora al %100 los pivots . sirve para toda las temporalidades sirve para forex y indices sinteticos , y si el broker tiene tambien crypto . funciona para todo los pares de fores y indices sinteticos .
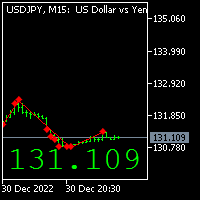
Market Pricee Cuenta con el indicador donde marca el precio actual donde se usa para visualizar mejor el precio y segun el color lime , gray . magenta . donde el lime marca el precio actual , gray marca sin alteracion del precio el magenta marca el fallo del precio . sirve para todas las temporalidades , para Forex y indices sinteticos . Todos los pares de forex y todo los pares de indices sinteticos .

Dragon Bolling . es un indicador programado como bandas de bollinger mejoradas cuenta con un up, medium y down , para agarrar long corte y short , especial para hacer scalping funciona en toda las temporalidades en los mercados de forex y indices sinteticos , en forex todo los pares en indices sinteticos todo los pares , pero diseñado tambien para operar los volatilitys y los jumps ! en m1 . m5 y m15 , scalping fichar en h1 y h4 para largos !

Ticks Candles Chart indicator build equi-volume candles and designed for Oracle Strategy The Period in ticks is set directly on the chart Tick chart opens in a separate window Recommended to use tick periods from 50 and above Works on real time only
Input Parameters Ticks_In_Bar - default period in ticks Counting_Bars - how many tick bars of history to build Custom_Symbol_Suffix - additional suffix for symbols

ZigZag Ruby , Indicador 1 de 5 el zigzag ruby consta con una estrategia de pivots donde termina de dar una señal se agarra el siguiente pivot facilmente , como se ve en la foto sirve para cazar largas tendencias en temporalidades de h1 , h4 y d1 , ideal para hacer scalping , sirve para los mercados de forex, todo los pares ! sirve para los mercados de indices sinteticos ! todo los pares

Macd Ruby , indicador 2 del pack ruby cuenta con la estrategia del cruce de medias moviles , donde se encuentra el primer cruce para la alza o para la baja , entrar en posicion sirve para agarrar largas tendencias tambien en otras temporalidades , y para hacer scalping en temporalidades bajas , sirve para los mercados de forex todo los pares sirve para los mercados de indices sinteticos todo los pares ! funciona muy bien en los volatilitys y jumps !

Trend Ruby , indicador 3 del pack ruby . trend ruby cuenta con la estrategia de roptura de estructura o linea de tendencia como bien marcan las lineas ay te da la señal de roptura o seguimiento de tendencia y rebote ! funciona para cualquier temporalidad , sirve para hacer scalping y tambien intradiario sirve para los mercados de forex todo los pares , tambien para indices sinteticos todo los pares ideal para los volatilitys y jumps ! tambien crash y boom !

Channel Zone indicador 4 del pack ruby channel zone cuenta con la estrategia en donde el canal channel rompe para el color verde da señal de short donde rompe para el canal rojo da señal de long , es muy simple y facil de usar , ideal para agarrar largas tendencias como se ve en la foto ideal para hacer intradiario sirve para los mercados de forex todo los pares para los mercados de indices sinteticos todo los pares ! y para todas las temporalidades.

Fibo Ruby indicador 5/5 pack ruby fibo ruby cuenta con la estrategia de un fibonacci programado a captar la tendencia alcista como bajista ideal para agarrar rebotes en los puntos de 23.6 , 38.2 , 50.0 y 61.8 se adapta a cualqier temporalidad sea para hacer scalping o intradiario . sirve para los mercados de forex, todo los pares sirve para los mercados indices sinteticos , todo los pares ideal para boom y crash !
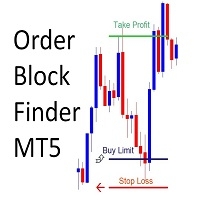
Order Block Finder
Sends Alerts – On MT5 To Your Phone To Your Email
Does not repaint .
Works on any Forex pair, any timeframe.
10 Activations allowed so you are free from limitations >> MT4 Version Here Spreads from 0.1pip RAW/ECN Accounts, click here . Check out my Waka Esque EA signal here: >> High Risk Settings or Medium Risk Settings .
What Is An Order Block? An Order Block (or Banker Candle, or Institutional Candle) is an opportunity to get very high risk to reward

The indicator ‘Probability Range Bands’ gives a prediction of the amount, how much the asset is moving from its current price. The range bands give probabilities, that the candle close will not exceed this certain price level. It is also called the expected move for the current candle close. This Indicator is based on statistical methods, probabilities and volatility. Asset price is assumed to follow a log-normal distribution. Therefore, log returns are used in this indicator to determine the

Black Card Pack indicators . Bars Black indicador 5/5 del pack cuenta con una estrategia de roptura de bars como se llama el indicador , es muy facil de usar, si bien se ve en la foto cuando rompe la ema bars para abajo entrar en posicion para arriba es lo mismo ! funciona para todas las temporalidades , sirve para cazar grandes tendencias y hacer scalping apto para forex y indices sinteticos funciona en todo los pares de ambos !
Pack Black Card, Indicador 5/4 Channel black , es un indicador que cuenta con la estrategia de agarrar pivots sobre un canal ya programado como se ve en la foto es perfecto para hacer scalping tomandolo en temporalidades de m30 , m15 , m5 y m1 para agarrar rebotes de profit . aunqe funciona para todas las temporalidades esta diseñado para hacer cortos , sirve para los mercados de forex y indices sinteticos todo los pares estan aptos para operar !

Pack Black Card indicador 5/3 Green power cuenta con la estrategia de ropturas high y low dando la señal con el punto rojo o verde el punto rojo para short y el punto verde para long , perfecto para los mercados de forex y los mercados de indices sinteticos , funciona para todas las temporalidades sirve para hacer scalping y intradiario ! Ideal para los mercados Crash y boom !!

Pack Black Card Indicador 5/2 Macd Divergence Black cuenta con la estrategia del cruze de emas y las lineas diversgntes como bien se ve en la foto ! sirve para todas las temporalidades sirve para los mercados de forex y los mercados de indices sinteticos ideal para los pares volatility 75, volatility 100, volatility 25 y volatility 50 para todos los jumps ! para forex funciona en todo los pares !

Pack Black Card indicador 5/1 Point black cuenta con la estrategia de bollingers profesionales donde cada flecha te da una señal distinta de entrada . sirve asta para operar en m1 y en d1 sirve para hacer scalping y intraday , modificado para los mercados de forex ! apto para todo los pares modificado para los mercados de indices sinteticos apto para todo los pares ! Ideal para los volatilitys y jumps !

Pack Yacht Indicador 3/3 Fibo Yacht , cuenta con la estrategia fibonacci pero cazando mejor los rebotes/pivots . como se ve en la foto se puede calcular los retrocesos en cualqier temporalidad , funciona muy bien para los indices sinteticos , y forex tambien ! esta diseñado para los pares volatilitys y jumps tambien trabaja en los crash y boom ! se coloca el indicador y ya se opera !

Pack Yacht indicador 2/3 Oscilador yacht , cuenta con la estrategia de ropturas con el oscilador en los niveles , 1.05 , 0.50 , 0.00 , 050 y 1.05 son 5 niveles donde ya no da mas el volumen en el periodo de 1,05 del lado de abajo se empiesa a formar la vela roja subiendo ay da señal de long , donde lo verifica con 3 puntos amarillo, verde y rojo , lo mismo es para short cuando rompe el nivel verde , y quiebra la linea cambiando de color da inicio de entrada funciona para los mercados fore

Pack Dragon . Indicador 3/3 Dragon machine , cuenta con la estrategia perfeccionada de soporte y resistencia , indica los pisos y techos a simple vista se ve , dando señal a cada circulo pink dando entrada ala alza y el circulo verde da entrada ala baja , donde ayuda los apoyos de las lineas verdes y rojos . Funciona para indices sinteticos y forex todo los pares , ideal para operar crash y boom . !

Pack Dragon, Indicador 2/3 Legend Moving Cuenta con la estrategia de pase de barrera como bien se ve en la foto , donde ay un punto sobre la linea amarilla , cuando ay tendencia bajista , ay puntos rojos cuando cae dando entradas perfectas en short , lo mismo cuando el mercado esta alcista , marca otra linea celeste marino , donde da entradas perfectas sobre los puntos verdes para long , esta disponible para todas las temporalidades y para los mercados de Forex y indices sinteticos !
Pack Dragon , Indicador 3/1 , Dragon signal cuenta con la estrategia de un oscillador programado para agarrar soportes y resistencias para aprobechar cada vela del mercado , y te da para tomar tu tiempo y un simple analisis es simple donde marca los puntos verdes en la parte baja te da entrada para long y cuando no marca nada te esta dando aviso de short ! sirve para todas las temporalidades , para los mercados forex y indices sinteticos !

ForexBob Candle Timer Is an amazing countdown time indicator which shows the time remaining for next candle to open. It can be used on any timeframe. It helps to plan your next trading action.
Inputs are simple Color - To change the color of displaying time. Size - To set the size of font Next for settings are used to set the location of time Font - To change the font type.
Please check my other products here https://www.mql5.com/en/market/my
FREE

Menora (All In One) Indicator.
This is the advanced and premium indicator for the Magic Trend, a free indicator. It has 3 output signals driven by different market conditions. This indicator has a double function of working as an indicator and utility at the same time.
Specifications
1] 3 output signals a) Slow Moving Average with color change - The MA has a non-repaint color change, which makes it perfect for entry signals. b) Fast Moving Average (the original Magic Trend line) - Give
FREE

This indicator shows OutsideBars (OB) and InsideBars(IB) in the chart in candle form.
The colors of the candles can be set individually. Also different colors for bearish and bullish IBs or OBs are possible.
In addition, the color of the wicks or Outlines can also be set.
OutsideBars and InsideBars often show good zones for support or resistance. See the Screenshot for some examples.

Inspired investing.com Technical Indicators, this indicator provides a comprehensive view of the symbol by synthesizing indicators including: RSI, StochRSI : have 3 level oversold - red, midle (aqua when upper, pink when lower), overbuy – blue Stoch: oversold – red, overbuy- blue, aqua when main line < signal line, pink when main line > signal line MACD: aqua when main line < signal line, pink when main line > signal line ADX: aqua when line plus > line minus, pink when line plus < line minus
This is a Lite version of my Binary Wave Advance Oscillating indicator: https://www.mql5.com/en/market/product/90734 Free for a limited time! It reduces the less useful indicators, while keeping it's predictive modifications to make each indicator within better than their stock counter part. I reduced it and made it simpler, in the hopes it would be less overwhelming and more approachable. Contains: ADX Chaikin Money Flow Index Each have separate smoothing controls to tame faster periods, as we

This is similar in it's idea as the Binary Advance/Lite indicator, but this is intended to use as a levels indicator, as well as trend reversal and how ranging the market is. It takes several useful indicators and combines them in such a way as to declutter your charts, yet prove even more useful together, than separate. RSI, RVI, DeMarker, MACD are added together then multiplied by ATR and StdDev to reveal multiple factors: How far the price has changed, and as the price slows down and reverses

Type(1EMA,2DEMA,3TEMA) FastPeriod SlowPeriod SignalPeriod PriceApplied ( HIGH(H) LOW(L) OPEN(O) CLOSE(C) MEDIAN(HL) TYPICAL(HLC) WEIGHTED(HLCC) )
Deviate Up Deviate Down Deviate Bar
What Is Moving Average Convergence/Divergence (MACD)? Moving average convergence/divergence (MACD, or MAC-D) is a trend-following momentum indicator that shows the relationship between two exponential moving averages (EMAs) of a security’s price. The MACD line is calculated by subtracting the 26-pe

The parabolic SAR indicator, developed by J. Welles Wilder Jr., is used by traders to determine trend direction and potential reversals in price. The technical indicator uses a trailing stop and reverse method called "SAR," or stop and reverse, to identify suitable exit and entry points. The parabolic SAR indicator appears on a chart as a series of dots, either above or below an asset's price, depending on the direction the price is moving. A dot is placed below the price when it is trending u

What Is the Relative Vigor Index? The Relative Vigor Index (RVI) is a momentum indicator used in technical analysis that measures the strength of a trend by comparing a security's closing price to its trading range while smoothing the results using a simple moving average (SMA). The RVI's usefulness is based on the observed tendency for prices to close higher than they open during uptrends, and to close lower than they open in downtrends. KEY TAKEAWAYS The Relative Vigor Index (RVI) is a

Long & Short Based on Cointegration Statistical and Quantitative Long-Short (Pair Trading) approach for long and short positions. Your CPU will always be safe and stable when using Multiple Linear Regression if you have a reliable indicator. Based on the results of this indicator, you can execute a long and short or a long and long/short and short trade between two separate assets. It can show you a Highly informative dashboard based on Cointegration Search you determine, with all statistical d

I developed this vwap with more settings in order to be customized as much as possible. VWAP is a really strong indicator for your trading. It can be used to check if the market is in balance or ranged, and also you can use the levels as support/resistence/target. In the pictures you can see the main settings, and you can select the use of real volume from the broker.
Hope you will find it useful. Many thanks in advance.
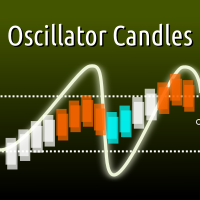
With this indicator you can colorize the candles on your chart based on the output of any oscillator indicator. Supporting both built-in and custom indicators, with the ability to set up to 5 custom parameters, custom color scheme, and upper/lower threshold values. Most built-in indicators in MT5 will be found under "Examples\\" path. For example, to use default RSI indicator, set your indicator path to "Examples\\RSI" in the inputs dialog. Input01-05 sets the custom parameters of your indicator

Recibe alertas cuando estalle una tendencia. Este indicador señala cuando el precio hace un gran movimiento en la dirección de la tendencia dominante. Estas señales pueden servir como puntos de entrada o puntos para agregar a una posición existente en una tendencia.
Nota: El seguimiento de tendencias tiene una tasa de ganancias baja (menos del 50 por ciento), pero el rendimiento de la operación ganadora promedio suele ser de 3 a 5 veces mayor que la operación perdedora promedio.
Configurac
FREE
MetaTrader Market es el mejor lugar para vender los robots comerciales e indicadores técnicos.
Sólo necesita escribir un programa demandado para la plataforma MetaTrader, presentarlo de forma bonita y poner una buena descripción. Le ayudaremos publicar su producto en el Servicio Market donde millones de usuarios de MetaTrader podrán comprarlo. Así que, encárguese sólo de sus asuntos profesionales- escribir los programas para el trading automático.
Está perdiendo oportunidades comerciales:
- Aplicaciones de trading gratuitas
- 8 000+ señales para copiar
- Noticias económicas para analizar los mercados financieros
Registro
Entrada
Si no tiene cuenta de usuario, regístrese
Para iniciar sesión y usar el sitio web MQL5.com es necesario permitir el uso de Сookies.
Por favor, active este ajuste en su navegador, de lo contrario, no podrá iniciar sesión.