MetaTrader 4용 Expert Advisor 및 지표 - 54
Candlestick Patterns Finder is a great tool to analyze candlestick charts. Indicator contains an advanced search algoritm and friendly graphic interface based on modified EasyAndFastGUI library. Has the ability to recognize 24 candlestick patterns. It was designed with the idea of simple and more efficient use of the indicator. It supports decision-making by automatically identifying candlestick patterns on the chart. The indicator has the ability to run in mode with and without a graphic

Contact me through this email address to download the FREE strategy PDF for this indicator tharindu999lakmal@gmail.com
Download MT5 version here -- >> https://www.mql5.com/en/market/product/119467
Introduction The "VIP Buy Sell Signals MT" is designed to provide BUY and SELL trade signals based on the current market conditions. A Trading Strategy (Chee sheet) has been provided for this trading indicator. (Read the description). This indicator has time tuned e ntry signals . so

With Easy News, you can trade breakouts from a range at specific times.
This is particularly lucrative for news and economic announcements because high risk/reward ratios are often present in these situations. This tool is suitable for all currencies and timeframes. It includes profit pyramiding. This means that when the first order is in profit by xx points (adjustable), another order is opened (depending on the set quantity).
How does it work? At a specific time, the tool creates 2 stop orde
FREE

This is a simple and free Expert Advisor that trades candlesticks. It compares several nearest bars and their volumes, and opens a trade based on that data. Unlike the professional version , it analyzes only 1 timeframe. The recommended timeframes for this EA are H1, H4, D1, it works with any currency pairs. The parameters always need to be optimized before trading, as well as after some period of trading.
Input Parameters Lots - lot size (if Lots=0, then the lot will be calculated based on the
FREE

Индикатор отображает различными цветами на фоне графика три торговые сессии. Открытие - закрытие Лондон, Нью Йорк, Токио по умолчанию. Применение Для успешной торговли важно знать начало и конец торговых сессий с наибольшей ликвидностью, так как именно в это время цена делает самые большие движения.
Особенности Настройки по умолчанию - торговые сессии по Лондону, Нью Йорку, Токио. Возможность выставить свои рамки тоговых сессий Алерт при открытии сессии Показ открытия дня по GMT Настройки для
FREE
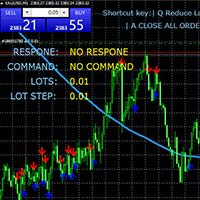
MT4 키보드 거래 플러그인 상세 설명 소개 : 이 MT4(MetaTrader 4) 플러그인은 키보드 단축키를 통해 효율적이고 직관적인 거래 경험을 제공하며, 스칼핑 전략을 따르는 거래자들이 빠르고 정확한 거래를 원하는 경우에 특히 유용합니다. 이 플러그인은 거래자의 각 거래에 대한 포지션 크기를 동적으로 조정하고, 정확한 이익추적 및 손실정지 수준을 미리 정의함으로써 거래를 간소화하고 효율화시킵니다. 핵심 기능 : 키보드 단축키 : 거래 과정을 간소화하여, 다음 거래에 대한 포지션 크기 조정, 매수, 매도, 주문 관리를 위한 사용자 정의 가능한 키보드 단축키를 사용합니다. 동적 포지션 크기 조정 : 거래 시점에 따라 포지션 크기를 쉽게 증가하거나 감소시키며, 시장에 민감하게 대응할 수 있습니다. 위험 관리 : 각 거래에 대한 이익추적 및 손실정지 수준을 피프로드로 미리 정의하여, 모든 거래에 대한 위험을 정교하게 관리합니다. 사용자 정의 : 차트의 글꼴 스타일, 글자 크기 및 배치
FREE

Advantages: Based on classic indicators - ATR, Moving Average Determines the trend / flat in the market by coloring the histogram with the appropriate color Arrows indicate confirmed signals It is an excellent filter for channel strategies (by extremes)
Settings:
Наименование Описание настройки Period of Flat Detector Number of bars / candles for analysis Period of EMA Period of EMA (Moving Average) Period of ATR Period of ATR (current timeframe) Coefficient of deviation Coefficient of deviati
FREE
This EA is a flexible and powerful metatrader expert advisor that trades using the MACD indicator and implements many useful features. It can trade using the MACD indicator alone, or donchian breakouts confirmed by the MACD indicator from any timeframe. Additionally, it offers a martingale feature and forex session filters. [ Installation Guide | Update Guide | Troubleshooting | FAQ | All Products ] Easy to use and supervise Fully configurable settings Customizable break-even, SL, TP and trailin

Was: $99 Now: $49
Blahtech Daily Range indicator displays the average daily range alongside the individual session ranges. Using the daily open price as a reference the indicator shows fixed range and dynamic range targets as lines on the charts. These lines clearly show when the average range has been exhausted. Daily and session ranges can be useful for confirming entries or setting targets and is an excellent odds enhancer for many trading systems. Links [ Documentation | Install

Retracement Reversal and Support and Resistance Pro is based on a formula used by Proprietary trading firms and other big institutions on WallStreet including on my Company and used by my traders here in the capital of the world. This indicator will create Red and Green arrows on a possible mayor Retracement level, Reversal Level and future Support and Resistance levels and Yellow arrows on a possible m i nor Retracement level, Reversal Level and future Support and Resistance levels . This in
FREE
Discover our brand new trading robot, IT Fractals EA , a revolution in the world of automated trading. Our EA pushes the boundaries by utilizing the fractals indicator for exceptional performance.
Key Features :
Fractals Strategy : IT Fractals EA stands out by adopting an innovative strategy based on the fractals indicator. This clever approach allows you to pinpoint market reversal points with precision, thus identifying optimal trading opportunities. Advanced Management : Our EA comes equip
FREE
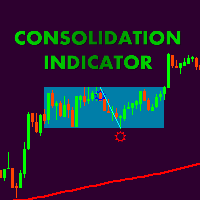
Сonsolidation box indicator with possibility of flexible settings according to the traiders requipments. Also, it is possible to embed indicatior in EA. Thank Alexey Mavrin for realization of technical task. According to the classic technical analysis the price is in motion without a clear direction for almost 70% of the market time and methods of getting profit from flat should be in the arsenal of any trader. Price consolidation- are periods of market equilibrium when supply and demand are app

Moving Average EA
=============== This Robot is fully automated and has been created for everyone. The Robot works also on cent accounts.
The Ea is based on Moving averages ========================================= You can set up which Moving Averages you want to cross. But keep in mind if you use a smaller frame you will get more signals.And also consider the profit when there was a crossover but the market is trading sideways. Maybe better to go for small profit, set it on higher time frame

Master Gold Demarker is a very accurate expert advisor for gold and all pair currencies. This EA is designed with a moving average indicator to see trends, demarker to see momentum, and MACD/engulfing candles for entry points.
Recommendations:
Currency pair: XAUUSD/GOLD Timeframe: M5 Minimum deposit gold/xauusd : $1000 ($2000 recommended) Account type: Raw or zero spread accounts IMPORTANT: It is very important to use LOW SPREAD accounts for best results !
setfiles : 2 digit : https://c.mq
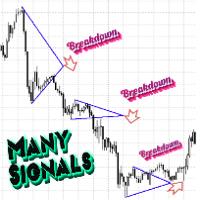
Индикатор уровней треугольник подскажет в какую сторону может двинуться цена при пробитии одной из них.
Если вы сомневаетесь в какую сторону торговать, то этот индикатор вы можете использовать как фильтр на любом инструменте и любом таймфрейме.
Индикатор разработан таким образом , чтобы помочь выявлять направление движения цены.
Стратегия построения прямоугольника работает по авторскому алгоритму нахождения определённых консолидаций.
Цена на индикатор минимальна для первых продаж.
Далее цена 99

Candle Pattern Alert indicator alerts when the last price closed candle matches the set input parameters. You can choose to scan through all the symbols in Market Watch or enter your favorite symbols and also you can enter time frames you need to scan. --------- Main settings- ------- Select all symbols from Market Watch? - if Yes the program scans through all the symbols displayed in Market Watch, if No - only selected in next input symbols are scanned
Enter symbols separated by commas - enter
FREE

Symbol Information The Symbol Info indicator provides an intuitive panel on the chart that displays essential information about the current trading symbol. This includes basic trading data, instrument properties, and trading rules, all designed to give traders a clear view of the market conditions and product specifications. Key Features: Symbol Name and Description:
The indicator displays the name and a detailed description of the current trading symbol, helping users identify the instrume
FREE

This is an alert for when price is above the 200 ema, macd is below its zero line and the slow ma crosses above the fast ma and vice versa for sells. It has been tested 100 times as seen on youtube and has a 65% win rate on the 30 minute time frame.
I've attached a video to explain how to use it. Under the vuideo is a link to Trading Rush video where he tests the strategy 100 times on 30 minute.
(1) INDICATOR PARAMETERS
MA Period . Default is 200 MA Type . Default is

Fibonacci Sniper MT4 - No Repaint
Features:
- Indicator sends signals and notifications on key Fibonacci Retracement and Fibonacci Extensions Levels
- Once the buy/sell signal is set, targets ( TP1 TP2 TP3 )and stop loss levels are drawn by the indicator.
- Fibonacci Calculations and Custom Patterns are identified by the last 3 or 5 Zig Zag exterum.
- You can easily identify key harmonic patterns like Gartley, Bat, Butterfly and Crab patterns.
Important Settings: - Choose the Zig Zag Set

The indicator displays crossing zero level by Moving Average of Oscillator (OsMA) in the form of arrows. The indicator notifies about a signal by means of a pop-up Alert window, or sending notification to e-mail.
Parameters Fast EMA Period - fast EMA. This is an exponential moving average from a price with a short period. Slow EMA Period - slow EMA. This is also an exponential moving average of a market price but with a longer period. Signal SMA Period - MACD SMA. This is a signal line which is
FREE

Combined indicators, based on moving averages and price momentum, help you to know when to break out your profit timely. It lets you to ride on major trend as long as possible but knowing when to break out smart and timely. The indicator displays major trend, volatile, reversal signals and last lowest and highest price. It's status updated on top right of your chart keeps you informed about pip-changes involved.
Parameters: FAST Period
Period of the fast moving average
SLOW Period
Period of th
FREE
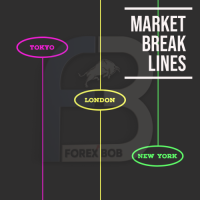
Market Break Lines is an utility tool to create a partition line at market openings/closings of Tokyo/London/NewYork sessions. This will help you to compare the market movements, volatility variations between the different markets.
Inputs: Inputs are simple to feed the time of Tokyo/London/NewYork sessions as per your broker server time Change Color and width of partition lines You can enable or disable any line (Hide/Show).
Please don't forget to support by giving handsome reviews/rating MT5
FREE

Concept
Market arranges in Time upcoming Phases according to the present Results of its Interest. Directing Modulations are an Interaction of immanent Periods, which show in Reference to Time cyclic Activity and to Price leveling Activity. PointZero is a projecting Price Mask of this Concept of Time and Price and categorizing developed Price Movements related to their own Range: how far moved ? indicating their Status by marking special Events: when which Action ? setting the Situation in a fun
FREE

The Master Trend Analyzer is a powerful and flexible MetaTrader 4 (MT4) indicator designed to help traders analyze trends across multiple timeframes simultaneously. By combining multiple Moving Averages (MAs) from different timeframes into one chart, this tool provides a clear and comprehensive view of market trends, making it easier to identify key support/resistance levels, confirm trends, and make informed trading decisions. Advantages of Multi-Timeframe MA Master Multi-Timeframe Analysis
FREE

이것은 반자동 EA이며 어떤 유형의 지표도 사용하지 않으며 매개 변수는 간단합니다.
마스터 주문 (차트 매수 또는 매도에 업로드 한 첫 번째 주문)을 포함하며 헤징을 위해 두 개의 반대 주문을 사용할 수 있습니다.
마스터 주문 : 초기 주문이라고합니다 (SL에 도달하면 EA는 차트에서 다시 시작할 때까지 거래를 중지합니다).
첫 번째 리버스 주문: 원하는 핍 거리에서 마스터 주문과 반대로 열립니다.
두 번째 리버스 주문 : 원하는 핍 거리에서 첫 번째 리버스 주문과 반대로 열립니다.
매개변수 :
마스터 거래 방향 - (초기 주문의 방향, 롱 또는 숏)
로트 크기 - (이 EA가 제어 할 수있는 세 가지 주문 중 하나에서 다른 로트 크기를 사용할 수 있습니다.)
마스터 반대 방향으로 이동하여 핍 단위로 반전 거래 시작 - (첫 번째 반전 주문이 열릴 핍 거리)
2차 반전 시작을 위해 반전 반대 방향으로 이동 - (1차 반전 주문
FREE

Having trouble marking where the various forex sessions start and end? Or perhaps your strategy requires you trade only in a specific session, then this is for you.
The session indicator shades the session you require in a certain color so that you can identify it easily. The sessions shown include: London session, New York session, Asian Session, Asian - London overlap and London - New York Overlap.
Difference source give varying time ranges for the various session, mostly differing by not mo
FREE

Works on the current TF. Considers MA 2, 14, 30, 120 and 480. The growth rate of the fall, the difference between 2-14, 14-30, 30-120 and 120-480.
In this EA implemented the calculation of the maximum profit, and closing depending on the price, if the maximum profit to 200 points, then do not consider anything, if from 200 to 300, then close if the price is lower by 1.1 times than the maximum profit (the price falls by 10% ), if from 300 to 1500 then close if the price falls below 1.5 times t
FREE

MT4 VERSION:
Este robô foi desenvolvido especificamente para EURUSD , um dos pares mais líquidos do mercado, e opera em timeframes maiores (H4, D1) . Sua estratégia é baseada na tendência do mercado , utilizando indicadores como Médias Móveis, ATR e Momentum para determinar os momentos certos de entrada e saída. O Robot Factory EURUSD H4 evita operações desnecessárias e ruído do mercado , focando apenas em trades de alta probabilidade . Ele combina análise técnica com volatilidade controlada ,
FREE

Trade Ride is a forex bot specifically crafted to execute buy and sell orders for financial assets at predetermined prices. It operates based on the martingale strategy and integrates diverse risk management techniques to deliver optimal outcomes to its clients. However, achieving profitability with this bot requires individual traders to possess ample expertise. Adherence to the following critical rules is essential: 1. Trade with a minimum of $10,000 or utilize a micro (cent) account. 2. Veri
FREE

EA Protrader Pivot is a automate and semi-automate Expert Advisor based on candlestick charts. Each order set stop loss with 200points and take profit 250 points. If one of two orders reach stop loss the new order open with new lot size (start lot is 0.01 and max lot is 0.08 ). This EA was backtested with XAUUSD in time frame M15 and spread 20 point. Automate - EA open buy and sell orders based on levels of candlestick chart with the first volume is 0.01 if this order touch stop loss EA cont
FREE
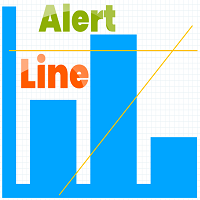
Indicator Rua Alert Line. This indicator will notify when the High-price of candle breaks any TrendLine or HorizontalLine on the chart. Notifications will be sent to the phone and on MT4. And it have ArrowBuy/ArrowSell on chart. It is very useful for those of you who use the TrendLine or HorizontalLine but do not have time to observe the chart. Timeframe M1 to W1 Symbol: All
FREE

Investment Castle Volatility Index has the following features: 1. This indicator shows the volumes of the current symbol and the market volatility. 2. This indicator is built-in in the Investment Castle EA which works as volatility index for the EA dynamic distance and opposite start. 3. Parameters available for optimization for each pairs. 4. Works with any chart.
FREE

The three white soldiers and the three black crows candlestick patterns are reversal patterns that predict a change in the direction of a trend. The pattern consists of three consecutive long-bodied candlesticks that open within the previous candle's real body and a close that exceeds the previous candle's. It's important to note that both formations are only valid when they appear after a strong uptrend or a downtrend, while their efficiency decreases in choppy markets.
Inputs AlertOn - en
FREE
The Swap Detector is an essential MQL4 utility that displays the swap costs of any instrument when applied to a chart. It helps traders make informed decisions by visually indicating the swap value in customizable colors— green for positive (good) and red for negative (bad) by default. This tool ensures transparency in overnight holding costs, enabling better trade planning and risk management
FREE

Buy with a discount of 75% for the unlimited licence the FOTSI! Offer valid from 01/04/2025 to 10/04/2025! Hurry Up & Rate the indicator!
FOTSI (Forex Overview True Strength Index) for MT4 FOTSI is an indicator that analyzes the relative strength of currencies in major Forex pairs. It aims to anticipate corrections in currency pairs following strong trends by identifying potential entry signals through overbought and oversold target areas. Theoretical Logic of Construction: Calculation of Indi

Trader Family EA use multiple custom indicators to determine entry orders and exits. Every order uses a pending order and always uses a take profit and stop loss with a risk reward of 1:1.5, everything is calculated automatically. This EA is suitable for beginners and advanced traders, this EA can be customized according to the risk profile of the trader himself. Requirements and Recommendations Trader Family EA specifically for the USDJPY pair on the H1 timeframe. ( will be optimized for other
FREE

Precise trend following strategies
- Forex Miner EA is based on Strong current Trend.
- Built with a mixture of many Trending indicators to get best Results on daily basis.
- As statistics say 95% Traders in this market, unfortunately, lose their hard earned money and the key factor is bad money management taking small profits and huge losses Our Robot is designed to follow the strong current trend so risk is at minimum side and Profits coming out are Big Green Pips.
Highly Advanced Algorithm

This indicator is the translated version of Kıvanç ÖZBİLGİÇ's PMAX Indicator, developed on the Matriks Data Terminal, into the MQL4 language. It is a trend-following indicator and quite successful. Its usage will be free and unlimited for a lifetime. You can click on my profile to access the MQL5 version of this indicator. You can also get your programming requests for MQL4 and MQL5 languages done at İpek Bilgisayar with an invoiced service. You can reach İpek Bilgisayar at www.ipekbilgisayar.or
FREE

Identification of support and resistance areas
A useful indicator for traders
completely free
Can be used in all symbols
Can be used in all time frames
It has three different trends: short term, medium term, long term
Settings:
Clr1,2: You can change the color of the lines
Type Trend: You can determine the trend
Message me for questions, criticism and suggestions
FREE

An “inside bar” pattern is a two-bar price action trading strategy in which the inside bar is smaller and within the high to low range of the prior bar, i.e. the high is lower than the previous bar’s high, and the low is higher than the previous bar’s low. Its relative position can be at the top, the middle or the bottom of the prior bar.
The prior bar, the bar before the inside bar, is often referred to as the “mother bar”. You will sometimes see an inside bar referred to as an “ib” and its m
FREE
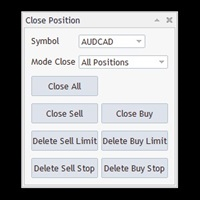
Free until the end of the year.
Close All With Just One Click MT5: https://www.mql5.com/en/market/product/110006 Close orders with just one click, quickly and neatly. Supported order types: Market order, limit order, stop order
Note: This software is very fast, there is no warning every time you press the button, please use caution when using, or use it proficiently in a demo account first, I am not responsible for any loss caused by the software being activated. misactivated
FREE

FuturePriceM15 - один из немногих индикаторов, который делает прогноз цены прямо на ценовом графике. Алгоритм расчета индикатора основан на быстром преобразовании Фурье. Имея колебательное поведение цены, функция Фурье прогнозирует ее поведение в дальнейшем. Индикатор устанавливается обычным образом на график с торговым инструментом указанным в переменной symbol с периодом M15 , данный временной период является самым оптимальным для работы с любыми торговыми символами. После установки, индикато
FREE

Suitable for multi time frame market direction prediction. Green and red color indicate the buy and sell call respectively. Green indicator is denote buy call and Red indicator denote the sell call. push notification is available to send instant message to you when green or red indicator will be appear. you have to activate the option at the time of mapping this indicator to you chart
FREE

The Fibonacci indicator automatically displays the Fibonacci retracement levels, representing significant support and resistance. The range for calculating the indicator can be taken from the previous day, week, month, year or user-specified session.
Levels 100 % (High) of the range from the previous session. 0 % (Low) of the range from the previous session. 76,4 % of the range from the previous session. 61,8 % of the range from the previous session. 50 % of the range from the previou
FREE
The Complex Chaos EA is an automated system that uses a pair of exponential moving averages to detect the market direction and opens trades on candle open. If the market moves against a trade it will at a set distance open another trade in the same direction to move the take profit of the group of open positions closer to the current price and make the group of trades winners overall once the price reverses. If a change in direction is detected then all trades are closed and it starts trading in
FREE
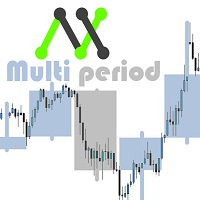
With this customizable indicator you will be able to observe other timeframes besides the usual one. This way you will get to know better the general environment in which the price moves and probably will be better your effectiveness. *It is important that the timeframe in the indicator is greater than that set in Metatrader. I'll share more indicators for free soon. If you have any specific ideas of an indicator that you want to have you can write me a private message directly. Opinions, review
FREE

Odie Trade Manager EA is a simple semi-automatic (two in one) assistant for a manual trader, when having a losing trade the EA begins its work in the form of a martingale or hedging (recovery zone) to leave it in breakeven or positive, it depends on its configuration.
For professional traders and gamblers .
Adapt it to your strategy, MANAGE YOUR RISK CORRECTLY and all your operations will be positive.
TEST ON STRATEGY TESTER WITH YOU STRATEGY AND CREATE YOUR SET FILE AND... GOODBYE LOSSES.
FREE

The FxSProMT indicator shows the current market trend and trend change.
Indicator Parameters Ind_Period - the number of previous bars used to calculate actual values. Number_Bars - the number of bars to display the indicator.. Too many bars may significantly slow down the operation of the trading terminal. Signal_Sound - sound alert to notify of trend change. The sound can be played multiple times until the signal is confirmed (the bar closes). Default is disabled. Signal_Alert - an alert to no
FREE
This indicator for MT4 automatically draws support and resistance levels based on fractals, highlighting key areas of the market where the price could reverse or slow down. Fractals are graphical structures that identify significant highs and lows, thus forming a dynamic system of support and resistance levels. The indicator allows you to visualize these levels directly on the chart, facilitating technical analysis and identifying potential entry or exit points in the market. It is an ideal too
FREE

Simple setting Attach Magic SL TP Trailing to single fresh chart and to manage all orders please set SL TP 0 for other Expert advisor .
This is Free, if you found this useful please give feedback and 5 STAR (if you need more function on this please feel free do DM)
Chart Selection :- if select all chart then EA will manage all chart or if select single chart then EA will manage current chart only
Choose Trailing Method :- you can select trailing method how you want to trail
Choose SL & TP M
FREE

"Drivers Road Bands" indicator that is designed to be used in the 1H, 4H and 1D timeframes in the most ideal way. If we compare timeframes to roads and streets; main streets and highways with high traffic volume are similar to high-time timeframes in technical analysis. If you can interpret the curvilinear and linear lines drawn by this indicator on the graphic screen with your geometric perspective and develop your own buy and sell strategies; you may have the key to being a successful trader.
FREE

AdvaneZigZag Indicator
Are you tired of the limitations of the traditional ZigZag indicator? Meet AdvaneZigZag, the ultimate tool to simplify your market structure analysis and enhance your trading strategies. Designed with flexibility and precision in mind, AdvaneZigZag brings you advanced features to navigate the market with confidence.
Key Features:
1. Enhanced Flexibility:
- While maintaining the familiar simplicity of the conventional ZigZag indicator, AdvaneZigZag offers superior a
FREE
EA245 Draw Supply Demand v1 This EA only good for draw Supply and Demand, you can use draw with two Time Frame input (True/False). Manual Traders can use as tool for support and monitor the price near Supply and Demand before excute to open Buy or Sell orders Note: The result of Auto Trading normaly not good, so please consider select True or False open Order (item [11]). This EA for free so you can use and share for your friends. If you have any question, please contact our gruop via informatio
FREE

RaysFX Trade Info Ciao a tutti, sono entusiasta di presentarvi il nostro ultimo indicatore, RaysFX Trade Info . Questo strumento è stato progettato per fornire informazioni dettagliate sulle vostre operazioni di trading direttamente sul vostro grafico MT4. Caratteristiche principali Informazioni in tempo reale : RaysFX Trade Info fornisce informazioni in tempo reale sulle vostre operazioni aperte e chiuse. Potete vedere il profitto in punti, in valuta e in percentuale. Personalizzabile : L’in
FREE

Fractals ST Patterns is a modification of Bill Williams' Fractals indicator. Unlike a standard Fractals indicator, Fractals ST Patterns allows setting any number of bars to find a fractal. This simple indicator corresponds to the parameters specified in the ST Patterns Strategy ( https://stpatterns.com/ ) . Structural Target patterns are the market itself, which is consistently divided into components. For the formation of ST Patterns , no trend lines, geometric proportions of the model itself,
FREE

This indicator is based on Zigzag. It shows the HH, HL, LL, LH counts. This helps in finding ongoing trends. Or ranges:
Features: Show symbols for: Higher-Highs, Higher-Lows Lower-Lows, Lower-Highs And show counter for each Non-repainting option Customize Color and horizontal/vertical labels Corresponding scanner dashboard: https://www.mql5.com/en/market/product/85346
Symbols Described: HH = Higher-Highs (Current price high is more than previous high) HL = Higher-Lows (Current price low is mo
FREE
DMI Show High Low: Visualize Key Market Levels in Real Time 100% free, functional, and without limitations! The DMI Show High Low is an essential tool for traders, designed to display High, Low, and Close levels of a selected timeframe directly on your chart. Ideal for identifying key market zones, this indicator helps enhance your decision-making and trading precision. Parameters: Timeframe: Select the timeframe for displaying High, Low, and Close levels. Default: D1 (Daily) Display Close Line:
FREE
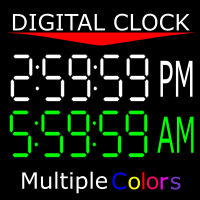
Shows you the time of the server you're on as well as the current time of the time zone you're in. 12-hour clock format (12:00:00 am to 11:59:59 pm) Charts from 1-5 mins are in hour:min:sec format Charts from 15 mins to 1 month are in hour:min format" You can also change the color of the clock to any color MT4 offers. If there is anything you would like me to add ask. As long as it isn't extensive, I might add it.
FREE

Balanced Entry by VArmadA A simple yet powerful fractal based Support/Resistance Indicator
Works with timeframes 1H and higher and tested on all major pairs. Pay attention to the signal: An arrow indicating a long or short entry.
How It Works:
Arrows indicate reversed support/resistence. Up arrow means long - down arrown indicates a short trade.
Instructions: - IndicatorLong/IndicatorShort: Choose the colors for the given indicator arrows - Show Resistence Levels: Visualize the resistence l
FREE

Free indicator, that displays the remaining time until the current candle closes directly on the chart. Designed for traders who demand precision and timing, this lightweight and fully customizable tool enhances your trading experience. It is easy to install, compatible with all assets, markets, and timeframes, and provides real-time updates to support smarter decision-making.
FREE

Average Price Plus is an essential indicator for day-to-day operations. With it, you can graphically check the average price between several open orders on your chart. The average price is the breakeven point between your orders. In addition to the average price, the indicator also shows you the number of pips and the financial value resulting from your open orders, the percentage gains, the number of lots in operation and the number of open orders. Negative values in "pips" or in financial val
FREE

Search for an entry with low risk for trading by Lisek Waves Indicator. Using Lisek Waves Indicator can improve your trading performance. In it’s simplest form, this trading tool make it easy to s earch for an entry with low risk and to manage your trade and risk. Lisek Wave analysis is based on the notion that markets follow specific patterns called waves which are the result of a natural rhythm of crowd psychology that exists in all markets. You can avoid the loss from taking trades that are
FREE
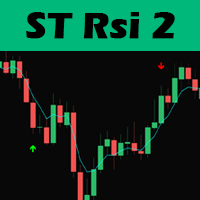
Hello traders, this trading strategy is based on the the Larry Connors RSI-2 strategy, We begin with a 200 periods EMA to find the direction of the market. This is important because we only trade in the main trend direction.
We then look for pull backs using the RSI with a period of 2 to get entry signals. Trades are then exited using the 5 EMA.
Lot size should be calculated using 1% of 1 the ATR value and positions can be added as long as the entry criterion is met.
TRADING IS RISKY AND I D
FREE

As a Thanks to the Trading Community ZenKen Trading will be releasing all Classic Indicators as EAs.
The First to be created is In-Depth RSI Auto Trader.
The user can choose to trade classic over bought and over sold levels or they can change to trading the 50 line cross.
The user can also decide if they want the over bought and oversold levels to close trades for them.
User has several safety features to select from to help protect from high spreads, bad trade hours, and losses.
I will be
FREE

A simple but useful indicator for controlling volatility in intraday trading.
The indicator plots the average volatility (ATR) levels for the specified number of days on the current chart.
On the current trading day, the levels are dynamic and move depending on the minimum and maximum prices of the current day in "real time" mode.
In the input parameters we specify:
- the number of days to calculate and draw the ATR levels
- color of the ATP level lines
- the thickness of the ATR level li
FREE

Trend is Friends is an line Indicator used as an assistant tool for your trading strategy. The indicator analyzes the standard deviation of bar close for a given period and generates a buy or sell trend if the deviation increases. It good to combo with Martingale EA to follow Trend and Sellect Buy Only/Sell Only for EA work Semi-Automatic. You can use this Indicator with any EAs in my Products.
FREE
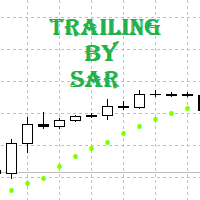
Tracking positions using trailing on the Parabolic SAR indicator. It is necessary to allow automated trading in the terminal settings. In testing mode, the utility opens Buy or Sell positions on the first ticks, which allows you to visually observe the given logic, changing the utility parameters. In real mode, the utility does not open positions. Parameters magic - magic number. If less than 0, positions with any magic number are tracked. only_this_symbol - only chart symbol. If false , posi
FREE

Footmarks Pro Footmarks Pro is a MetaTrader 4 Essential Indicator that create round number or sweetspot on chart with "Button". Parameter Indicator Name - Footmarks Pro Pair Selection - 250 points / 500 points / 1000 points Sweetspot Setting Sweetspot Line Color Sweetspot Line Style Sweetspot Line Thickness Sweetspot Button Setting Button Axis-X Button Axis-Y Thanks...
FREE
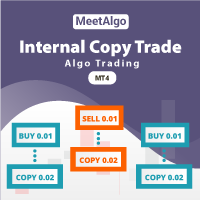
The MeetAlgo internal copy trade EA is capable of copying your trade in the same account the same terminal. It is very useful if you have hired the website mql5.com signal to earn investment profits, the lot size on the MT4 software received from the primary signal will be limited to reduce the risk. It is because the lot size is very significant; the investment profits will, in turn, be tiny. The tool is used to increase the size of the order. This tool is set to duplicate the order from the in

Summary This indicator is based on RSI and Momentum indicators. It also considers moving averages of these two indicators. The three indicators have adjustable settings. The arrows do not repaint since the indicator only uses confirmed values and waits for the candle to close before painting an arrow. The indicator is also able to alert when arrows appear. There are 3 types of alerts - Popup, Email and Mobile Push Notifications. The arrows can be used in the EA and the inputs can also be optimiz
FREE
MetaTrader 마켓은 과거 데이터를 이용한 테스트 및 최적화를 위해 무료 데모 거래 로봇을 다운로드할 수 있는 유일한 스토어입니다.
어플리케이션의 개요와 다른 고객의 리뷰를 읽어보시고 터미널에 바로 다운로드하신 다음 구매 전 트레이딩 로봇을 테스트해보시기 바랍니다. 오직 MetaTrader 마켓에서만 무료로 애플리케이션을 테스트할 수 있습니다.
트레이딩 기회를 놓치고 있어요:
- 무료 트레이딩 앱
- 복사용 8,000 이상의 시그널
- 금융 시장 개척을 위한 경제 뉴스
등록
로그인
계정이 없으시면, 가입하십시오
MQL5.com 웹사이트에 로그인을 하기 위해 쿠키를 허용하십시오.
브라우저에서 필요한 설정을 활성화하시지 않으면, 로그인할 수 없습니다.