MetaTrader 4용 Expert Advisor 및 지표 - 43

Awesome MACD Indicator is a powerful trading tool that combines the strengths of Moving Average (MA) and Moving Average Convergence Divergence (MACD) to provide accurate and reliable trading signals. Designed for forex and stock traders, this indicator simplifies the identification of trading opportunities by detecting significant crosses in price movements. Key Features: MA and MACD Combination: Awesome MACD leverages the power of Moving Averages (MA) to identify short-term and long-term trends
FREE
This EA is based on the supertrend indicator signal.
The indicator line is divided into two colors, orange for short and green for long.
Parameter setting:
External double LotSize = 0.01; / / number of hands
External int magic = 20201114; / / magic, which mainly distinguishes the order difference from other EA, and generally does not need to be concerned
External int SL = 300; / / stop loss
External int TP = 500; / / stop profit
External int period = 10; / / indicator perio

It is a fully automated trading Expert Advisor, whose algorithm is based on trading using pending orders at the high and low of the daily working channel. StopLoss and TakeProfit are set manually by the trader, which provides ample opportunities for Expert Advisor optimization. When the UseTrall function is enabled, the EA only uses TakeProfit without setting a fixed StopLoss level. Upon reaching the specified profit target level, the EA sets StopLoss at the specified NoLossLevel distance from t
FREE

Please check the " What's new " tab regularly for a complete and up-to-date list of all improvements + parameters. FREE indicator for my trading utility Take a Break . This indicator allows you to manage multiple other EAs with just one Take a Break EA instance. Simply specify the corresponding Chart Group in the indicator(s) and Take a Break EA settings and you are good to go.
Setup examples (Indicator + EA)
As a prerequisite, add the URL https://trading.custom-solutions.it to the list of
FREE

FREE UNLIMITED PM : https://linktr.ee/ARFXAUTOTRADE?utm_source=linktree_admin_share
Bagaimana Cara membaca market melalui FMCBR-W - Didalam dunia trading ini pelbagai cara digunakan oleh trader dan penganalisa market membaca dan memahami trend. - Dari sudut FMCBR permulaan trend atau permulaan pullback dikenali melalui CB1. Apa pun dari sudut FMCBR-W trend didefinasikan melalui 3 combinasi yang saya akan kupas di muka surat seterusnya nanti. - Saya amat berharap agar pengunaan FMCBR-W nanti
FREE

Synchronize objects from one chart to multiple charts. Synchronize objects from one chart to multiple charts. 1. Allows automatic synchronization of new and edited objects to other charts. 2. Allows synchronization of all objects on the chart to other charts at the current time. 3. Allows setting the charts to synchronize based on the position of the chart in the MT4 window. Version 1.2: Allow set list of object names that you don't want to sync (Separated by commas ",")
Allow set 5 types of
FREE

Have you ever wondered which currency is the strongest at any particular time? Or which currency pair is trending the most. Well, the currency strength meter helps with just that. It compares USD , EUR , AUD , CHF , GBP , CAD and NZD depending on the timeline you have chosen in settings, and ranks them on the number of pips each has moved compared to the rest. N/B: All currency charts of the above pairs must have loaded. You can do this by highlighting all major and minor currencies
FREE

Genaral: Not martingale, not a grid; Use on EURUSD Use on M5
Signals: There is a good rational algorithm. Work of two indicators: 2 DeMarker (from 2 timeframes) (you can set a separate Timeframe for each indicator)
Stop Loss/Take Profit: There is a good money management system (there are several type for trailing stop loss); There is virtual levels of Stop Loss / Take Profit; There is smart lot (percent by risk) or fix lot
Important: EA can work on closed candles, and on current candl
FREE
Highly configurable Accumulation and Distribution (AD) indicator. Features: Highly customizable alert functions (at levels, crosses, direction changes via email, push, sound, popup) Multi timeframe ability Color customization (at levels, crosses, direction changes) Linear interpolation and histogram mode options Works on strategy tester in multi timeframe mode (at weekend without ticks also) Adjustable Levels Parameters:
Ad Timeframe: You can set the lower/higher timeframes for Ad. Ad Bar Shi
FREE

This indicator helps you to scan all symbols which are in the Market Watch window and filter out a trend with alerts. It works on five most effective indicators which are used by most of traders for trading: Moving Average Average Directional Moment (ADX) Relative Strength Index (RSI) Parabolic SAR MACD It calculates two bars for scanning. When box colour changes to coral or royal blue colour, it indicates you for trend change for long and short entry. And also you will get alert on screen. When
FREE
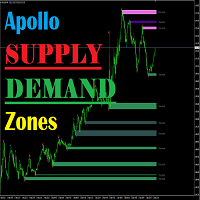
Apollo 공급 수요 구역은 지지와 저항 수준을 계산하는 지표입니다. 지표는 사용하는 전략에 관계없이 절대적으로 모든 거래자에게 유용합니다. 이 지표는 거래 시스템의 주요 요소 중 하나가 될 수 있습니다. 표시기는 현재 시간 프레임의 레벨을 모두 계산하고 MTF 모드에서 작동하여 더 높은 시간 프레임의 레벨을 표시합니다. 이 지표는 모든 시간 프레임 및 모든 거래 수단에 절대적으로 사용할 수 있습니다. 표시기는 다양한 유형의 수준을 보여주며 실제로 시장의 그림을 표시합니다. 표시기는 소리 경고를 제공하므로 이 표시기로 작업하는 것이 매우 편리합니다. 구매 후 반드시 저에게 편지를 써주세요! 지표 사용에 대한 권장 사항을 알려 드리겠습니다. 당신을 기다리고있는 큰 보너스도 있습니다! 성공적인 거래를 기원합니다!

You've probably heard about the Dow trend Theory, where higher highs and lows indicate an uptrend, and lower highs and lows indicate a downtrend. This indicator determines this trend based on the Dow Theory. You just need to enter a number representing the number of candles between extremes. The optimal solution is the number 3, unless you want to have the trend from M5 but you're on M1, then you need to multiply this number by 5. Check various combinations to trade with the trend. In the scree
FREE
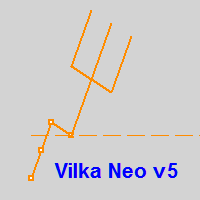
Вилка Нео v5, разрабатывалась для торговой системы "Оракул", но постепенно дополнялась, например - углами Ганна и другими опциями...
Можно создавать графические объекты с заданным цветом, стилем и толщиной, такие как: прямоугольники с заливкой и без, отрезки трендлиний и нестандартный инструмент - "вилка Нео" в виде трезубца, так же есть возможность интерактивно настраивать цветовую палитру прямо с графика, настраивать видимость объектов для разных ТФ, толщину и стили... Панель переключается кл
FREE

Sync Cursor MT4 Sync Cursor MT5 https://www.mql5.com/en/market/product/118259 MT4 Tool will It make the Horizontal Line + Vertical Line in the Screen That it is always present on the screen and that it moves along with the candle (with the price). I am sure that something so simple will be a Treasure in the hands of many people. Some of my personal trades are posted voluntary and free of charge in this Public channel https://t.me/FXScalpingPro Contact: https://t.me/TuanNguyenTrader
FREE

The "M1 scalping signal" is a scalping indicator designed for the M1 timeframe. The indicator displays arrows on the chart indicating price reversal points. A red arrow indicates a price reversal to a sell position, while a green arrow indicates a price reversal to a buy position. It can be used on all currency pairs. Advantages: No Redrawing: The indicator does not redraw signals on historical data, ensuring stable analysis. Ease of Use: It is easy to configure and visualizes important reversal
This indicator copies graphical objects (vertical lines, horizontal lines, text labels, fibo and etc.) from master chart to other charts.
For example, you can copy lines from the chart GBPUSD with period H1 to chart GBPUSD with period M15. It's makes technical analyses more simple. Show label - show label on the Master chart, where you draw graphical objects to copy; Font size - font size of label; Type of synchronisation - type of synchronisation Copy text - on/off copy of text objects
Copy
FREE
Trend Chart Histogram is an indicator based on an algorithm using two moving averages and several oscillators. Thanks to its color code, it allows you to quickly identify the trend and take advantage of the biggest market impulses. Light colors indicate the trend, dark colors define impulses and gray indicates that you should not enter the market. It will be a very good ally in your decision-making, combined with your other indicators.
MT5 version here.
Input parameters: - Period 1 (fast per

There are time periods in the market, when trading is highly likely to be unprofitable. This indicator warns you about such non-trading situations and helps you preserve your money and time.
Parameters Remind about non-trading periods: Expiration week - remind about the expiration week Consumer index day - remind a day before the release of Consumer index day NON FARM - remind a day before the release of NON FARM Christmas - remind a day before Christmas New Year Days 25.12 - 15.01 - remind ab
FREE

I have designed a logic based on the widely used RSI indicator in Forex trading. Normally, it is well known that entering trades when the RSI value is overbought or oversold is effective, but it is not very effective when the trend reverses. Therefore, as a countermeasure, this EA (Expert Advisor) enters counter-trend trades after entering based on the RSI value. In other words, it uses a grid order strategy, but instead of placing orders at fixed intervals, it places additional sell orders when
FREE

Super Buy Sell is a combination of Hedging and Martingale strategy. Buy and Sell at the same time and open order every 20 pips (default setting) with customized Target Profit. It was backtested and optimized using real ticks with high quality. The Expert Advisor has successfully passed the stress test with slippage approximate to the real market conditions. This EA can run on several instruments simultaneously. This EA is recommended for cent accounts.
Real account monitoring https://www.mql5
FREE

Investment Castle Indicator has the following features: 1. Dictates the direction of the trend in different Timeframes . 2. Shows the hit rate and winning rate on the chart. 3. This indicator does not repaint the chart. 4. This indicator is built-in the Support & Resistance based Investment Castle EA which works with Psychological Key Levels "Support & Resistance" Indicator.
FREE

The MP Andean Oscillator is used to estimate the direction and also the degree of variations of trends. It contains 3 components: Bull component, Bear component and Signal component. A rising Bull component indicates that the market is up-trending while a rising Bear component indicates the presence of down-trending market. Settings: Oscillator period: Specifies the importance of the trends degree of variations measured by the indicator. Signal line per: Moving average period of the Signal line
FREE

Multicurrency and multitimeframe indicator of the Standard Deviation Channel. Displays the current direction of the market. On the panel, you can see breakouts and touches (by price) of the levels of the linear regression channel. In the parameters, you can specify any desired currencies and timeframes. Also, the indicator can send notifications when levels are touched. By clicking on a cell, this symbol and period will be opened. This is MTF Scanner. The key to hide the dashboard from the char

Introduction to Order Risk Management EA ORM EA is specially designed for fast and accurate market order execution to be used with our Price Action and Econometric Trading strategies listed below. ORM EA is fully automatic and ORM EA is also very easy to use. ORM EA is totally free of charge. You can also use this robust order execution feature of this ORM EA for any other your own trading strategy.
Trading Strategy Guide Order Risk Management EA provides the guide for the risk management for
FREE

Nermal Round Levels is an indicator of round numbers in the form of a grid drawing horizontal lines. You can use it in many ways ... as it could be activating for an expert advisor to enter the market, confirmation of entry for your strategy, entrance area, mark areas of important levels, possible rebounds and others. Place it in your chart and verify as the price respects those round levels.
Inputs GridSpace linecolor lineStyle
FREE

Fractal is one of the main indicators in a number of strategies. Volume Fractals has expanded the functionality of the standard indicator version. The product features fractals sorting and displaying fractals representing both price and volume extreme points.
Application Stop losses Reversal signals Placing pending orders for a fractal breakout
Options Bars of history - number of chart bars the indicator is displayed for Left side minimum bars - minimum number of bars to the left of the frac
FREE

It is a utility (Expert Advisors) that you can easily tweet from MetaTrader Support for "Twitter API v2 OAuth 2.0 with PKCE".
Just add a few lines of code to the Indicator , EA or Script you create TweetHelper will tweet a message for you.
Preparation: Please apply for a developer account to access the Twitter API. Please refer to the following for setting details and procedures.
Example of code (script) for using TweetHelper https://www.mql5.com/ja/code/30967
MetaTrader settin

Features: Find these engulfing patterns: Simple Engulf Stick Sandwich Engulf Three Line Strike Rising Three Morning Star Doji Scanner is useful to make your strategy better. Don't always go by Win/Loss percentage. Because this tool is not based on past results. Basic Settings: For All Patterns You can set: First:Last Candle Ratio This will make sure that the earlier opposite candle is at least this given ratio in height as compared to the engulfing candle. This is not checked for Three Line Stri
FREE

SkalpAUDNZD is a highly accurate and reliable advisor for trading the AUDNZD currency pair( time frame М5) . The advisor does not have dangerous technologies such as martingay, grids and averaging and is therefore safe for a trading account. Orders are closed using a signal or take profit and stop loss; the advisor forcibly closes orders on the opening day. The advisor opens only one order at a time and all orders are protected by a fixed Stop Loss. The advisor is easy to use, as it has few para
FREE

Take your investments to the professional level with Auto Grid Investor, this expert will place a set of coordinated orders every certain amount of points, taking advantage of the price oscillations, regardless of the direction taken, once the market has changed it's behaviour; Auto Grid Investor also will change the investment parameters on all the orders, managing automatically many more orders than you could control manually. Don't waste time finding out the optimal parameters for the c
FREE

IceFX Heatmap is a special indicator that shows the places where the price has been staying and ranging over the past few days. These sites will be displayed in a "Heatmap style", with which you can clearly see the main formed bands. The main rates (where the price has "lingered/stayed" much) are indicated in bright colors (in case of black-and-white view) or red color (in case of color view).
Settings Days - the number of days the heat(map) is calculated for. Resolution - resolution rate. 10
FREE

FCK Gold Killer Ea is a fully automated trading system that trades on the pairs XAUUSD, US500 on M1 Time Frame. FCK Gold Killer Ea uses an Advanced-Smart Breakout System for Scalping analyses the market conditions. This unique feature allows It’s pure Price Action trading, mean reversal system that utilizes peakedness of market distribution to identify trend reversals safely. This Scalping EA uses a unique trading system that combines sophisticated automated trading with user dis

BuySell Volume is an indicator that approximates Buy and Sell volumes based on price movement. Input Description: applied_model: Choose the applied model. In low reversal mode, price is considered receive low bearish pressure during bullish candle's creation (high bearish pressure on high reversal model. In other words, Bullish Marubozu candles has really high Buy Volumes in low reversal model than in high reversal one.
Output Description: Buy and Sell Volume: Determines how many Buy and Sell v
FREE

What is crypto trading? A cryptocurrency is a digital (virtual) financial currency, where security of making transactions is provided by using cryptography methods. The concept of the very first digital currency, Bitcoin, was introduced by Satoshi Nakamoto in 2008. Since the moment cryptocurrencies appeared, they have been growing in popularity quickly and at present may be considered as some of the most highly-demanded trading instruments. There are more than 1,500 cryptocurrencies in the worl
추세 지표 각 기간의 추세를 결정하는 고유한 시스템입니다.
모든 표준 시간대에서 모든 통화 쌍의 추세를 실제로 파악할 수 있습니다! 녹색 사각형은 매수 추세이고 빨간색 사각형은 매도 추세입니다.
거래 기술: 작은 시간대가 이전 추세와 반대인 경우 시장 움직임의 관성으로 인해 스크린샷과 같이 이전 시간대에 진입하세요.
이 지표는 수정된 촛대 공식을 사용하여 가격 움직임을 보다 원활하게 표현합니다. 현재 및 이전 기간의 개시, 마감, 최고 및 최저 가격을 평균합니다. 이 변환을 통해 노이즈가 줄어들고 추세를 더 명확하게 볼 수 있습니다. MACD 계산 및 히스토그램을 기반으로 합산 지수 폭 분석과 시각화의 명확성, 추가 추세 정보를 결합한 강력한 지표입니다. 사용자 정의 기능을 통해 다양한 지수와 시장 상황에 맞게 조정할 수 있으며 거래자에게 추세와 모멘텀을 분석하기 위한 포괄적인 도구를 제공합니다.
FREE

FREE
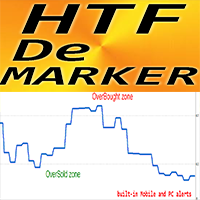
MT4용 외환 표시기 HTF DeMarker
이 지표는 기술 거래자가 진입점과 청산점을 찾는 데 사용하는 유용한 도구입니다. HTF는 더 높은 시간 프레임을 의미합니다. DeMarker 오실레이터 라인은 이전 최고점과 최저점을 기준으로 현재 가격 위치를 나타냅니다. DeMarker는 다른 오실레이터 중에서 가장 효율적인 정규 발산 신호를 제공합니다. OverBought 영역은 DeMarker가 0.7보다 높을 때이고 OverSold 영역은 0.3보다 낮을 때입니다. 표시기에는 모바일 및 PC 알림이 내장되어 있습니다. 이 지표는 가격 조치 항목이 있거나 다른 지표와 결합된 다중 시간 프레임 거래 시스템에 탁월합니다. HTF DeMarker 표시기를 사용하면 더 높은 시간대의 DeMarker를 현재 차트에 연결할 수 있습니다. --> 이는 전문적인 거래 접근 방식입니다.
// 더 훌륭한 전문가 자문 및 지표는 여기에서 확인할 수 있습니다: https://www.mql5.com
BBMAGC BBMAGC is an automatic trading system with a work strategy obtained from famous BBMA indicator combine with advance grid system . This EA use dangerous trading systems like martingale and grid so please understand the risk before using this EA Time Frame: H1 Symbol: best result on EUR/USD, GBPUSD, GBPCAD VPS recommended 4/5 digit broker Min Deposit 1000$ Low spread always better Since you using Grid system, always trade using money that you are willing to lose. When you use an expert a

Succubus is a universal expert Advisor.
Its main advantage is the highest entry accuracy, 90% of transactions and above.
The expert Advisor parameters are divided into categories according to the function that the user needs. All functions can be disabled.
The expert Advisor is designed to disperse small and medium-sized deposits.
Main:
TakeProfit - number of points to close a trade with a profit
StopLoss - number of points to close a trade with a loss
Slippage - Slippage
Magic-
FREE
If you need an advisor on any arrow indicator signals - this utility will definitely help you.
What does the utility do?
It creates a EA file with your indicator signals in a few easy steps: install the indicator with the needed settings on the chart; Select a signal for buy; Select a signal for sell; get the clicker file ! Then you install the file of the EA in the folder Experts and update the terminal. Attention! Set the indicator settings as you need and the same settings will be t
FREE

This indicator is the basis for an Expert Advisor that can be categorized as "almost Grail". See details below. This indicator displays the projection of the Renko chart on the price chart. This projection is displayed as a stepped line, not as "bricks" (rectangles). See slides 1 and 2. Abbreviated name of the indicator: LRC – L ine of R enko on the price C hart. The principle of its construction is very simple. First, a grid of horizontal lines (levels) is bu
FREE

Rung 추세 표시기. 이 표시기는 가격 움직임의 주요 추세를 식별하고 다른 색상으로 표시하는 동시에 주요 추세에 대한 노이즈 및 단기 가격 움직임을 제거하고 반응하지 않습니다. 지표는 시장의 현재 추세를 결정하는 도구입니다. 기본 설정인 상승("강세" 추세)에서 표시기는 녹색 선으로 표시되고 하락 추세("약세") 추세 - 빨간색 선으로 가격이 채널에서 움직일 때 옆으로 또는 평평한 가격 움직임으로 표시 , 표시기가 반응하지 않습니다. 코리더 값이나 횡보 가격 움직임은 지표 설정으로 조정할 수 있습니다.
표시기 설정 설명 제한점 - 복도의 크기(포인트). coefficient_smoother - 평활 계수. 경고 - 사용자 데이터가 포함된 대화 상자를 표시합니다. Text_BUY - 구매 신호에 대한 사용자 정의 텍스트입니다. Text_SELL - 판매 신호에 대한 사용자 정의 텍스트입니다. Send_Mail - 메일 탭의 설정 창에 지정된 주소로 이메일을 보냅니다. 제목 -
FREE

ON THIS LINK YOU CAN FIND NEW VERSION https://www.mql5.com/en/market/product/53022 https://www.mql5.com/en/market/product/53022
/-/-/-/-/- /-/-/-/-/- /-/-/-/-/- /-/-/-/-/- /-/-/-/-/- /-/-/-/-/- /-/-/-/-/- /-/-/-/-/- /-/-/-/-/- /-/-/-/-/- /-/-/-/-/- /-/-/-/-/- /-/-/-/-/- /-/-/-/-/- /-/-/-/-/- /-/-/-/-/- /-/-/-/-/- /-/-/-/-/- /-/-/-/-/- /-/-/-/-/- /-/-/-/-/- /-/-/-/-/- /-/-/-/-/- /-/-/-/-/- /-/-/-/-/- /-/-/-/-/- /-/-/-/-/- /-/-/-/-/- /-/-/-/-/- /-/-/-/-/- /-/-/-/-/- /-/-/-/-/- /-/-/-/-/- /-/
FREE
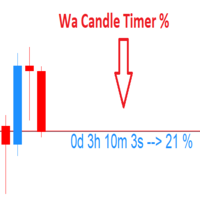
Wa Candle Timer Percentage MT4 is an indicator which shows the user how much time is remaining until the next candle will form. The percentage of the evolution of the current candle is also displayed. The user can set the percentage that the candle timer will change the color. These are the settings: 1- The percentage that the candle timer will change the color. 2- Color of Candle Timer when it's BELOW the percentage set by the user. 3- Color of Candle Timer when it's ABOVE the percentage set b
FREE
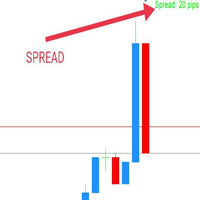
WaSpread MT4 Indicator shows the current spread in pips with color.
* Set the Spread Threshold and the color to identify when the current spread is below or above the Spread Threshold.
* Set X axis and Y axis and chose the Corner and the Anchor to position the Spread Label on the chart.
* Write the font and the font size for more confort.
* Activate alert if the current spread is above the spread threshold.
* For more precision, the user can choose to show the decimal numbers.
* The
FREE

21 simple moving average ( All Type of 21 MA River ) 51 simple moving average
Long Entry Upper 51 MA and above the 21 River Middle channel. Long Only Above Green Line (Market Opening Line) Short entry Below the lower 51 MA and below the 21 lower channel. Short Only Below Green Line (Market Opening Line)
Exit position
Initial stop loss is 20 pips below (for buy) or above (for sell) Target : Next level as per indicator Profit Target ratio 1:1.2
Download Template : https://drive.google.c
FREE

알고리즘은 Currency Power Meter 표시기의 아이디어를 기반으로 합니다. 이 버전에서 표시되는 값의 수는 무제한이며 코드가 더 간결하고 빠르며 현재 막대의 값은 표시기 버퍼를 통해 얻을 수 있습니다. 표시가 보여주는 것 : 얇은 밴드와 통화 앞의 위쪽 숫자는 지난 N시간 동안의 상대 강도 지수를 보여주고(N은 변수 '시간'의 매개변수에서 설정됨), 더 넓은 밴드는 일일 지수를 보여줍니다. 입력 매개변수에서 지정하는 이 통화를 사용하는 통화 쌍이 많을수록(중개인이 쌍에 대한 견적을 제공한다고 가정) 인덱스에 가중치가 더 많이 부여됩니다(그러나 "비주요" 또는 이국적인 통화 쌍에 주의할 수 있습니다. 전체 그림을 왜곡). 예를 들어 EURUSD만 지정하면 유로에 대한 상대 지수는 이 쌍만을 기준으로 계산되고 EURGBP를 추가하면 유로 지수는 두 쌍을 기반으로 계산되어 더 많은 가중치를 얻게 됩니다. 데이터 활용 방법 : 지수 값이 낮거나 높을수록 중요한 뉴스가 없을
FREE
A more advanced trade plotter indicator that also includes some additional information. Fully customizable to fit the desired look of the chart as well as the historical orders. Be sure that all the order history needed to view has been shown in the Account History tab Ensure that the order history is for example 1 week or 1 month when trading on live account
Key Features The indicator has lots of preferences of how you like to see orders on the chart. Each order type has been made customizabl
FREE

CAD/JPY 쌍을 거래하는 데 관심이 있지만 필요한 거래 자본에 대해 걱정하는 사람들을 위해 CAD/JPY 쌍에 맞춘 전문가 조언자(EA)가 있습니다. 최소 $100의 보증금으로 이 EA는 상당한 자본 없이도 CAD/JPY 시장에 참여할 수 있게 합니다. 이 CAD/JPY EA는 H1 시간 프레임에서 작동하며, 모든 브로커 또는 계정 유형과 원활하게 통합됩니다. 고급 기술적 및 기본적 분석 기법을 사용하며 캐리 트레이드 전략에 중점을 두고 석유 시장 역학의 변화에 반응합니다. 실시간 신호: https://www.mql5.com/en/signals/2248084 이 EA에 대하여: - 최소 보증금은 $100 - CAD/JPY 쌍에만 작동합니다; CAD/JPY H1 차트에 연결하고 기본 설정으로 실행하세요 - 모든 브로커 또는 계정 유형과 호환됩니다 - 캐나다와 일본 간의 금리 차이를 활용하는 캐리 트레이드 전략을 사용합니다 - 캐나다 달러가 석유 가격에 민감한 점을 고려하여 석유
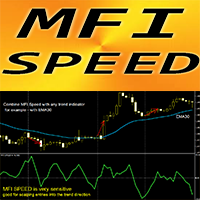
MT4용 외환 지표 "MFI 속도"
이 지표의 계산은 물리학의 방정식을 기반으로 합니다. MFI 속도는 MFI 자체의 첫 번째 파생물입니다. MFI(자금 흐름 지수)는 과매도 및 과매수 영역을 식별하기 위해 가격 및 거래량 데이터를 사용하는 기술 오실레이터입니다. MFI 속도는 모멘텀 진입을 주요 추세 방향으로 끌어들이는 데 좋습니다. 표준 EMA(그림 참조)와 같은 적합한 추세 표시기와 함께 사용하십시오. MFI 속도 표시기는 MFI 자체가 방향을 얼마나 빨리 바꾸는지 보여줍니다. 이는 매우 민감합니다. MFI 속도 표시기의 값이 < 0인 경우: 속도는 음수입니다. MFI 속도 표시기의 값이 > 0인 경우: 속도는 양수입니다. 표시기에는 모바일 및 PC 알림이 내장되어 있습니다.
// 더 훌륭한 전문가 자문 및 지표는 여기에서 확인할 수 있습니다: https://www.mql5.com/en/users/def1380/seller 본 MQL5 홈페이지에서만 제공되는 오리지널

Koala Trading Solution 채널 에 가입하여 MQL5 커뮤니티에서 최신 신호 및 Koala 제품에 대한 소식을 확인하세요. 가입 링크는 아래에 있습니다: https://www.mql5.com/en/channels/koalatradingsolution 설명 :
우리는 외환 시장(PSAR)에서 전문적이고 인기 있는 지표 중 하나를 기반으로 하는 새로운 무료 지표를 도입하게 된 것을 기쁘게 생각합니다. 이 지표는 원래 포물선 SAR 지표에 대한 새로운 수정이며, 프로 SAR 지표에서 점과 가격 차트 사이의 교차를 볼 수 있습니다. 교차는 신호가 아니지만 이동 가능성의 끝을 말하는 것입니다. 새로운 파란색 점으로 매수를 시작하고 첫 번째 파란색 점 앞에 손절매를 1 attr 배치하고 마지막으로 점이 가격 차트를 교차하는 즉시 종료할 수 있습니다.
매수 또는 매도 신호를 여는 방법은 무엇입니까? 첫 번째 파란색 점으로 공개 매수 거래 및 첫 번째 빨간색 점으로 공
FREE

The EU_H1_110155136_S_Bi_CF_SQ3 is an algorithmic trading strategy for MetaTrader, tested on EURUSD using the H1 timeframe from April 1, 2004, to April 24, 2024. There is no need to set up parameters, all settings are already optimized and fine-tuned.
Recommended broker RoboForex because of EET timezone.
You can find the strategy source code for StrategyQuant at the link: http://quantmonitor.net/listing/eurusd-biggest-range-pulse/
Key details are:
Main Chart: Current symbol and time
FREE
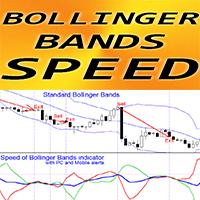
볼린저 밴드의 속도 - 독특한 추세 지표입니다.
이 지표의 계산은 물리학의 방정식을 기반으로 합니다. 속도는 표준 볼린저 밴드의 첫 번째 파생 상품입니다. 볼린저 밴드 속도 표시기는 BB 중간선과 BB 경계선이 방향을 얼마나 빨리 바꾸는지 보여줍니다. 기본적으로 파란색 선은 BB 중간선의 속도, 빨간색 선은 아래쪽 경계선의 속도, 녹색 선은 위쪽 경계선의 속도입니다. 추세 전략에서는 BB 속도를 사용하는 것이 좋습니다. BB 속도 중간선 값이 < 0이면 추세가 하락하고, 값이 > 0이면 추세가 상승합니다. 다음과 같은 거래 항목을 고려할 수 있습니다. 파란색 선이 0 위에 있고 녹색 선이 파란색 선을 위쪽으로 교차할 때 공개 매수 거래 파란색 선이 0 미만이고 빨간색 선이 파란색 선을 아래로 교차할 때 매도 거래 개시 표시기에는 모바일 및 PC 알림이 내장되어 있습니다.
// 더 훌륭한 전문가 자문 및 지표는 여기에서 확인할 수 있습니다: https://www.mql5.co
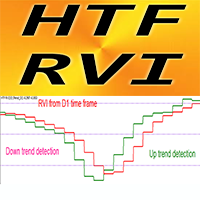
MT4용 Forex Indicator HTF RVI Oscillator, 리페인트 없음
MT4용 전문 HTF RVI Oscillator로 거래 방법을 업그레이드하세요. HTF는 - 더 높은 시간 프레임을 의미합니다. RVI는 과매도/과매수 영역에서 추세 변화 감지 및 진입을 위한 최고의 오실레이터 중 하나입니다. 이 지표는 과매도/과매수 영역에서 가격 액션 진입이 있는 다중 시간 프레임 거래 시스템에 적합합니다. HTF RVI Indicator를 사용하면 더 높은 시간 프레임의 RVI를 현재 차트에 첨부할 수 있습니다 --> 이는 전문적인 거래 접근 방식입니다. 과매도 영역은 0.23 이상입니다. 과매도 영역은 -0.23 미만입니다. 지표에는 모바일 및 PC 알림이 내장되어 있습니다.
// 더 훌륭한 전문가 자문가 및 지표는 여기에서 확인할 수 있습니다. https://www.mql5.com/en/users/def1380/seller 이 MQL5 웹사이트에서만 제공되는 오리

AC Pivot Panel:
AC Pivot Panel is a pivot point indicator including favorite selection panel accessible in the chart. For pivot traders, it is well convenient to easily and quickly can adjust their pivots setting in the chart. To reaching this goal, a panel has been considered to user can easily switch to each pivot levels by different method and time period. In the current version: All pivots including supports and resistance can be selected to display or disappear in the chart just by
FREE

In a departure from the conventional approach, traders can leverage the bearish engulfing candlestick pattern as a buy signal for short-term mean reversion trades. Here's how this alternative strategy unfolds: The bearish engulfing pattern, (typically signaling a reversal of bullish momentum) , is interpreted differently in this context. Instead of viewing it as a precursor to further downward movement, we perceive it as an indication of a potential short-term bounce or mean reversion in prices.
FREE
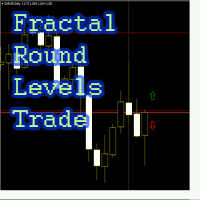
Советник выставляет рыночные ордера, если свеча, на которой появился фрактал, пересекает круглый ценовой уровень, который
используется, как фильтр для входа в рынок по фракталам. Настройки советника: Dig = 2; значение рыночной цены округляется до количества (Dig) знаков после запятой. Пример, рыночная цена на данный момент 1.1228, Dig = 2, цена округляется до 1.1200, если эту цену своими тенями зацепит свеча выбранного графика одновременно с пересечением индикатором RSI на этой свече установле
FREE

| Fully-automated Smart Money Concept (ICT) inspired trading solution with multi-strategy capabilities | Built by a grid trader >> for grid traders. This is MT4 version, click here for Blue CARA MT5 (settings and logics are same in both versions) Real monitoring signal --> Cara Gold Intro Blue CARA EA ('CARA') - short for C omprehensive A lgorithmic R esponsive A dvisor is a next-gen multi-currency multi-timeframe EA base on the widely known (and perhapse most popular) Inn

FTU idioteg i jipyoneun MT4 peullaespom-yong-imyeo dandog-eulo sayonghal su issjiman daleun jipyo ttoneun jeonlyaggwa gyeolhabhaneun geos-i gajang johseubnida. macd, adx deung dayanghan jipyoleul gyeolhabhayeo jin-ib ttoneun chuse byeonhwa jean-eul wihan hwasalpyo geuligi YouTubeeseo jjalb-eun sogae bidioleul sicheonghaseyo: https://youtu.be/lCRJ3mFNyOQ pyosigi gineung: panmae mich gumae hwasalpyo sigag mich cheong-gag gyeong-go chuse jisog / chogi chuse byeonhwa sinho saeloun gineung: gilog ma
FREE

New, more accurate version of the Xmaster indicator. More than 200 traders from around the world have conducted more than 15,000 tests of different combinations of this indicator on their PCs in order to get the most effective and accurate formula. And here we present to you the "Xmaster formula indicator forex no repaint" indicator, which shows accurate signals and does not repaint. This indicator also sends signals to the trader by email and push. With the arrival of each new tick, it constan

This Indicator does not repaint itself at all, it's identifies a new TREND in the bud, this indicator examines the volatility, volumes and momentum to identify the moment in which there is an explosion of one or more of these data and therefore the moment in which prices have strong probability of following a new TREND.
CandleBarColorate never misses a beat, he always identifies a new TREND in the bud without error. This indicator facilitates the reading of charts on METATRADER; on a single wi

O Touch VWAP é um indicador que permite calcular uma Média Ponderada por Volume (VWAP) apenas apertando a tecla 'w' no seu teclado e após clicando no candle do qual deseja realizar o calculo, clicando abaixo do candle é calculada a VWAP baseado na minima dos preços com o volume, clicando sobre o corpo do candle é calculado uma VWAP sobre o preço medio com o volume e clicando acima do candle é calculado uma VWAP baseado na máxima dos preços com o volume, voce tambem tem a opção de remover a VWAP
FREE

---------- A TrendTrading Robot ----------
Hello everyone! I am a professional MQL programmer , Making EAs, Indicators and Trading Tools for my clients all over the world. I build 3-7 programs every week but I seldomly sell any ready-made Robots. Because I am fastidious and good strategy is so few... this EA is the only one so far I think its good enough to be published here.
As we all know, the Ichimoku indicator has become world popular for decades, but still, only few people knows the
This is a SnR tool.
It is built based on the body candle.
It is a multi timeframe indicator.
There is a powerful scalabar for vertical line slides to limit the candle bars.
Color for each line can also be changed.
It can detect:
1. Support && Resistance
2. Support become Resistance && vice versa
3.Support become Resistance become Support && vice versa
It also can be used for trading tools and studies on SnR *New Version avaiable

All about Smart Money Concepts Strategy: Market struture: internal or swing BOS, CHoCH; Orderblock; Liquity equal; Fair Value Gap with Consequent encroachment, Balanced price range; Level with Previous month, week, day level or in day level (PMH, PWH, PDH, HOD); BuySell Stops Liquidity (BSL, SSL); Liquidity Void Long Wicks; Premium and Discount; Candle pattern ... "Smart Money Concepts" ( SMC ) is a fairly new yet widely used term amongst price action traders looking to more accurately navigate

Average daily range, Projection levels, Multi time-frame ADR bands shows levels based on the selected time-frame. Levels can be used as projections for potential targets, breakouts or reversals depending on the context in which the tool is used. Features:- Multi time-frame(default = daily) Two coloring modes(trend based or zone based) Color transparency
FREE

The EasyFX Trader is a very unique and customizable dashboard for manual trading. It is placed in the Expert folder but is not an auto trading robot. You input all the parameter and the dashboard will monitor and let you know when there is a good trading opportunity. The tool is simple to use whether you're experienced or just a beginner. It was designed for all types of trading styles including price action, day, swing, trend trader, or scalper. Each column is described below. When you load the

Product detailed post: https://www.mql5.com/en/blogs/post/756962
Get free demo from the link in above post.
Features: - Multi Heiken Parameters
- Alerts & Highlights for Heiken Switch
- Heiken Alignment Alerts
- Multi-timeframe Alignment Alerts
- Multi Currency
Heiken Explained: Heiken Settings: All comma separated lists will be used for different heiken ashi's. Example: 5,40,188 will mean that MAPeriod1 in 1st heiken will be 5; In 2nd heiken will be 40 and in 3rd heiken ashi will be 1

Introducing the HFT EA - your ultimate tool for passing Prop Firm challenges with confidence and efficiency. Be aware that price will increase after five purchased. Version 1.1 Now Available! Unlock your potential with the HFT EA, meticulously designed to not just meet, but exceed the requirements of HFT Prop Firm evaluations. Why Choose our EA? Profit with Precision: HFT EA swiftly achieves profit targets in a matter of days, sometimes even within a single trading session. Specially at News, o

## My Dream: Creating a Stable Hedge Robot
"This EA is based on a logic that suddenly came to me before going to bed yesterday. I hurriedly took out my PC and created it so I wouldn't forget it."
It has long been my dream to develop a stable hedge robot. However, despite years of effort, I have struggled to achieve consistent success. Hedge logic is inherently complex, and increasing the number of open positions often leads to larger drawdowns.
To address this challenge, I devised a ne
MetaTrader 마켓은 거래로봇과 기술지표를 판매하기에 최적의 장소입니다.
오직 어플리케이션만 개발하면 됩니다. 수백만 명의 MetaTrader 사용자에게 제품을 제공하기 위해 마켓에 제품을 게시하는 방법에 대해 설명해 드리겠습니다.
트레이딩 기회를 놓치고 있어요:
- 무료 트레이딩 앱
- 복사용 8,000 이상의 시그널
- 금융 시장 개척을 위한 경제 뉴스
등록
로그인
계정이 없으시면, 가입하십시오
MQL5.com 웹사이트에 로그인을 하기 위해 쿠키를 허용하십시오.
브라우저에서 필요한 설정을 활성화하시지 않으면, 로그인할 수 없습니다.