MetaTrader 4용 Expert Advisor 및 지표 - 47
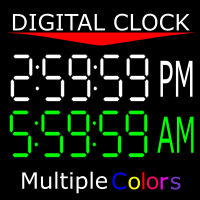
Shows you the time of the server you're on as well as the current time of the time zone you're in. 12-hour clock format (12:00:00 am to 11:59:59 pm) Charts from 1-5 mins are in hour:min:sec format Charts from 15 mins to 1 month are in hour:min format" You can also change the color of the clock to any color MT4 offers. If there is anything you would like me to add ask. As long as it isn't extensive, I might add it.
FREE

Welcome to Koala Fibo Base Time Welcome to Koala Fibo Time Zone Welcome to Koala Fibo Time Extention Welcome to Missed Tool For Meta Trade!
Simple Introduction : Fibonacci Time Zones are vertical lines based on the Fibonacci Sequence. These lines extend along the X axis (date axis) as a mechanism to forecast reversals based on elapsed time. A major low or high is often chosen as the starting point. Distances start relatively small and grow as the Fibonacci Sequence extends. Chartists can extend
FREE
Новая серия индикаторов Veles Dynamic. Индикаторы не перерисовывают своих значений.
Эти индикаторы работают быстрее и точнее аналогичных по названию.
Индикатор Veles_dTrend представляет собой гистограмму, рассчитанную на основе нескольких динамических алгоритмов,
использующих текущие цены инструмента.
Пока индикатор не покажет смену тренда, будьте уверены, что тренд продолжит свое направление.
Кроме этого, есть зоны принятия решения, которые ограниченны уровнями.В этих зонах будет самый
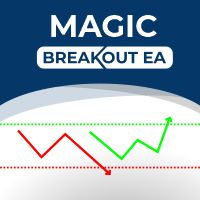
Yesterday High/Low Breakout Only 5 download of the EA left at $44! Next price --> $55 Symbol GBPUSD Timeframe M15 Test From 2017 Settings Default Setting
Additional - -------------- ---------------------------------------------------- Brokers Any Minimum Deposit $500 Recommend Deposit $1000 for cent Feature NOT sensitive to spread, slippage Suggest Use low spread broker

Tool for candle information. It allows to show the user information related to the candle when hovering the mouse over it. It has a simple interface. The user can modify its style by changing the colors in the input parameters.
Show data like: Candle date and time Open price of candle Close price of candle Highest candle price Lowest candle price Candle volume
FREE
Индикатор очень своевременно показывает входы в рынок на любом инструменте. Каждая стрелка имеет свою ценовую составляющую, равную(как правило) значению экстремума на используемом таймфрейме, что можно использовать в качестве установки стоповых ордеров или других действий при применении индикатора в советниках. Индикатор имеет минимальное количество параметров, позволяющих без особого труда настроить его работу. Параметр Level_Open отвечает за скорость выдачи сигнала. Чем больше этот параметр

Dragon Fire Ultimate Version is a tren following system for swing trading or scalping .trend based on candlesticks and look for corrections or continuations on the trend. you can use period candle or 7 or whatever you want . this time it is the ultimate version modified by our team which has many features that can be adjusted according to your needs in trading with robots. You can also do this backtest Only 5download of the EA left at $79! Next price --> $99 Symbol XAUUSD, EURUSD, GBPUSD A
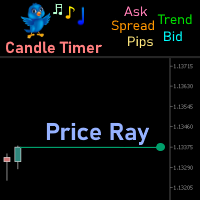
Price Ray indicator is a utility that will improve the way you trade. Primarily, it shows the Bid, Ask or Last price as a line ray which beams till the current candle, last visible chart candle or extended to all candle bars. The enhanced features in this indicator provide information in an area where you focus most, right next to the current candle. You can select text to be shown above or below the Price ray. The indicator is fully customizable, allowing it to fit any strategy requirements. Th
FREE
The BG Grid is a new generation grid EA. It can also be used for trading single orders without a grid and lot increase. It is most efficient on cross pairs on the М30 and Н1 timeframes. AUDCAD M30, GBPCAD M30, NZDCAD H1, GBPCHF H1. This is a counter-trend EA and it enters the market at the time of a possible correction of the trend. Entries are based on the standard MT4 indicators. As any other grid EA, during a drawdown, the BG Grid places an order grid and eventually closes it in net profit by

This is a free version of the EA TrendSurfer OsMa https://www.mql5.com/en/market/product/104264 TrendSurfer OsMa receives signals from a technical analysis of in-built MetaTrader 4 indicator Oscillator of a Moving Average (OsMA) and then implements The Quantum Forex Trading System to generate positive results. Discover: The Quantum Forex Trading System _Mastering the Market with Advanced Algorithms & Multifaceted Strategies_ --- Redefining Forex Trading: In the vast realm of forex, wh
FREE

Fx Ilan Pluss Советник Fx Ilan Pluss -это аналог советника, с добавлением множества дополнительных логик и возможностей для торговли, с оставленными настройками советника . Советник торгует по системе Мартингейл с увеличением последующих лотов в серии ордеров, с целью их усреднения. Первый ордер робот выставляет по сигналам встроенного индикатора. Так же советник имеет возможность прекращать торговлю в зависимости от новостей. FX Ilan Plus можно использовать либо на одном графике, либо на двух г
Please thoroughly test demo the indicator in your preferred trading conditions before making a purchase decision.
Your satisfaction and confidence in its performance are paramount.
MT Magical : A sophisticated strategy combining swing trading, trend analysis and supply & demand signals. Expertly filtered for precision. Developed with rigorous effort, delivering value to serious investors. Indicator for traders who prefer manual trading. Request: PC high performance
TRADE: Forex
TIME FRA

The BB Arrows MTF indicator is based on the Bollinger Bands indicator. Represents input signals in the form of arrows. All signals are generated on the current bar. In 2 modes, Signals are not redrawn (Exception of very sharp jumps)! All signals in MTF mode correspond to signals of the period specified in MTF. It is maximally simplified to use both for trading with only one indicator and for using the indicator as part of your trading systems. A feature of the indicator is that the indicator ti
FREE
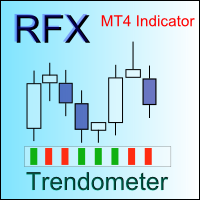
Identifying the trend of the market is an essential task of traders. Trendometer implements an advanced algorithm to visualize the trend of the market. The major focus of this indicator is to evaluate the market in the lower time frames (i.e., M1, M5 and M15) for the scalping purposes. If you are a scalper looking for a reliable indicator to improve your trade quality, Trendometer is for you. The indicator runs on a separate window showing a histogram of red and green bars. A two consecutive gre
Relative Strength Index (RSI) is one of the most popular and accurate oscillators widely used by traders to capture overbought and oversold areas of price action. Although the RSI indicator works fine for a period of market, it fails to generate profitable signals when market condition changes, and hence produces wrong signals which results in big losses. Have you ever thought about an adaptive RSI indicator that adapts its period of calculation based on the market conditions? The presented indi

Balanced Entry by VArmadA A simple yet powerful fractal based Support/Resistance Indicator
Works with timeframes 1H and higher and tested on all major pairs. Pay attention to the signal: An arrow indicating a long or short entry.
How It Works:
Arrows indicate reversed support/resistence. Up arrow means long - down arrown indicates a short trade.
Instructions: - IndicatorLong/IndicatorShort: Choose the colors for the given indicator arrows - Show Resistence Levels: Visualize the resistence l
FREE
Stochastic Oscillator is one of the most popular and accurate oscillators widely used by traders to capture overbought and oversold areas of price action. Although the Stochastic indicator works fine for an interval of the market, it fails to generate profitable signals when the market conditions change, and hence it produces wrong signals resulting in big losses. Have you ever thought about an adaptive Stochastic indicator that adapts its period of calculation based on the market conditions? Th

Free TrendLine EA opens trades whenever the price on the chart interacts with or crosses your trend line. You simply draw the trend line manually then let the EA do the trading automatically according to the rules you give it. The settings available in the EA are explained below: Lots : The lot size for trading. RiskPercentage : Set a value other than zero to activate lot sizing by use of percentage of margin. TrendLineName: The name of the line to track. You can either * rename the trend line t
FREE
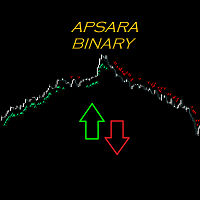
This indicator allows you to trade binary options and specially programmed to get the momentum to follow the trend that is happening in the live market. This indicator is based on trend strength, price correction and advanced technical analysis,this is 100% NO REPAINT. This indicators specifically for manual trading, I suggest using a platform that uses an expiration time Timeframe : M1 or M5 Expired Time : 1 Candle Pair : Any ( even better in the CAD market ) Time Session : Europe and NewY
This Expert Advisor monitors all open trades and saves them to a CSV file whenever a change is detected. It’s a lightweight tool for exporting trade data from MetaTrader 4 in real time. What it does: Monitors all open positions on the terminal Detects changes (order type, volume, price, SL, TP, etc.) Writes updated trade data to a .csv file ( TradeCopy.csv ) Includes order ID, symbol, type, lot size, price, SL, and TP Saves files in the Common Files folder for easy access by other applications H
FREE

The indicator displays volume clusters or volume profiles to choose from.
Input variables
StepPoint - cluster step in points, if the value is zero, the step is assigned automatically. AssociatedTimeframe - binding the indicator to the specified timeframe of the chart, if the value is equal to Current, the indicator works on all timeframes. ClustersVolume - volume in clusters: All - all volume. Active - active volume (which produced the price movement). ClustersAsDelta - difference betwee

Gold Pro MT4 is a trend indicator designed specifically for gold and can also be used on any symbol. The indicator does not redraw and does not lag.
Free Dashboard : monitor All pairs and timeframes here: https://www.mql5.com/en/market/product/60431 SETTINGS Factor 1: use to calculate different methods of drawing indicator line Factor 2: use to calculate different methods of drawing indicator line AlertByPopup - true/false popup alerts. AlertBySound - true/false
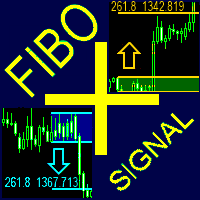
The FiboPlusSignal Expert Advisor. Automatic and manual trading on any instrument (symbol) and on any chart period. The operation algorithm is based on: Fibonacci retracement (5 different methods); calculation of trend direction using 14 indicators; support and resistance lines; horizontal support/resistance levels. Additional features: locking of orders (instead of setting stop loss); trailing stop based on Fibonacci retracement; alert system; visual panel for opening orders in manual trading –

Constant Trader는 완전 자동화된 전문 거래 로봇입니다. 외환 시장 EURUSD를 위해 특별히 설계되었습니다.
EA는 매개변수를 구성할 필요가 없습니다. EURUSD M30에서 작업할 준비가 되었습니다. 로트 선택 만 결정하면됩니다.
그것은 추세를 감지하고 시장 소음을 걸러내는 스마트 알고리즘을 가지고 있습니다. 전문가는 추세 방향에 대한 주문을 생성합니다.
입력 및 출력 주문은 모든 MT4 플랫폼에서 볼 수 있는 Bolinger Bands, Standard Deviation 및 Stochastic의 세 가지 지표 조합으로 제공됩니다.
모든 거래는 변동성이 증가할 때 자본 보안을 제공하는 손절매로 보호됩니다.
전문가는 1년 간의 EURUSD 과거 데이터(2022-2023)에서 테스트되었습니다. 실제 돈으로 사용하기 전에 다운로드하여 직접 테스트하십시오.
이 전문가는 EURUSD M30에 최적화되어 있습니다. 모든 쌍에는 고유한 특성이 있습니다.
추천: E
FREE

Divergence Convergence MACD is based on the classical divergence and convergence methods of charting. Divergence is when we get higher highs and lower lows on our uptrend but which are not supported by our indicator which makes lower highs and therefore signals the underlying momentum is failing and so a reversal might occur. Vice versa for downtrend. Convergence is when the higher highs and higher lows of an uptrend are also confirmed by our indicator making lower lows which helps us confirm th
FREE

Limited time offer! For the launch of NextBot Scalper EA , the price of this indicator will drop to FREE !
Introducing a pragmatic and innovative tool for MetaTrader 4 (MT4) traders: the Linear Regression Next channel indicator, enhanced with the determination coefficient R 2 . This indicator serves as a foundational tool for traders seeking to understand market trends through the lens of statistical analysis, specifically linear regression.
The essence of this indicator lies in its ability t
FREE
This indicator was developed to support multiple timeframe analysis. In the indicator settings, the user can set the color, width, and style of the horizontal lines for each timeframe. This way, when the horizontal lines are inserted into the chart, they will be plotted with the timeframe settings.
MTF Lines also allows visibility control of another objets like rectangles, trend lines and texts.
This is a product developed by Renato Fiche Junior and available to all MetaTrader 4 and 5 users!
FREE
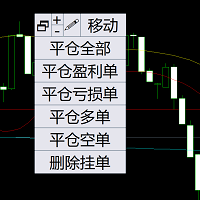
一键平仓面板 平仓盈利单,平仓亏损单,平仓多单,平仓空单,删除挂单. 可移动拖动 自动切换语言 简体 英文 繁体 其他语言全部是英文 可自定义显示标识,定义为本地习惯用语. 此程序主要用语演示验证多国语言的可行性,没有加上太多的功能. 一键平仓面板 平仓盈利单,平仓亏损单,平仓多单,平仓空单,删除挂单. 可移动拖动 自动切换语言 简体 英文 繁体 其他语言全部是英文 可自定义显示标识,定义为本地习惯用语. 此程序主要用语演示验证多国语言的可行性,没有加上太多的功能. 一键平仓面板 平仓盈利单,平仓亏损单,平仓多单,平仓空单,删除挂单. 可移动拖动 自动切换语言 简体 英文 繁体 其他语言全部是英文 可自定义显示标识,定义为本地习惯用语. 此程序主要用语演示验证多国语言的可行性,没有加上太多的功能.
FREE

This simple information indicator shows the name of the current day and past working days, months and years.
On the concept of time and timeframe It is common knowledge that a timeframe is a time interval considered in technical analysis of free financial markets, during which the price and other market data changes occur when the price charts are plotted. In the MetaTrader 4 trading terminal, these periods are separated by vertical dashed line, which can be enabled or disabled by simply pressi
FREE

The recommended timeframe is H1!
The indicator has two kinds of signal.
This is a signal to open a position from the appearance of an arrow. The price leaves the channel In the first case, the indicator builds arrows based on the constructed channel and Bollinger Bands years.
In another case, the trader can trade if the price just went beyond the channel. If the price is higher than the channel - we sell. If the price is lower than the channel, then you can look for a place to buy.
It can al
FREE
Introduzione
L’indicatore Grid Option Strike è progettato per MetaTrader 4 e si basa sui livelli di strike delle opzioni sui future , fornendo una struttura chiara dei movimenti del prezzo su coppie di valute come EUR/USD, GBP/USD e AUD/USD . Questo strumento aiuta i trader a identificare aree di supporto e resistenza dinamiche basate sugli intervalli di 25 pip e 50 pip , frequentemente utilizzati dai trader istituzionali e nei mercati delle opzioni.
Lascia un commento per potere migliorare l'
FREE
This indicator allows to hide Bollinger Bands (on all MT4 timeframes) from a date define by the user, with a vertical line (Alone) or a panel (with "Hidden Candles"). Indicator Inputs: Period Deviations Shift Apply To Color Style Width Information on "Bollinger Bands" indicator is available here: https://www.metatrader4.com/en/trading-platform/help/analytics/tech_indicators/bollinger_bands ************************************************************* Hey traders!! Give me your feeds! We are
FREE

It's a multi-currency grid and martingale system that can trade all input pairs from one chart. The expert will close all orders for each pair using a profit level. The expert has the possibility to trade up to 100 pairs.
Information
Chose a broker with fast execution and low spreads for effective results. Please make some tests on a demo account to see how the expert works before using it on a real account. For 0.01 lot size and leverage 1:500, you need an initial balance of at least 10,000 f
FREE

Behaving in a similar fashion as the price action of a chart, the indicator uses " Trix " to opportune itself to the exposure of divergency, flat/low market volume, and price action expansion . The TRIX indicator nicknamed after the Triple-Exponential-average, is a momentum-based oscillator that filters minor price changes and fluctuations that are considered insignificant for forex trading whilst providing money making opportunities! Overall, TRIX is a leading indicator that shows diverge
FREE

The Expert Advisor is designed for aggressive trading. The Expert Advisor has new methods for determining the direction of the trend. The EA trades with a minimum profit on a no-loss system, controlling every trade.
️ Join our Telegram channel and get a powerful package of gifts that will make your trading even more successful: ️Our Telegram channel ️ t.me/EAQuantumLab
3 unique indicators - accurate market analysis in your hands.
Trading panel - convenient management of
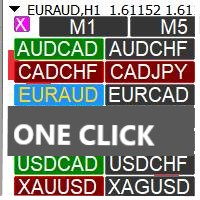
Profit Loss Symbols Dashboard Dashboard displays all manually entered pairs in settings and shows their profit loss information. One click to navigate between all pairs on one chart. Dashboard can be hide or displayed. Green Colour: Symbol(s) in Profit Red Colour: Symbol(s) in Loss Blue Colour: Current Chart Yellow Colour: Timeframe Selected
TRY HAWA GOLD WITH 80% WIN RATE
MT4 VERSION: https://www.mql5.com/en/market/product/58832 MT5 VERSIION: https://www.mql5.com/en/market/product/59276
Pleas
FREE

STOCH AND RSI ALERT https://www.mql5.com/en/users/earobotkk/seller#products (I have created a dashboard from this product, please take a look by clicking here ) (I have also created an EA from this product, NOW user can go automation, click here ) P/S: If you like this indicator, please rate it with 5 stars in the review section, this will increase its popularity so that other users will be benefited from using it. This indicator notifies and draws an arrow on the chart whenever the main sto
FREE

Download the free USDJPY version here.
MACD Indicator The Moving Average Convergence and Divergence (MACD) is a trend following momentum indicator which shows the relationship between two moving averages that we chose and configure them on the indicator. The MACD is calculated by subtracting the 26-period exponential moving average and the 12 period D.A.M. These are the default parameters when you put the MACD indicator on the charts, and the period is usually 9 which means the last 9 candles
FREE

Daily Weeky Info
it shows you Daily open and weekly open and daily trend open (ie) daily open > previous day open and weekly trend open (ie) weekly open > previous week open Day high low and weekly low high and previous week high and low it will help you to decide your trade no need to check higher timeframe when you trade intraday,
dont trade against the daily trend and daily open level
FREE

Sometimes a trader needs to know when a candle will close and a new one appears to make the right decisions, this indicator calculates and displays the remaining of current candle time . It is simple to use, just drag it on the chart. Please use and express your opinion, expressing your opinions will promote the products. To see other free products, please visit my page.
FREE

This Scanner Dashboard uses the Extreme TMA System Arrows Indicator to show good BUY/SELL signals. This Product contains dashboard only. It does not contain the Abiroid_Arrow_Extreme_TMA.ex4 indicator. Arrows indicator is not necessary for dashboard to work. To see arrows, you can buy the arrows indicator separately if you like: https://www.mql5.com/en/market/product/44822
Dash shows Slopes for current and Higher Timeframes. - 1st diamond is current TF. Next diamonds are higher TFs
(Please Not

This is a Multi-currency multi-timeframe Support/Resistance Scanner Dashboard for Metatrader 4 (MT4) platform.
Get all extras and download free demo here: https://www.mql5.com/en/blogs/post/760210
Read detailed description in post above. And get the SR Indicator for individual charts.
Features: Scan Support/Resistance zones (also called Supply/Demand zones) Show alert when price is inside these zones and highlights the pair/timeframe Show or hide SR zones price nearest to current price (Price
Waddah Attar Statistical Predictor
This indicator show you the Statistical Forecast for any symbol. it depends on a history data . the result show on a new day and still with no change until end of the day . with this indicator you can : know the main direction . know the range of the movement . know high and low in the current day . use indicator levels in any expert you made to auto trade .
Preferably used with main symbols like EURUSD, GBPUSD, AUDUSD, NZDUSD, USDJPY, USDCHF, USDCAD, Gold, S
FREE
TDR gbpusd is an Expert Advisor designed to trade on gbpusd and other forex currencies. Best time frame: 1h. Minimum trading account 3000. This EA trading both direction of a market at the same time and opens multiple positions. This EA have 2 main modes: safe mode(MaximumRisk=0.01) extreme mode(MaximumRisk=0.02) for 5000$ account. setting can be modify by user: MaximumRisk / ProfitFactorMain / ProfitFactorPower this EA operates only once per bar closing, fast methods of optimization are vali
FREE
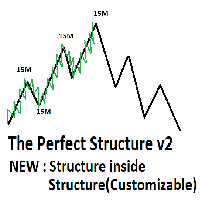
/* V2 of the Perfect structure.*/ Whats Inherited from v1?
# This is the finest structure marking you will ever find in any market. # indicator is coded considering the actual structure any trader would use. # indicator is coded based on actual candle breaks and not coded based on any pivot or predefined values or specific number of candles high and low. # please check out the screenshot.
# if you want me to fine tune it according to your needs then i am open for it. Whats new in V2? 1. AI bas

This indicator shows the strength of each currency compared to the US dollar by calculating the rate of change in price over a specified time period. When you open the indicator, you'll see a list of different currencies on the price chart. Each currency will have a numerical value indicating its strength level compared to the US dollar, where: If the value is higher than the US dollar, it will be displayed in green, meaning that currency is stronger than the dollar. If the value is lower than
FREE

Индикатор показывает: открытые ордера по инструменту; количество ордеров; профит по Buy и Sell каждого инструмента; суммарный профит. Количество строк и столбцов по инструментам определяется автоматически, в зависимости от ширины окна. Индикатор обновляется по таймеру, время обновления задается в настройках. Устанавливать индикатор можно любой график вне зависимости от ТФ и пары. Клик по названию инструмента переключает текущий график на выбранный. Совместно со скриптом https://www.mql5.com/ru/
FREE

Defines extremes. This indicator consists of two parts. The first draws lines on the chart indicating low volatility in relative daily market activity. The second is responsible for determining the extremum and gives signals to buy or sell. This system is suitable for all instruments. It is recommended to use a timeframe from m15 to h4. Before using, you need to choose the settings for yourself. Configure lines deviation. Specify volatility coefficient. Advantages The indicator does not repaint
FREE

Average Session Range MT4: Calculate and Average the Sessions High-Low Range of Specific Time Sessions Over Multiple Days. The Session Average Range is a sophisticated and precise tool designed to calculate the volatility of specific time sessions within the trading day. By meticulously analyzing the range between the high and low prices of a defined trading session over multiple days, this tool provides traders with a clear and actionable average range. **Note:** When the trading platform is cl
FREE

The indicator shows the maximum and minimum number of lots, as well as the size of the symbol spread. This information is needed to make a quick market entry decision based on the deposit maximum. The calculation considers free funds and funds sufficient for opening one lot. Such situations are common when you participate in various forex contests or trade in the market using your funds to the maximum, as well as during periods of increased or decreased volatility. The indicator provides the nec
FREE

For Multi Time Frame version, please click here. BASE TRADING SYSTEM is a useful tool to trade with simple strategy. It draws automatically base up for long trade and base down for short trade. Clear trade when base is going opposite direction. User can trade by instant market entry or by pending order entry. It depends on user best strategy. input: Base Box Color- UP base box , DOWN base box, UP base shadow, Down base shadow.
FREE

Bollinger Bands Breakout Alert is a simple indicator that can notify you when the price breaks out of the Bollinger Bands. You just need to set the parameters of the Bollinger Bands and how you want to be notified.
Parameters: Indicator Name - is used for reference to know where the notifications are from Bands Period - is the period to use to calculate the Bollinger Bands Bands Shift - is the shift to use to calculate the Bollinger Bands Bands Deviation - is the deviation to use to calculate t
FREE

This indicator is not only for trading but also for learning, thanks to it, you can learn to identify trend, support and resistance.
You've probably heard about the Dow trend theory, where higher highs and higher lows indicate an uptrend, and lower highs and lower lows indicate a downtrend. This indicator determines this trend based on the Dow Theory. You just need to enter a number representing the number of candles between extremes. The optimal solution is the number 3 (H1 TF), unless you wa
FREE

In times where the interest with your Bank is 0 or negative, that EA can generate good longterm profit.
You will have more options to runthe EA Standard Option TP and SL Martingale Trailing How you run it depends on you. Works on all Frames and all Pairs. My recommendation Martingale or standard with trailing stop I recommend the current settings and run it on the Day Chart for Longterm Investment Be aware that different Broker have different Times and spreads. That one works also on Cent Ac

CFN - Multi MA & EMA Indicator for MT4 – with Alerts Enhance your technical analysis with the Multi MA & EMA Indicator – a powerful tool designed for traders who rely on Moving Averages and Exponential Moving Averages to spot trends, entries, and exits. Key Features: Supports up to 5 Moving Averages (MA) & 5 Exponential Moving Averages (EMA):
Plot multiple MAs and EMAs simultaneously on your chart, fully customizable with individual periods. Custom Colors & Styles:
Each MA and EMA l
FREE

Features:
- Current TF GMMA Cross and Trend (Mandatory Check.. G-Up/G-Down) - HTF GMMA Trend Check (Optional.. slanting arrow) - TDI or NRTR Trend Check (Optional.. diamond)
Read post for detailed description and downloading extra indicators: https://www.mql5.com/en/blogs/post/758264
Scanner:
This is a Dashboard Scanner for finding good trades using the GMMA method as base and TDI method for trend verification. All buttons for all Pairs and Timeframes are clickable and will change the chart f

BeST_ Elliot Wave Oscillator Strategies is an MT4 indicator which by default is the difference of two SMAs displayed as a histogram fluctuating around zero while a Signal Line generates Entry Signals either in a Reverse or in a Normal Mode and it is a very powerful tool that very often exploits huge market movements. Signal Line comes in 2 types: Advanced Get Type – like the corresponding one used in the homonym analysis package Mov. Average Type – as a Moving Average of the Elliot Oscillator I

Export Order History Free ! Meta Trader 4 script Please leave a review about this product to help other users benefit from it. Export trades history into a CSV file ( Excel sheet ) The summary is saved into a file in MQL4\Files folder. Choose / A ccount history / C ustom period from your MT4 Select period Click OK to Export file directory Open MT4 data folder CSV file ( Excel sheet ) Order > Open time > Close time > Type > Symbol > Size > Entry price > Exit price > T/P >
FREE

CAP Moving Average Pro EA MT5 trades using the Moving Averages Indicator. It offers many customizable Moving Averages trading scenarios and flexible position management settings, plus many useful features like customizable trading sessions, a martingale and inverse martingale mode. [ Installation Guide | Update Guide | Submit Your Problem | FAQ | All Products ]
Before buy Pro version? You can buy alternation pro version, our powerfull EA, CAP Strategy Builder EA . This is strateg

EURUSD H1 Simple Martingale that works on daily swing levels, low DD, TP and SL defined on the basis of certain pre-set calculations in the algorithm, executes one trade at a time, weekly trading no overnight on weekends, possibility to establish customized exit times, possibility of customize money management. average return of 7.92% per year with the factory settings of the V1, it is always constantly updated, it is recommended to use it with a GMT +2 server TESTED SINCE 2003
Happy trading
FREE

The indicator is specially designed for the trading utility Trade Shell (included Trade Shell SMC ) to get it working on visual strategy tester.
Backtest your trading ideas and indicators. Run Trade Shell on visual tester and then put this indicator on the chart. After that you will be able to control all functions of the Trade Shell as well as with live using! It does not work live! Use it with visual tester only. It does not require to set any setting on input parameters.
Have a good luck
FREE

A simple but very powerful EA. It uses two moving averages as a basis for opening orders, which when they cross, orders will be opened. The open order will be closed in two situations: When there is a new crossover opposite the previous one, in this case the price touches the slower moving average, or when it reaches the automatic Take Profit margin. If the price goes in the opposite direction, it will open new orders at the new crossings of the moving averages to calculate the average price and
FREE

This indicator is a useful tool for visualising cyclic components in price. It calculates the Discrete Fourier Transform (DFT) of a price chart data segment selected by the user. It displays the cycles, the spectrum and the synthesised signal in a separate window. The indicator is intended as a learning tool only, being unsuitable for providing actual trade signals. Download the file - it is a free toy. Play with it to understand how signals can be transformed by controlling their cyclic comp
FREE
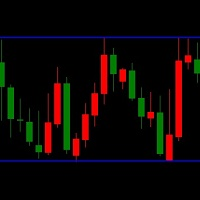
LT Triple Support Resistance Screen Method is a kind of levels indicator that consist of three SR lines. It is built by MQL4 programming language and can be used to MT4 platform. A free version indicator to determine the support and resistance levels easily This indicator works based on the screen method to calculate the most appropriate value for each buffer. A complex algorithm based on long research is applied to this free custom indicator. But this indicator has limited features and simpler
FREE

This is a fully automated smart adaptive algorithm. The SKYNET system calculates the history data and performs the analysis based on the probability percentage of where the upcoming breakout of the support and resistance level will take place, and places pending orders. The Expert Advisor adapts to any market conditions. It was backtested and optimized using real ticks with 99,9% quality. It has successfully completed stress testing. The EA contains the algorithm of statistics collection with ou
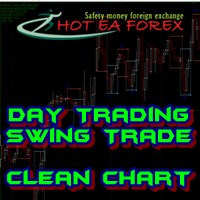
How To Trade
Execute your trades in 3 Easy Steps!
Step 1: Trade Setup Entry Buy in Signal Arrow color DodgerBlue. Entry Sell in Signal Arrow color RED. Success Rate ≥ 75% 100:25 Step 2: Set Stop Loss Stop loss BUY ----> You can set stop loss on Line RECTANGEL color DodgerBlue. Stop loss SELL ----> You can set stop loss on Line RECTANGEL color RED. Step 3: Set Take Profit Take profit BUY on RECTANGEL color RED. Take profit SELL on RECTANGEL color DodgerBlue. Strategy SIMPLE Day trading / Swing
FREE

Defining Range ( DR ) and Implied Defining Range ( IDR ) indicator Pro with added features from free version
Show DR and IDR ranges Sessions on the chart for RDR Regular defining range (New York Session)
ADR After defining range (Asian session) ODR Outside defining range (London Session)
Buttons on chart to enable / disable :
Show Imbalance ( IMB ) Show Volume Imbalance ( VIB ) Show Gap's between open and close
Show Standard Deviation ( SD )
Show last 3 Sessions or Back
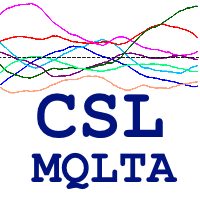
The Currency Strength Lines (CSL) indicator is a very useful tool for both beginners and experienced traders. It is able to calculate the strength of single currencies and show them on a chart, so that you can see the trend and spot trading opportunities.
How does it work? The CSL Indicator will run calculations on all the 28 pairs, resulting in the overall strength across the market of individual currencies at any given moment. You can use this data to spot currencies that are strong, getting
FREE

This is an incredibly powerful EA that can pass challenges and be used to manage funds. This is a trend following strategy that trades in the direction of a higher timeframe such as the daily. It executes trades by intervals on the small timeframes such as the 15m or the 5m. Whenever price action is overbought/oversold with RSI + S&R. All open trades close once the profit target is reached. Since this is a trend following EA, this bot comes with a powerful built-in trailing stop loss mechanism

스타일이 중요하기 때문에 매번 속성을 클릭하여 초의 색상을 변경하고, 배경을 밝거나 어둡게 만들고, 격자를 삽입하거나 제거하는 것이 얼마나 성가신 일인지 압니다. 클릭 한 번으로 해결하는 방법은 다음과 같습니다. 트레이더가 원하는 캔들 스타일을 선택할 수 있는 3개의 맞춤형 버튼. 낮과 밤 모드 사이를 전환하는 버튼입니다. 차트에서 그리드를 표시하거나 숨기는 버튼입니다. *****설정에서 화면에서 버튼을 표시할 위치를 선택할 수 있습니다.**** 내 다른 제품도 확인하십시오 https://www.mql5.com/en/users/javimorales.fer/seller MT5 버전 확인: https://www.mql5.com/en/market/product/69070 RSI 지표는 무엇입니까? RSI는 0에서 100까지 측정할 수 있는 오실레이터로 표시됩니다. 이 지표는 J. Welles Wilder Jr.가 개발했으며 1978년 그의 저서 New Concepts in Technica
FREE
트레이딩 전략과 기술 지표를 판매하기에 가장 좋은 장소가 왜 MetaTrader 마켓인지 알고 계십니까? 광고나 소프트웨어 보호가 필요 없고, 지불 문제도 없습니다. 모든 것이 MetaTrader 마켓에서 제공됩니다.
트레이딩 기회를 놓치고 있어요:
- 무료 트레이딩 앱
- 복사용 8,000 이상의 시그널
- 금융 시장 개척을 위한 경제 뉴스
등록
로그인
계정이 없으시면, 가입하십시오
MQL5.com 웹사이트에 로그인을 하기 위해 쿠키를 허용하십시오.
브라우저에서 필요한 설정을 활성화하시지 않으면, 로그인할 수 없습니다.