MetaTrader 4용 기술 지표 - 141
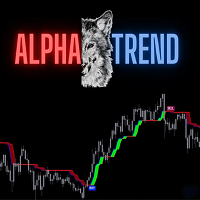
AlphaTrend is a brand new indicator which inspired by Trend Magic. In Magic Trend we had some problems, Alpha Trend tries to solve those problems such as:
1-To minimize stop losses and overcome sideways market conditions.
2-To have more accurate BUY/SELL signals during trending market conditions.
3- To have significant support and resistance levels.
4- To bring together indicators from different categories that are compatible with each other and make a meaningful combination regarding momen
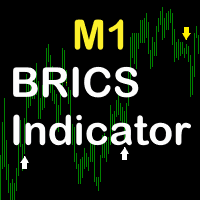
M1 BRICS Indicator
Welcome back!
- M1 BRICS Indicator is specially created for the M1 timeframe.
- The indicator indicates good and safe but relatively rare signals.
- This can be compensated by trading multiple currency pairs, so there will be plenty of signals.
- M1 BRICS Indicator works on all currency pairs.
- Indicator does not repaint.
- The white arrow represents the signal to buy. - The yellow arrow indicates the signal to sell.
Thank you. Good luck!

Morning Star PRT 지표는 모닝 플랫 브레이크아웃 원리를 사용합니다. 이 지표는 모닝 플랫 레벨을 표시하고 가능한 타겟을 보여줍니다. 지표에 피보나치 레벨이 추가되었고, 설정에서 지정한 두 타겟 레벨과 나이트 플랫 레벨의 교차점에 대한 경고음이 울립니다.
Morning Star PRT 지표는 나이트가 끝날 때 나이트 플랫 채널을 구축하고, 두 개의 피보나치 가격 레벨이 위아래로 움직입니다. 이러한 레벨은 타겟 레벨과 반전 레벨로 간주할 수 있습니다.
Morning Star PRT 지표는 모든 타임프레임에서 작동하지만 M15 간격에서 사용하는 것이 가장 효과적입니다.
The Morning Star PRT indicator uses the morning flat breakout principle. The indicator displays morning flat levels and shows possible targets.
An additional Fibonacci le
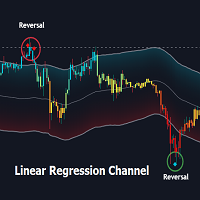
Overview:
The Linear Regression Channel Indicator is a versatile tool designed for Metatrader to help traders visualize price trends and potential reversal points. By calculating and plotting linear regression channels, bands, and future projections, this indicator provides comprehensive insights into market dynamics. It can highlight overbought and oversold conditions, identify trend direction, and offer visual cues for future price movements.
Key Features:
Linear Regression Bands: ( fig
MT4의 "Binary Pin-Bar" 지표는 M1 및 M5 타임프레임에서 바이너리 옵션 거래를 위해 설계되었으며, 모든 통화 쌍과 함께 작동합니다. 핀바 캔들이 새로운 고점(상승 추세) 또는 저점(하락 추세)을 형성할 때 진입 신호를 생성합니다. 기능: 신호는 차트에 버퍼 화살표로 나타납니다. 파란색 화살표는 매수(Buy) 신호를 나타내며, 빨간색 화살표는 매도(Sell) 신호를 나타냅니다. 각 통화 쌍의 성과 통계가 차트에 표시되어 신호의 신뢰성을 평가하고 필요한 경우 매개변수를 최적화할 수 있습니다. 기본 만료는 1개의 캔들로 설정되어 있지만 신호 신뢰성을 높이기 위해 1에서 3개의 캔들로 조정할 수 있습니다. 버퍼 화살표는 적시에 진입을 쉽게 하며 추가 EA와 함께 지표를 사용하여 자동 거래 실행이 가능합니다. 사용 권장사항: M5에서 지표를 사용하고 신호가 나타나면 1분 만료로 설정합니다. 설정 및 요구사항: 정상 작동하려면 "MQL5" 폴더를 MT4 터미널 폴더로 이동하세

지표 공급 및 수요 구역 PRT– 차트의 공급 및 수요 구역 표시를 수행하는 데 사용되는 사용자 지정 도구입니다. 이 지표는 저항/지지 수준과 공급/수요 구역을 강조하는 차트에 선과 사각형을 그립니다. 편의상 선과 그림은 모두 다른 색상으로 칠해져 신호를 서로 쉽게 구별할 수 있습니다. 이 지표는 아직 사용되지 않았고 가격이 아직 돌파하지 않은 새로운 수준만 그립니다. 초보자와 숙련된 트레이더 모두에게 적합합니다.
이 지표는 스캘핑, 트렌드, 카운터 트렌드 및 기타 트레이딩 시스템에서 사용됩니다. 이것은 모든 전략에 쉽게 포함될 수 있는 보편적인 알고리즘입니다. 모든 시간 프레임과 도구에서 잘 보이고 오실레이터와 잘 결합됩니다. Indicator Supply & Demand zones PRT– is a custom tool that is used to perform supply and demand zones marking of the chart. The indicator draw

이 지표는 차트 패턴을 식별하고자 하는 트레이더에게 강력한 도구이며, 이를 트레이딩 전략에 통합하는 데에는 수많은 이점이 있습니다. 이 도구는 금융 시장에서 잠재적인 추세와 반전을 효과적으로 식별하고 신호를 보내 트레이딩 수익성을 높입니다. 고급 알고리즘 덕분에 이 지표는 시장 데이터를 정확하게 분석하여 트레이더에게 정보에 입각한 결정을 내리는 데 도움이 되는 귀중한 정보를 제공할 수 있습니다. 이 지표를 사용하면 차트 패턴을 높은 정확도로 자동으로 식별하므로 시장을 보다 포괄적으로 분석할 수 있습니다. 이러한 패턴은 종종 특정 방향으로 잠재적인 가격 움직임을 나타냅니다. 따라서 이 정보에 액세스할 수 있으면 트레이더는 이러한 패턴을 인식하거나 의미를 이해하지 못할 수 있는 다른 시장 참여자보다 유리합니다.
이 지표는 광범위한 강세 및 약세 패턴 인식 기능을 자랑합니다(차트에서 약어로 표시된 명칭은 괄호 안에 표시됨):
- Rising Star(SS);
- Evening St

This indicator calculates several technical indicators (SMA, RSI, ADX, MACD) across various timeframes (5 minutes, 15 minutes, 30 minutes, 1 hour, 4 hours). It uses these values to determine trading signals (buy, sell, or hold). A volatility filter (based on the ATR) is applied to avoid signals during low-volatility periods. The indicator displays these signals and the indicator values on a dashboard, providing a clear and detailed overview of market conditions across multiple timeframes. Addit
FREE

Deep Insight Candles is an indicator that brings an entirely new perspective to the price chart. It focuses on revealing hidden structures in market movements, uncovering buyer and seller pressure, thus helping traders to better identify key levels, dynamics, and potential reversals. The indicator conveys deeper market insights, allowing traders to make decisions based on a more accurate perception of market sentiment and pressure at specific price levels. This innovative approach transforms the

Entry indicator for: - Strong moves - Tops Bottoms
Try it as yourself and it proves its value with its results. - - - - - - - - - - - - - - - - - - - - - - - - - - - - - - - - - - - - - - Info: BarRange = how many bars are detected; AlertConfirmation = Alerts on and off; CalculatedBars = Indicator Calculated Bars; Buffer0[] = Arrow Up; Buffer1[] = Arrow Down; Buffer4[] = 1 or 0 Buy Signal Buffer5[] = 1 or 0 Sell Signal
매일 시장이 시작될 때, Flashpoints Breakout 은 이전 날의 데이터(고가, 저가, 종가)를 사용하여 피벗, 지지 및 저항 수준을 검토하고 두 개의 돌파 수준(상승 및 하락)을 계산합니다. 이렇게 하면 아침에 새로운 진입 수준과 Take Profit (TP) 및 Stop Loss (SL) 값을 바로 준비할 수 있어 추가 계산 없이 매수 스톱 또는 매도 스톱 주문을 걸 수 있습니다. Flashpoints Breakout 을 사용하면 매일 예상되는 돌파 수준에 따라 매수 스톱 주문 1~2개와 매도 스톱 주문 1~2개를 설정하여 기회를 놓치지 않도록 할 수 있습니다. 상단의 데이터 패널을 확인하고 매수와 매도를 각각 하나 또는 두 개씩 설정하십시오. 패널에서 정확한 진입 값, SL 및 TP를 찾을 수 있으며, 차트에서 해당 값에 일치하는 선을 볼 수 있습니다 (이미지 참조).
1. 매수 작업 (BUY): 진입 1 "BUY" ==> 매수 영역에서: 주문 1: 매수 영역에서
BUYSELLMAGIC is a non-repainting signal-type trading indicator designed to precisely detect entry points in the market.
Features Reliable and permanent signals : BUYSELLMAGIC signals are final once the candle closes, ensuring they will not be modified or removed from the chart. This gives you the confidence of working with an indicator that keeps its signals stable and trustworthy. Comprehensive alerts : In addition to signals on the chart, you’ll receive notifications via email, pop-up alerts

The SniperPro(XAU-USD) trading indicator has performed well for 15 days on XAU USD.....When trading on this indicator, the order sometimes goes into a drawdown.....The indicator does not redraw!!!!!! The indicator works on time intervals M1-D1....He performed well during the release of economic news… We attach the indicator to the XAU – USD M5 chart with standard settings without changing anything.....

Automatic Fibonacci Pivots automatically calculates pivot levels and support/resistance based on Fibonacci, clearly showing key reference points that indicate potential reversal or trend continuation zones, as well as buy and sell areas . Designed for traders seeking clarity on charts without having to recalculate and manually place Fibonacci levels each time. Once set up on your computer, it will send an alert to your phone when a potential buy/sell signal is issued, allowing you to trade direc
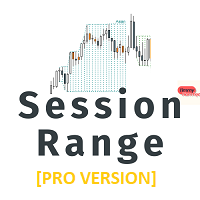
Liquidity is one of the most crucial aspects of the forex market. We can say that liquidity exists at every level of price, but there are certain areas where liquidity tends to be higher. The session high/low is one such area, which is why we developed this indicator. Why Session Range? Helps traders identify session liquidity : The session high/low represents a key liquidity pool, especially during the Asian session. Provides insight into your session position : This indicator allows you to pi
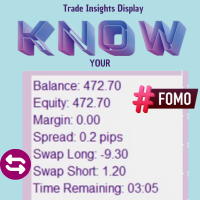
Trade Insights Display is the ideal companion for traders who want to operate with clarity and precision. This indicator provides real-time access to critical account data, such as: Balance Equity Margin Spread Swap Remaining time for the current candle . These data points are essential, regardless of the strategy or other indicators you use. Having this indicator always visible allows you to quickly assess your account status, the swap for each pair (helping you avoid high-cost trades), and the

In the fifth update , the indicator now aims to predict the direction of the next candle, issuing a buy or sell arrow precisely when the conditions are met.
Since its first version, which showed support and resistance levels on the chart, up to the current version 5, many improvements have been made. One of the key changes is the removal of visual support and resistance levels to prevent memory overload. This is no longer necessary, as arrows are now issued when the price is near or touches th

BTC Follow Line - 비트코인 거래 가이드 BTC Follow Line은 암호화폐 시장, 특히 비트코인에 중점을 두고 설계된 고급 지표입니다. 중장기적 매수 및 매도 신호를 찾는 트레이더에게 적합하며, 모든 시간 프레임에서 작동하여 거래 요구 사항에 맞게 조정됩니다. 왜 BTC Follow Line을 선택해야 할까요? 간단하고 직관적임 : 깔끔하고 읽기 쉬운 인터페이스로, 손쉽게 정보를 바탕으로 한 결정을 내릴 수 있습니다. 다재다능함 : 빠른 분석부터 장기 평가까지 모든 시간 프레임에서 작동합니다. 비트코인에 최적화됨 : BTC 시장의 고유한 동적 특성을 포착하도록 특별히 설계되어 더 일관된 신호를 보장합니다. BTC Follow Line은 어떻게 작동합니까? 이 지표는 비트코인 트렌드를 분석하고 주요 시장 변화에 따라 시각적 신호를 생성합니다. 명확히 정의된 녹색 및 빨간색 선은 잠재적 진입 또는 종료 지점을 나타내어 명확하고 정확한 지침을 제공합니다. 주요 장점: 불

non-repaint free MT4 technical indicator works on all timeframes 1 minute to the monthly timeframe the trade vision buy and sell arrow is a multi currency and synthetic indicator Trade vision buy and sell arrow comes with Push Alerts purple arrow look for selling opportunities white arrow look for buying opportunities. wait for candle to close and arrow to appear before taking any trades
Revolutionize Your Trading with the Enhanced Schaff Trend Cycle Indicator! Unlock the full potential of your trading strategy with our Advanced Schaff Trend Cycle (STC) Indicator , an indicator to deliver faster, more accurate signals than ever before. Built on the foundation of Doug Schaff's classic STC, this upgraded version integrates cutting-edge enhancements to suit the demands of modern traders. Why Choose This Indicator? Precision Redefined : Improved calculations for sharper trend ide
Master Market Trends with the Advanced XST Indicator! Introducing XST (eXtreme Super Trend) , the next-generation trend-following indicator designed for traders who demand speed, precision, and simplicity. XST builds on the strengths of the classic Super Trend indicator while incorporating advanced modifications that make it faster, smarter, and more adaptive to modern market dynamics. Why Choose XST? Enhanced Accuracy : With improved algorithms, XST reduces false signals and provides more re
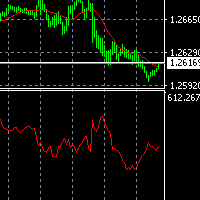
При большом количестве сделок автоматической торговли на различных валютных парах сложно оценить какие были убытки в прошедшем периоде в отсутствии наблюдения. Индикатор помогает проанализировать величину убытков на каждый момент времени в прошлом, когда завершенные ордера были активны, а так же величину убытков еще не завершенных ордеров. Его можно использовать для анализа размера депозита, необходимости увеличить депозит или наоборот возможности его уменьшить в соответствии с используемой стр

This is a trend scanner that uses the Forecast System technology. Link to the FREE version of the Forecast System --> https://www.mql5.com/en/market/product/110085?source=Site It scans up to 30 pairs for having an oversight of trending pairs and reversals. With this system you make every day about 10 profitable trades. The scanning comes with popup alert feature and mobile phone notifications. The scanner is free of charge for those who bought or rented the Forecast System. Please contact me

Parabolic SAR & Support/Resistance Levels는 외환 거래에서 잠재적인 추세 반전과 진입 및 종료 지점을 식별하는 데 사용되는 기술 분석 지표일 뿐만 아니라 기성 자율 거래 전략이기도 합니다.
이 지표는 PSAR 지표를 기반으로 차트에 동적 지원 및 저항 수준을 추가하여 트레이더가 시장이 잠재적으로 반전될 수 있는 주요 가격 수준을 식별하는 데 도움이 될 수 있습니다. 이 지표를 사용하면 트레이더는 시장의 강점과 방향, 거래의 잠재적인 진입 및 종료 지점에 대한 통찰력을 얻을 수 있습니다.
Parabolic SAR & Support/Resistance Levels 지표는 차트에 다양한 Parabolic Support and Resistance(PSAR) 수준을 표시하여 트레이더에게 잠재적인 추세 반전 신호를 제공하는 기술 분석 도구입니다. 이 지표는 MT4 차트 창에 수평으로 정렬된 일련의 선으로 표시되어 트레이더가 실제 PSAR 수준을 쉽게 식별할

The All Market Channels indicator from ProfRobotrading automatically builds and displays all formed trading channels on the screen. This indicator is very convenient for trading on all existing channel strategies and is applicable to all instruments and timeframes.
Look at the screenshot - it will tell you more :)
More information is available on our website ProfRoboTrading.
ProfRobotrading의 All Market Channels 지표는 모든 형성된 거래 채널을 자동으로 구축하여 화면에 표시합니다. 이 지표는 모든 기존 채널 전략에서 거래하는 데 매우 편리하며 모든 상품과
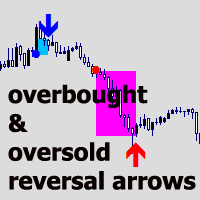
반전 추세를 검색하기 위한 지능형 알고리즘이 포함된 지표입니다. 증가된 변동성이 집중된 영역을 차트에서 찾습니다.
과매수 및 과매도 상태. 이 지표는 가격 움직임과 변동성을 분석하고 반전 추세의 구성 요소를 시작하며, 마지막에는 가격 반전이 발생할 가능성이 높습니다.
표시기는 두 가지 옵션을 제공합니다.
1. 과매수 또는 과매도 상태가 시작되는 순간, 가격 변동이 가장 심할 때
과매수 시작이 나타나 파란색 점이 나타나면, 파란색 반전점이 나타날 때까지 파란색 블록이 만들어지는 동안 매수를 할 수 있습니다. 과매도 시작이 나타나면 빨간 점이 나타나며, 반전 빨간 점이 나타날 때까지 핑크색 블록이 만들어지는 동안 매도할 수 있습니다.
2. 과매수 또는 과매도 상태 블록 이후 반전되는 순간.
파란색 블록이 생성되면 파란색 반전 지점 신호가 나타날 때까지 기다린 후 매도합니다. 손절매는 블록의 상위 레벨보다 약간 높으며, 이익 실현은 귀하의 재량에 따라 이루어집니다.

This is a Bollinger Bands Compression indicator. It detects volatility compression and the release of “suppressed momentum.” It can be used when it coincides with any specific trading entries — released volatility means a higher probability of making a decent profit. There is also a histogram with colored bands symbolizing weakness or strength, and a zero line crossover. Therefore, this indicator can be used both in conjunction with other indicators within trading strategies, and on its own meri

This is the MT4 Ichimoku Dashboard. This dashboard will scan multiple timeframes in MT5 platform, from M1 chart to D1 chart. It will send the buy/sell signals by alert on the platform or sending notification to your phone or message you via a email.
The buy/sell signal can be set by cross of multiple lines: ex: tenkan-sen line, kijun-sen line, the cloud or you can select the price to cross or above/below the kumo cloud... Please discovery in the input setting, You can find the rule that you are

The DMI MultiTimeframe EMA indicator is designed to facilitate multi-timeframe analysis by displaying a moving average from a specific timeframe (like H1 or D1) on any other chart timeframe. This tool allows traders to have a broader view across multiple timeframes directly on the current chart, enhancing precision and understanding of market trends. Parameters : Moving Average Timeframe : Sets the timeframe for the moving average, such as H1 for hourly or D1 for daily. Default: H1. Moving Avera

The Trend Ultimate Indicator is designed for visualizing and analyzing market trends, allowing traders to quickly assess current market tendencies. It is particularly useful for: Determining the duration of the current trend (bullish or bearish). Providing a clear visualization of price behavior relative to key moving averages and the MACD indicator. Supporting decision-making based on histogram dynamics (trend direction and intensity). Trend Ultimate does not guarantee profit but assists trader

This indicator combines two tools: MACD and OsMA . MACD is displayed as two lines: The black line represents the main MACD line. The orange line represents the MACD signal line. OsMA Histogram is shown in two colors: Green bars indicate growth. Red bars indicate decline. You can customize the line colors and thickness in the settings. This indicator serves as an addition to the Combo View Impulse System indicator but can also be used independently. Parameters: Fast EMA period (12) – The short

The Ligma Binary Indicator is a sophisticated tool designed to assist traders in identifying key price action patterns that offer high-probability trade opportunities. This indicator is based on a unique strategy that detects isolated candles or “lonely” candles, which occur in trending markets and are often followed by strong price reversals or continuations. Key Features: Trend Detection: The indicator uses a Simple Moving Average (SMA) to identify the prevailing market trend (uptrend or downt
This is the ADX Dashboard MT5. This dashboard will scan multiple timeframes in MT4 platform, from M1 chart to D1 chart. It will send the buy/sell signals by alert on the platform or sending notification to your phone or message you via a email.
The buy signal is the cross over of DI+ and DI- The sell signal is the cross under of DI+ and DI-.
The up trend color will be displayed when DI+ is greater than DI- The down trend color will be displayed when DI+ is less than DI- The value of ADX value wi
This is the Super Trend Dashboard MT4. This dashboard will scan multiple timeframes in MT4 platform, from M1 chart to D1 chart. It will send the buy/sell signals by alert on the platform or sending notification to your phone or message you via a email.
The buy signal is generated when the super trend line flip from SELL to BUY. The sell signal is is generated when the super trend line flip from BUY to SELL.
The up trend color will be displayed depending on the current Super Trend value.
Индикатор LiquidityDWM отображает на графике не перекрытую дневную, недельную, месячную ликвидность и предназначен для определения предрасположенности направления ценового движения. В концепции движения цены рынок всегда стремиться в сторону ликвидности для ее снятия, поэтому для торговли очень важно знать рыночную предрасположенность движения цены. Индикатор LiquidityDWM покажет вам самые важные уровни ближайшей ликвидности, куда стремиться рынок в первую очередь. Знание первоочередной цели д
This is the Heiken Ashi Dashboard MT4. This dashboard will scan multiple timeframes and symbols in MT4 platform, from M1 chart to D1 chart. It will send the buy/sell signals by alert on the platform or sending notification to your phone or message you via a email.
The buy signal is generated when the heiken ashi bar changes its color from red to white. The sell signal is is generated when the heiken ashi bar changes its color from white to red. The up/down trend color will be displayed depend

This indicator combines several functionalities: Value Zone Displays two exponential moving averages (EMAs): 13-period EMA in red. 22-period EMA in blue. Impulse System (based on Dr. Alexander Elder's methodology) Candles are color-coded to indicate trade restrictions: Red candles prohibit buying. Green candles prohibit selling. Blue candles allow both buying and selling. Recommended for use on two timeframes for enhanced analysis. 3x ATR Channel A channel based on 3 times the ATR (Average True
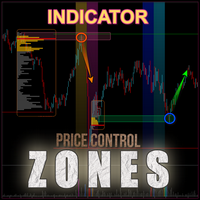
The Bull and Bear Zones indicator is specifically designed for the automatic identification and visual display of support and resistance zones directly on the chart. Its unique algorithm allows it to display not only the zones already tested by the market but also potential target zones that have yet to be tested. The indicator tracks ranges where an imbalance between supply and demand is observed. Key Features: Automatic identification of support and resistance zones : The indicator calculates

MarketEcho Signals is a powerful and innovative technical analysis tool designed to identify high-probability buy and sell signals in the financial markets. By combining trend-following indicators with price action patterns, this indicator helps traders navigate volatile markets with ease. It is based on a 25-period Exponential Moving Average (EMA) to filter trends, ensuring that trades are taken in the direction of the overall market momentum. Key Features : Trend Filter with EMA :
The MarketEc

High, Low, Open, and Close of Candles: Utilizing the Bombafkan Indicator Tool With the Bombafkan Indicator, you can easily view the high, low, open, and close of candles and analyze this price information across different timeframes. This feature helps you perform more accurate analyses and optimize your trading strategies with a comprehensive view of price movements. Additionally, the Bombafkan Strategy includes a setup called the "Candle-Side Signal," which allows you to easily take bu
Enhance your trading with visual clarity — identify trends instantly with dynamic EMA ribbons! Description:
The DMI Dynamic EMA Ribbon is an advanced indicator designed to help traders visualize trend direction and strength using two dynamic exponential moving averages (EMAs). With customizable parameters, this tool enhances your ability to make informed trading decisions by clearly indicating bullish and bearish trends. Key Parameters: Customizable timeframe for moving averages. Period for the

This updated version of the Value Chart indicator introduces new parameters in the way the indicator is calculated. Its main objective is to analyze the current range and attempt to predict the direction of the ongoing candle, displaying an arrow indicating where the candle is expected to move. The calculation structure is based on the last 1,000 candles. First, a weighted average is calculated for each candle. Then, the modified Value Chart calculation is applied to determine the range and str
DMI Smoothed CCI plus: Track Market Trends and Reversals Across Multiple Timeframes The DMI Smoothed CCI plus is a powerful tool for traders, designed to analyze market trends and potential reversals using the Commodity Channel Index (CCI) across multiple timeframes. Ideal for trend-following strategies, this indicator helps you spot overbought and oversold conditions, providing real-time insights that are crucial for optimizing your market entries and exits. Key Features: Multi-Timeframe Analy

What are Fair Value Gaps (FVG)? Fair Value Gaps occur when price moves so quickly that it creates an imbalance between buyers and sellers. These gaps represent areas where price "skipped" levels, creating potential zones for price to return and "fill the gap". Think of it as unfinished business in the market that often gets revisited. They are also considered a support or resistance area because it represents a zone on a chart where there is a significant imbalance between supply and demand, ca
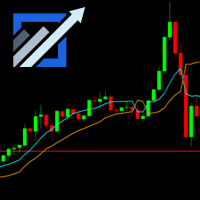
Boost your trading accuracy with the SSL Channel Indicator , designed to identify trends and precise entry points. This dynamic tool adapts to all trading instruments and timeframes. Perfect for scalpers, day traders, and swing traders, the SSL Channel Indicator simplifies market analysis, helping you trade confidently and effectively. Unlock your trading potential today! MT5 Link- https://www.mql5.com/en/market/product/127492
SmartTrend is an indicator that uses artificial intelligence algorithms to optimize trading in the Forex market. It offers traders opportunities to adapt their strategies to market conditions. Key Features of SmartTrend: 1. Automatic StopLoss Calculation : o The indicator determines StopLoss levels based on current volatility, helping to minimize risks. 2. Emergency StopLoss Function : o Activated when market trends change, providing an additional level of protection. 3.

Everyone has heard that 95% of traders lose money, well join the 5% profitable one with 'The 5 Percent.
The 5 Percent Indicator: Join the Elite 5% of Traders. Manage risk and stay in the game by following the trends. Tired of being part of the 95% who lose money? The 5 Percent Indicator is your key to unlocking consistent profitability. This powerful tool provides clear, actionable signals, helping you make informed trading decisions and maximize your returns. Don't miss out on your chance to j

If you ever wanted to know your local time (or NY time) at any bar on the chart without needing to waste time with mental calculations, look no further.
This indicator creates a crosshair which you can drag anywhere on the chart and will show you the local time in a label on top of the time axis.
Press the "c" key to show/hide the crosshair. Left click it to pick it up and drag anywhere, left click again let it go.
You can't hide the crosshair without letting it go first.
Time setting inputs
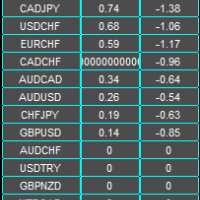
Abbeyfx Swap Dashboard displays your broker swap/interest rate. The implied swap/interest rate differential is for all currency pairs you have in your market watch.
Interest rate differential: The key factor traders consider is the difference in interest rates between two currencies involved in a pair, known as the "interest rate differential
Impact on currency value: A higher interest rate typically makes a currency more attractive, causing its value to rise relative to other currencies with
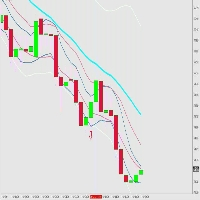
Signal Entry BBMA Low Risk High Reward Entry Friendly Use Using Fibo for TP 1, TP 2 , TP 3 , TP 4, TP 5, TP 6 , TP 7 , TP 8 , TP 9 , TP 10 Entry Low MA or Entry High MA Pair GOLD is The Best Pair EURUSD, GBPUSD, USDJPY Is Good Pair BTCUSD id Good Risk Manajemen only 1% entry and you get Profit 2-10% Recommended Broker https://one.exnesstrack.org/a/yyatk129ng If you want FullMargin Is Good but I recommended using Manajemen your Money
Old Time Frame EMA Индикатор двух динамических уровней сопротивления и поддержки Moving Average.
Данный индикатор рисует на открытом графике младшего тайм фрейма, ЕМА со старшего тайм фрейма. Создан для наглядности сигналов, для входа в рынок, для тех трейдеров, у кого Средние Скользящие Цены (ЕМА или МА),
являются основным сигналом для открытия или закрытия сделок. А также ориентиром, направлением тренда в движении
текущих цен, внутри дня и в среднесрочной торговле.
Возможные типы сред
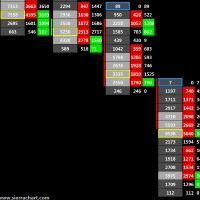
Volume Cluster Indicator for MetaTrader 4: Advanced Analysis of Support, Resistance, and Market Dynamics The Volume Cluster Indicator for MetaTrader 4 is a powerful tool designed for traders seeking an in-depth understanding of market dynamics. It provides detailed insights into volume behavior within each candlestick, highlighting levels where volume is "overpriced" and areas of weakness. This enables precise identification of support and resistance zones, making it indispensable for traders le
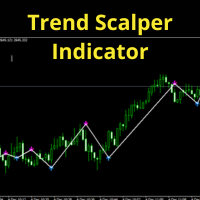
주요 기능: 패턴 자동 인식: AI가 시장 움직임을 실시간으로 분석하여 높은 성공 확률의 반복 패턴을 식별합니다. 삼각형, 깃발, 헤드앤숄더와 같은 전통적인 패턴은 물론, AI가 탐지하는 섬세한 패턴도 인식 가능합니다. 매수 및 매도 신호 제공: 매수는 녹색 화살표 , 매도는 빨간색 화살표 로 차트에 표시하며, 소리 알림과 푸시 알림으로 신속하게 정보를 전달합니다. 자동 추세선 그리기: 지지선 과 저항선 을 자동으로 그려, 반전 지점과 추세 수렴 지점을 식별합니다. 다중 시간대 지원: 저시간대(M1, M5, M15) 스캘핑에 최적화되어 있으며, 단기 분석에도 효과적입니다. 사용자 친화적인 인터페이스: 간단하고 직관적인 디자인으로 손쉬운 조작 과 맞춤 설정이 가능합니다. 돌파 및 되돌림 탐지: 트렌드 돌파와 되돌림을 자동으로 구별하여 빠른 전략 수립에 필요한 정보를 제공합니다. 고급 알림 기능: 팝업, 이메일, 푸시 알림으로 실시간 알림을 제공해 중요한 기회를 놓치지 않습니다. 지표의
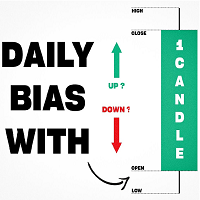
Inspired by TTrades video on daily bias, this indicator aims to develop a higher timeframe bias and collect data on its success rate. While a handful of concepts were introduced in said video, this indicator focuses on one specific method that utilizes previous highs and lows. The following description will outline how the indicator works using the daily timeframe as an example, but the weekly timeframe is also an included option that functions in the exact same manner.
On the daily timefr

This custom indicator for MetaTrader 4 is a powerful tool designed to help traders of all experience levels identify clear trends in the financial market. It is built to provide precise visual support, eliminating the confusion and subjectivity often associated with chart analysis. Additionally, it ensures that you can stay in a profitable position throughout the entire duration of a trend, avoiding premature exits before the movement is fully realized. Identifying Clear Trends The foundation o

The Market Heart indicator scans market entries after high volatility is noticed. Most big moves occur a short time after market volatility. Most big moves occur a short time after market volatility. The idea is to look for entries after the rectangles form and not necessarily as trade entry signals. . For example, you could use the Retracement Feeder indicator that generates arrow signals.
Market Heart MT5 Version
How to use: 1. Primary use The White Box is the first to be formed and

This Simple Smart Money Concepts indicator displays real-time market structure (internal & swing BOS / CHoCH), order blocks, premium & discount zones, equal highs & lows, and much more...allowing traders to automatically mark up their charts with widely used price action methodologies.
"Smart Money Concepts" (SMC) is used term amongst price action traders looking to more accurately navigate liquidity & find more optimal points of interest in the market. Trying to determine where institutional

EMA Cloud System is a Trading System Invented by Ripster where areas are shaded between two desired EMAs. The concept that the EMA cloud area serves as support or resistance for Intraday & Swing Trading. Can be utilized effectively on 10 Min for day trading and 1Hr/Daily for Swings. Ripster utilizes various combinations of 5-12 EMA clouds 34-50 EMA clouds among others. 8-9, 20-21 EMA clouds can be used as well. Adjust what works for you. Ideally 5-12 or 5-13 EMA cloud acts as sold fluid Trendlin
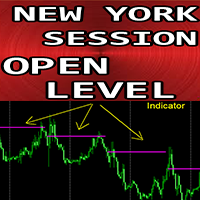
MT4용 외환 지표 "뉴욕 세션 오픈 레벨"
지표 "뉴욕 세션 오픈 레벨"은 일중 거래에 매우 유용한 보조 지표입니다. 세션 오픈 가격 레벨은 매우 중요한데, 가격이 하루 중 해당 영역으로 돌아오는 경우가 매우 많기 때문입니다. 지표는 매일 NY 세션 오픈 가격 레벨을 보여줍니다. 지표는 월요일에 주간 오픈 레벨도 보여줍니다. 일중 거래자가 타겟을 설정하거나 지지/저항 영역으로 사용하는 데 유용합니다. ..................................................................................................................................................... // 더 많은 훌륭한 전문가 자문가와 지표는 여기에서 확인할 수 있습니다. https://www.mql5.com/en/users/def1380/seller 이 MQL5 웹사이트에서만 제공되는 오리지널 제품입니다.
MT4용 Binary exfish 인디케이터 Binary exfish 인디케이터는 바이너리 옵션 거래를 위해 설계되었으며, M1 및 M5 타임프레임에서 작동합니다. 모든 통화 쌍에서 사용 가능하며, 추세를 분석하고 차트에 화살표 형태의 진입 신호를 제공합니다: 파란 화살표 — 매수 신호 빨간 화살표 — 매도 신호 특징: 기본 만료 시간 : 1 캔들 조정 가능한 만료 시간: 1~3 캔들 현재 캔들이 마감되기 전에 신호가 표시되어 신속한 결정을 지원합니다. 알림은 사운드, 팝업, 이메일, 모바일 앱 메시지를 포함합니다. 설치 및 사용: 올바른 작동을 위해 MQL5 폴더 를 다운로드하여 MT4 터미널 폴더에 추가하세요. 설치 가이드는 여기에서 확인하세요: 비디오 링크 . 팝업 알림을 받으려면 추가 인디케이터를 사용하세요: 여기에서 다운로드 . Binary exfish 인디케이터는 트렌드 기반 거래에 적합하며, 명확하고 정확한 신호를 제공하여 성공적인 진입을 지원합니다.
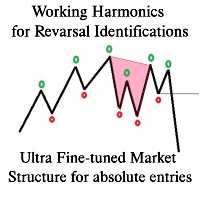
Last & Ultimate Indictor a trader would ever need while trading.
Confirmation Based Harmonic Patterns for Trend Reversal Identification .
Ultra finetuned Candle Based Market structure(not pivot or average based like other noisy indicators) for a sniper & confirmational Entry Added false breakout entry for dual parameter low risk entry
This is the finest structure marking you will ever find in any market. indicator is coded based on actual candle breaks and not coded base

The "BioStar" indicator is an innovative tool for trend analysis on the Forex market. It has unique capabilities and a wide range of settings that will help traders make informed decisions when trading.
This indicator is based on the analysis of the market trend and helps to identify the direction of price movement. It uses various mathematical algorithms and statistical methods to determine the strength and stability of the trend in the market.
One of the key features of the "BioStar" indica
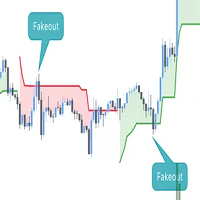
This script is an enhanced version of the classic Supertrend indicator. It incorporates an additional feature that ensures trend reversals are more reliable by introducing a Fakeout Index Limit and a Fakeout ATR Mult. This helps avoid false trend changes that could occur due to short-term price fluctuations or market noise. In smart money concept, when institute , "big-fish" want to buy, they usually sell first to take sellside liquidity and vice versal. This is why the indicator become importan

Super Scalp Indicator MT4 is a unique trend reversal 100% non-repainting multi-algo indicator that can be used on all symbols/instruments: forex, commodities, cryptocurrencies, indices, stocks . Super Scalp Indicator MT4 will determine the current trend at its early stages, gathering information and data from up to 10 standard algos When indicator give a valid buy or sell signal, a corresponding arrow will be printed on the chart, open trade at start of the next candle/bar
THER IS ERREUR WHILE UPLOADING THE FILE PLEAS CONTACT ME FOR FREE TRIAL RYUKAI HADOO is a professional and easy to use Forex trading system which is based on the best principles of trading using the best estrategys. The indicator provides accurate BUY and SELL signals including Stop Loss and Take Profit levels. You can trade even on the go using PUSH notifications. PLEASE CONTACT ME AFTER PURCHASE TO GET MY TRADING TIPS! If you're familiar with trading, you’ve likely come across popular strate
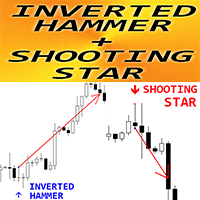
MT4용 외환 지표 "역망치 및 슈팅 스타 패턴"
- "역망치 및 슈팅스타 패턴" 표시기는 가격 행동 거래에 대한 매우 강력한 표시기입니다. 다시 칠할 필요도 없고 지연도 없습니다. - 지표는 차트에서 강세 반전 망치 패턴과 약세 슈팅 스타 패턴을 감지합니다. - Bullish Inverted Hammer - 차트의 파란색 화살표 신호(사진 참조) - Bearish Shooting Star - 차트의 빨간색 화살표 신호(사진 참조) - PC, 모바일, 이메일 알림이 포함되어 있습니다. - 표시기 "역망치 및 슈팅스타"는 지원/저항 수준과 결합하는 데 탁월합니다.
// 더 훌륭한 전문가 자문 및 지표는 여기에서 확인할 수 있습니다: https://www.mql5.com/en/users/def1380/seller 본 MQL5 홈페이지에서만 제공되는 오리지널 제품입니다.

Moving average alert plus is an advance moving average alert that will easily monitor the price action based on set moving averages to multiple open charts. Objective: To monitor multiple open charts and notify traders conveniently in a single display panel when using the moving averages to enter/exit a trade. Features: Monitor price action in two timeframes at the same time Supports simple, exponential, smoothed, linear weighted moving averages Trigger an alert based on candle size (full/

This product enables you to trade in opportunities that are detected by the indicator. Using advanced Calculations and formulae this product enables you to profit from trend opportunities. Trend master has Channels that show areas the trend is strong and you are likely to profit. Once this zone Is breached the price is on in uncertain territory and there is no guarantee the trend will continue This means there might be reversal and it is advisable to exit a trade here.

Do you want to beat the market? This indicator uses advanced mathematical formulae That include regression analysis to predict market trends. So what happens is That when the price is above the indicator line as depicted in the screenshot The trend is rising and when the price is below the indicator line the Trend is falling. This opportunities appear multiple times each day enabling You to profit. This indicator makes the trend your friend.
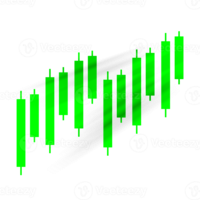
Bollinger trading is an indicator for mt4 that uses Bollinger bands and other trend following strategies To detect the direction of the market. Just as attached in the screenshot the light blue line shows areas The market is rising. This means opening positions here is in the direction of the trend. The dark blue lines cane be used for sell trades when the market moves in the opposing direction. Using this tactics you can have a clear sense of where the market is headed.
MetaTrader 마켓은 개발자들이 거래 애플리케이션을 판매할 수 있는 간단하고 편리한 사이트이다.
제품을 게시하고 마켓용 제품 설명을 어떻게 준비하는가를 설명하는 데 도움이 됩니다. 마켓의 모든 애플리케이션은 암호화로 보호되며 구매자의 컴퓨터에서만 실행할 수 있습니다. 불법 복제는 불가능합니다.
트레이딩 기회를 놓치고 있어요:
- 무료 트레이딩 앱
- 복사용 8,000 이상의 시그널
- 금융 시장 개척을 위한 경제 뉴스
등록
로그인
계정이 없으시면, 가입하십시오
MQL5.com 웹사이트에 로그인을 하기 위해 쿠키를 허용하십시오.
브라우저에서 필요한 설정을 활성화하시지 않으면, 로그인할 수 없습니다.