• 미리보기
  • 리뷰
  • 코멘트 (3)

Multi Timeframe Moving Averages

MTFMA(멀티 타임프레임 이동 평균선) 지표는 여러 시간대의 여러 이동 평균선(MA)을 사용하여 주 차트와 별도의 창에서 매수 및 매도 신호(재도색하지 않음)를 제공합니다. 이 지표는 다용도이며 해석하기 쉬워 작은 시간대의 스캘핑과 큰 시간대의 장기 거래 모두에 적합합니다.

왜 멀티프레임인가요?

멀티프레임이라는 용어는 지표가 여러 시간대의 데이터를 사용하고 결합할 수 있는 능력을 나타냅니다. MTFMA는 네 개의 구성 가능한 이동 평균선(MA)에 기반하여 신호를 계산하고 표시합니다. 각 MA는 다른 기간, 계산 방법 및 가격 유형에 맞게 조정할 수 있어 트레이더가 하나의 차트에서 단기 및 장기 트렌드의 조합을 볼 수 있도록 합니다.

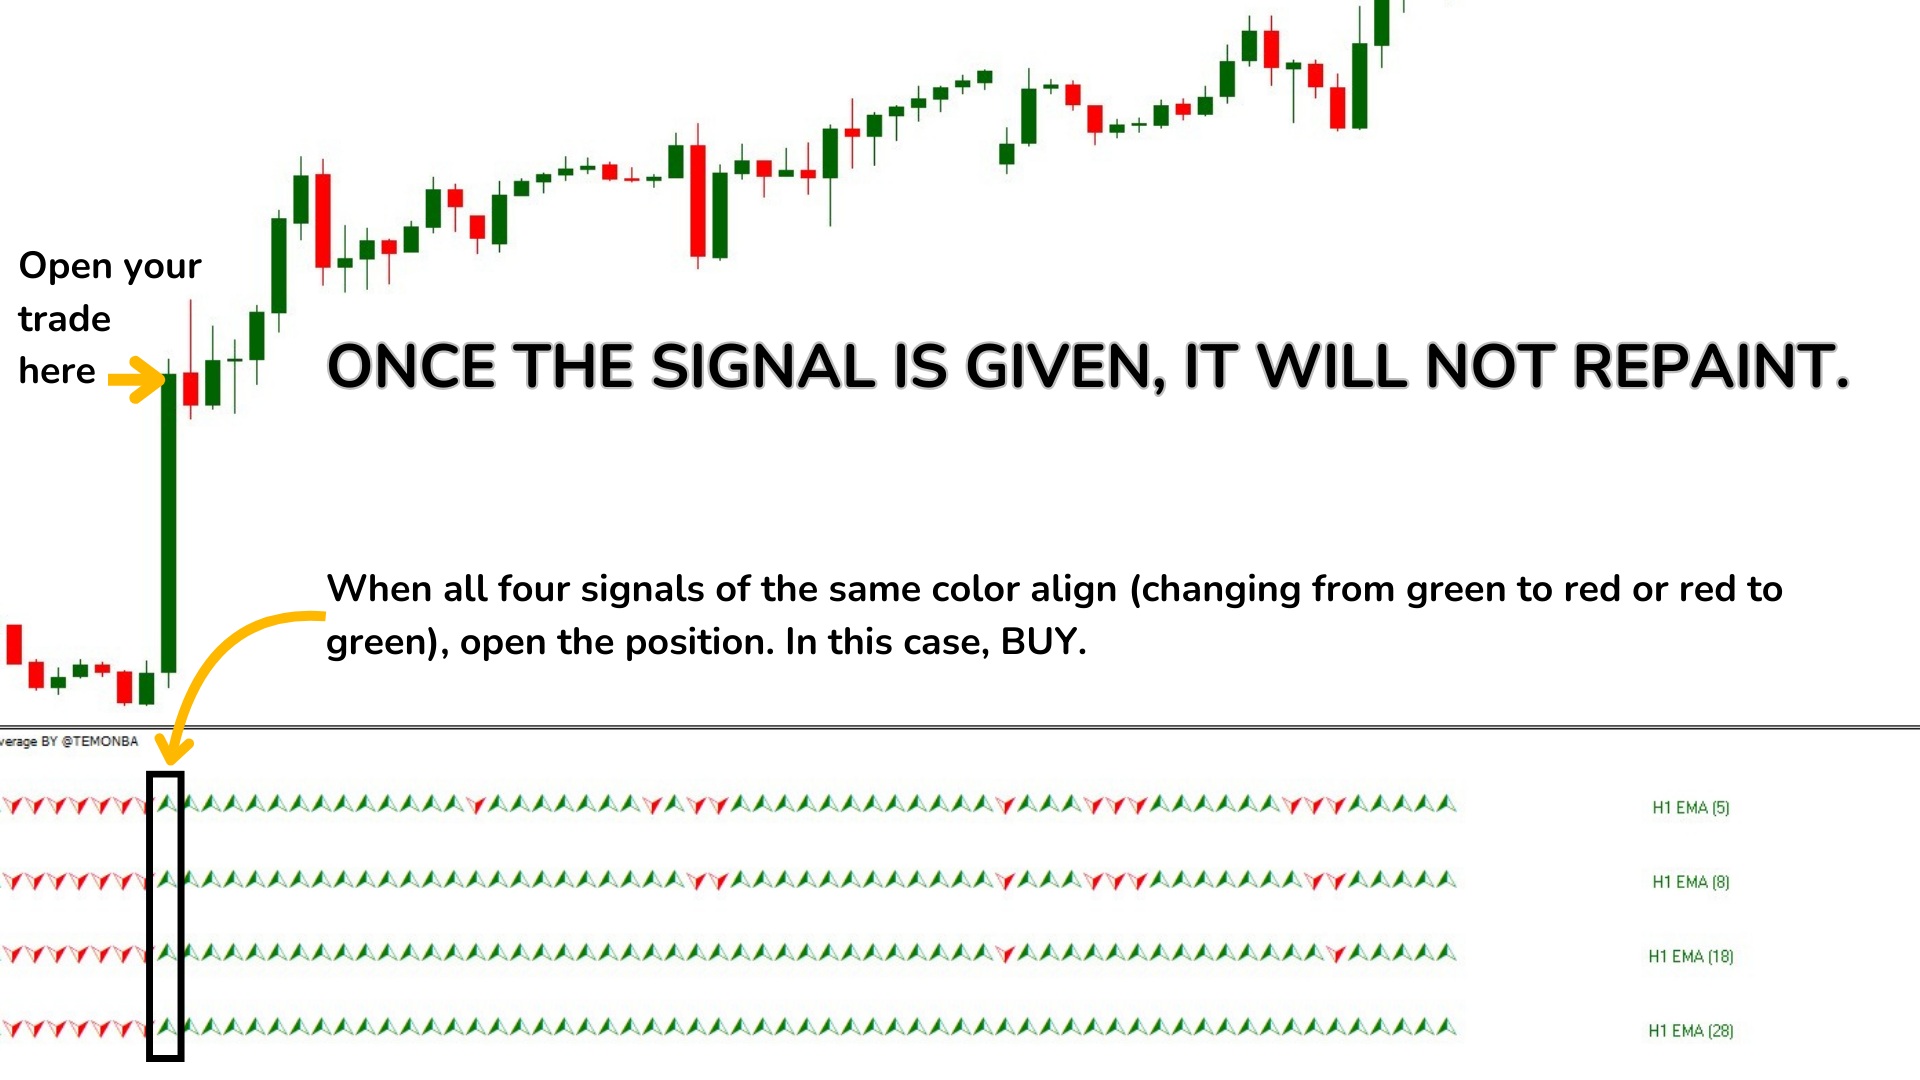
중요 포인트: 다용도성: 분 단위부터 월 단위까지 모든 시간대에 사용 가능하며, 스캘핑과 장기 거래 모두에 적합합니다. 재도색하지 않음: 한 번 신호(위쪽 또는 아래쪽 화살표)가 생성되면 색상이 변하지 않아 트레이더가 생성된 신호를 신뢰하고 거래 결정을 내릴 수 있습니다. 해석 용이성: 매수 및 매도 신호는 하단 지표에 녹색 및 빨간색 화살표로 명확하게 표시되어 복잡한 분석이 필요하지 않습니다. 구성 가능성: 사용자는 특정 거래 전략에 맞추어 이동 평균선의 매개변수를 조정할 수 있습니다.

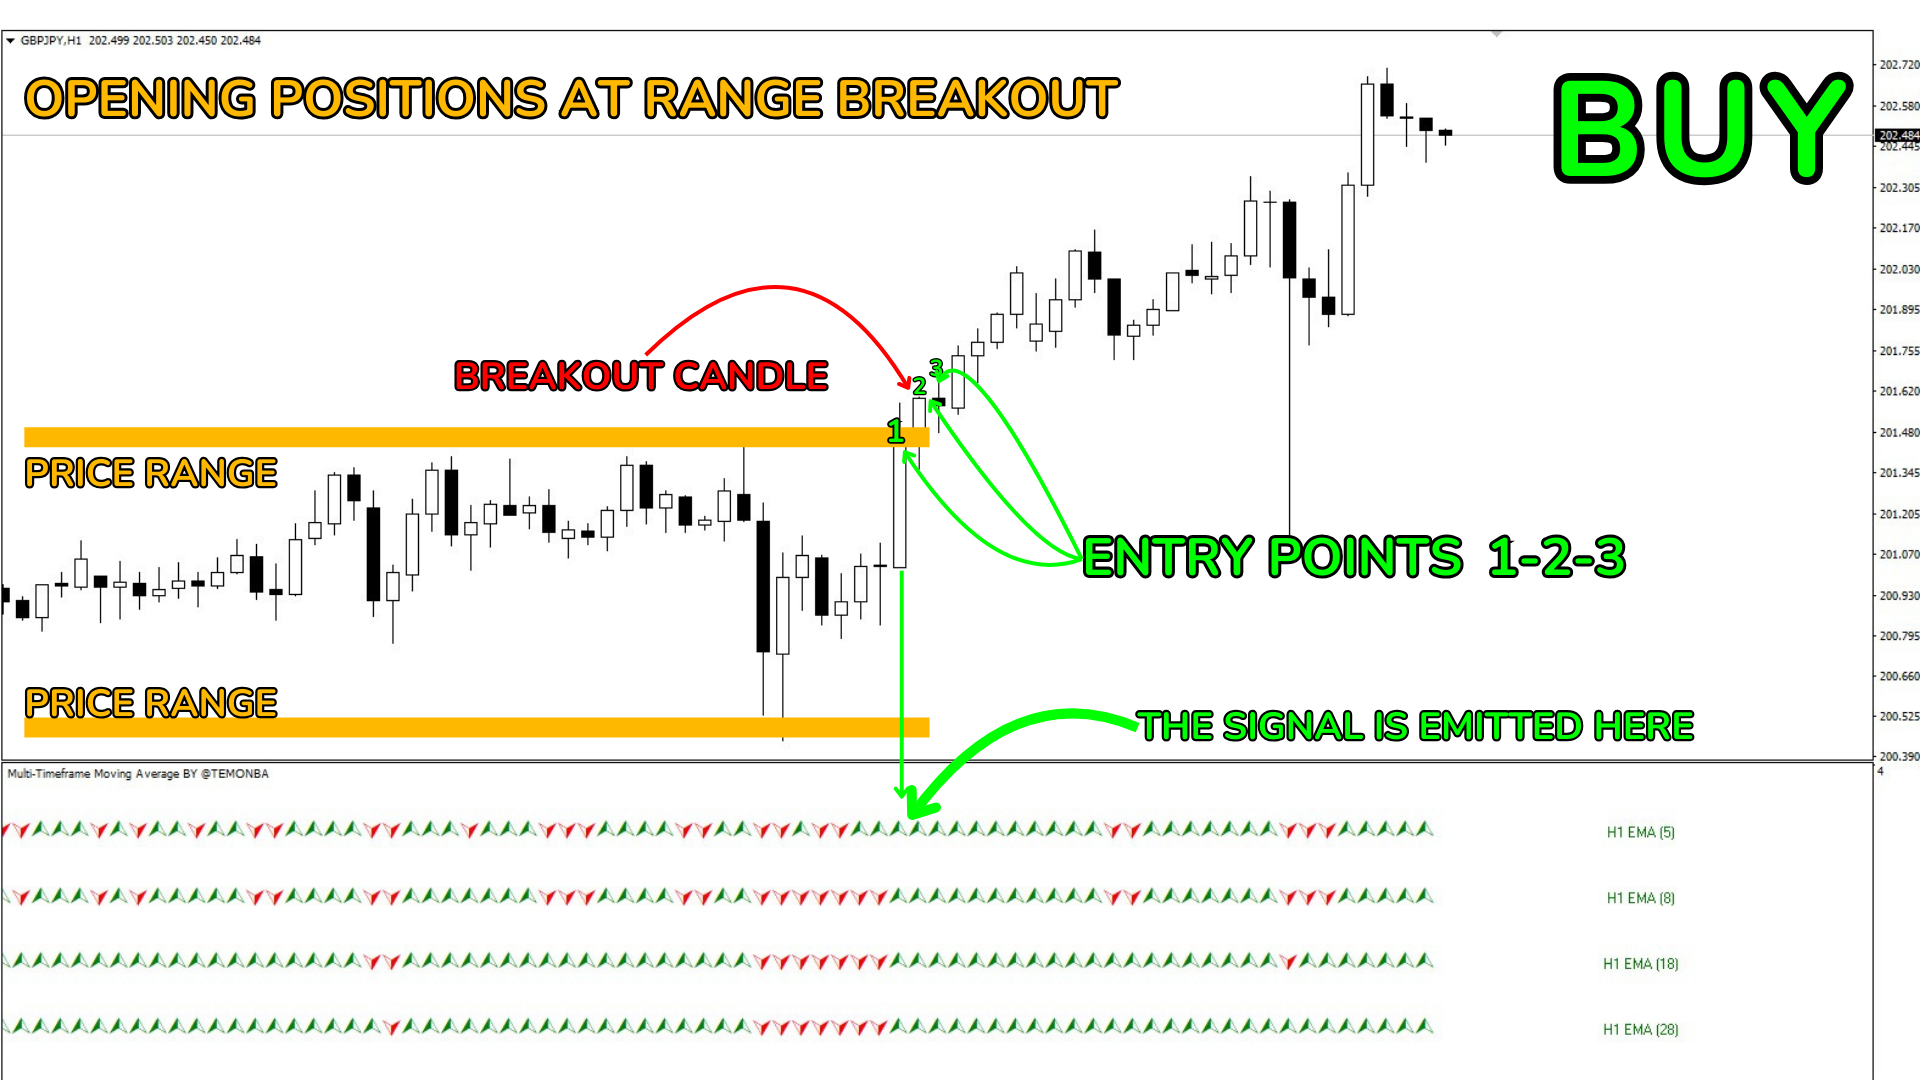
향상된 전략: 안전한 진입을 위해서는 네 개의 EMA가 모두 동일한 색상으로 변할 때까지 기다리는 것이 좋습니다. 가장 좋은 진입은 네 개의 EMA가 색상을 변경한 첫 번째 또는 두 번째 캔들에서 이루어집니다.

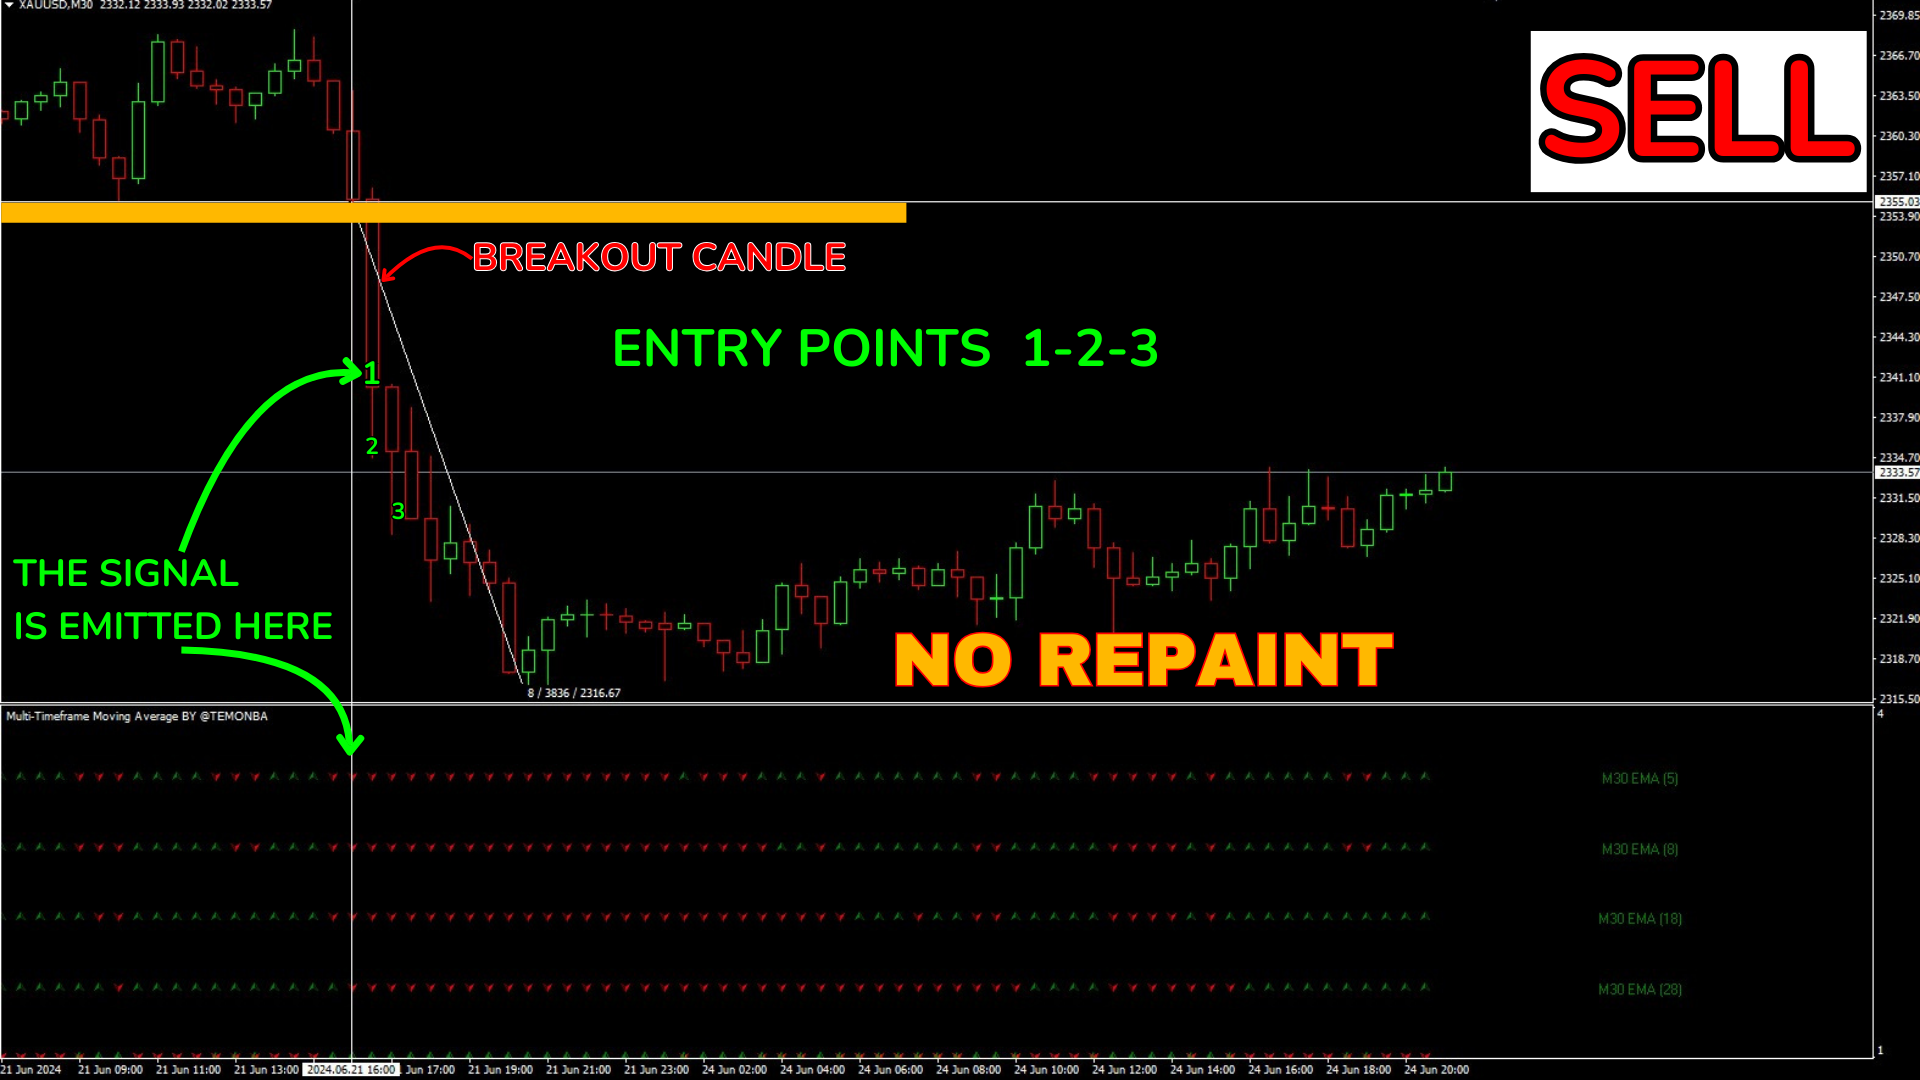
범위 돌파와 일치하는 경우에만 4개의 EMA 색상 일치 후 최대 4개 또는 5개의 캔들까지 포지션을 열 수 있습니다. 이와 같은 늦은 진입은 명확한 가격 범위 돌파가 있을 때만 할 수 있습니다. 이를 감지하지 못하는 경우, 첫 번째 또는 두 번째 캔들에서 거래하는 것에 제한하세요.

모든 경우에 이미 진행된 트렌드에서 거래하는 것을 피하세요(예: 동일한 색상의 캔들이 10개 이상 지나간 경우), 트렌드가 계속될 가능성이 낮습니다.

따라서:

매수: 모든 EMA가 녹색으로 변합니다. 매도: 모든 EMA가 빨간색으로 변합니다.

지표 사용 방법:

스캘핑용(작은 시간대, 예: M1, M5, M15):

매수 신호 및 매도 신호: 개장은 EMA 트렌드에 따라 "캔들별"로 진행하며, 짧은 거래를 열고 빠르게 몇 핍을 얻습니다. 물론 이 기술을 실행하려면 스캘핑 계좌가 필요합니다. 즉, 스탠다드 또는 센트 계좌로 스캘핑을 원한다면, 일부 통화 쌍은 스프레드가 크므로 작동하지 않을 것입니다. 스캘핑 전용 계좌(ECN 또는 제로 스프레드)만 사용하세요.

장기 거래용(큰 시간대, 예: H1, H4, D1):

매수 신호: 모든 EMA가 녹색으로 변합니다. 모든 네 개의 EMA가 녹색인 첫 번째 캔들에서 진입하세요. 매도 신호: 모든 EMA가 빨간색으로 변합니다. 모든 네 개의 EMA가 빨간색인 첫 번째 캔들에서 진입하세요. 큰 시간대에서는 신호가 적지만 더 중요해져서 더 큰 시장 움직임을 포착하고 포지션을 더 오래 유지할 수 있습니다.

경험이 없는 경우 거래 방법:

매수:

모든 EMA가 녹색으로 변할 때까지 기다리세요. 모든 EMA가 녹색인 첫 번째 캔들에서 매수 포지션(Buy)을 여세요. 마지막 주요 지지선 아래에 스탑로스를 설정하세요. 모든 EMA가 빨간색으로 변하면 포지션을 종료하거나 매도를 고려하세요. 매도:

모든 EMA가 빨간색으로 변할 때까지 기다리세요. 모든 EMA가 빨간색인 첫 번째 캔들에서 매도 포지션(Sell)을 여세요. 마지막 주요 저항선 위에 스탑로스를 설정하세요. 모든 EMA가 녹색으로 변하면 포지션을 종료하거나 매수를 고려하세요. 결론적으로, MTFMA는 강력하고 다용도적인 지표입니다. 초보자부터 고급 트레이더까지 모두 지표의 외부 매개변수를 통해 100% 구성 가능합니다.

MTFMA가 재도색하지 않는 이유는 무엇인가요? 종가 기준 계산:

MTFMA 지표는 현재 형성 중인 캔들이 아닌 종가 기준으로 값을 계산합니다. 내부 코드에서는 limit - 1에서 0까지의 루프에서 계산이 실행되어 변경되지 않는 과거 데이터를 사용하는 것을 보장합니다.

출력 버퍼 및 빈 값:

지표는 계산된 값을 저장하기 위해 버퍼(MA1_UP_Buffer, MA1_DN_Buffer 등)를 사용합니다. 이러한 버퍼는 루프의 각 반복 시 업데이트되며, 특정 조건을 충족하는 경우에만 값이 설정됩니다(예: 현재 EMA가 이전 EMA보다 큰 경우). 값이 버퍼에 들어가면 변경되지 않아 생성된 신호가 일정하게 유지됩니다.

이동 평균 값 비교:

매수 및 매도 신호 계산은 현재 캔들과 이전 캔들의 이동 평균 값 비교를 기반으로 합니다. 이러한 비교는 캔들이 종료된 후 수행되며, 비교에 사용되는 값이 변경되지 않도록 보장합니다.

고정 조건 기반 색상 할당:

레이블 및 신호의 색상은 고정 조건에 따라 할당됩니다(예: 현재 EMA가 이전 EMA보다 큰 경우 신호 버퍼에 특정 값이 설정됨). 이러한 할당은 한 번 이루어지면 변경되지 않으며 신호의 일관성을 보장합니다.

구성 매개변수:

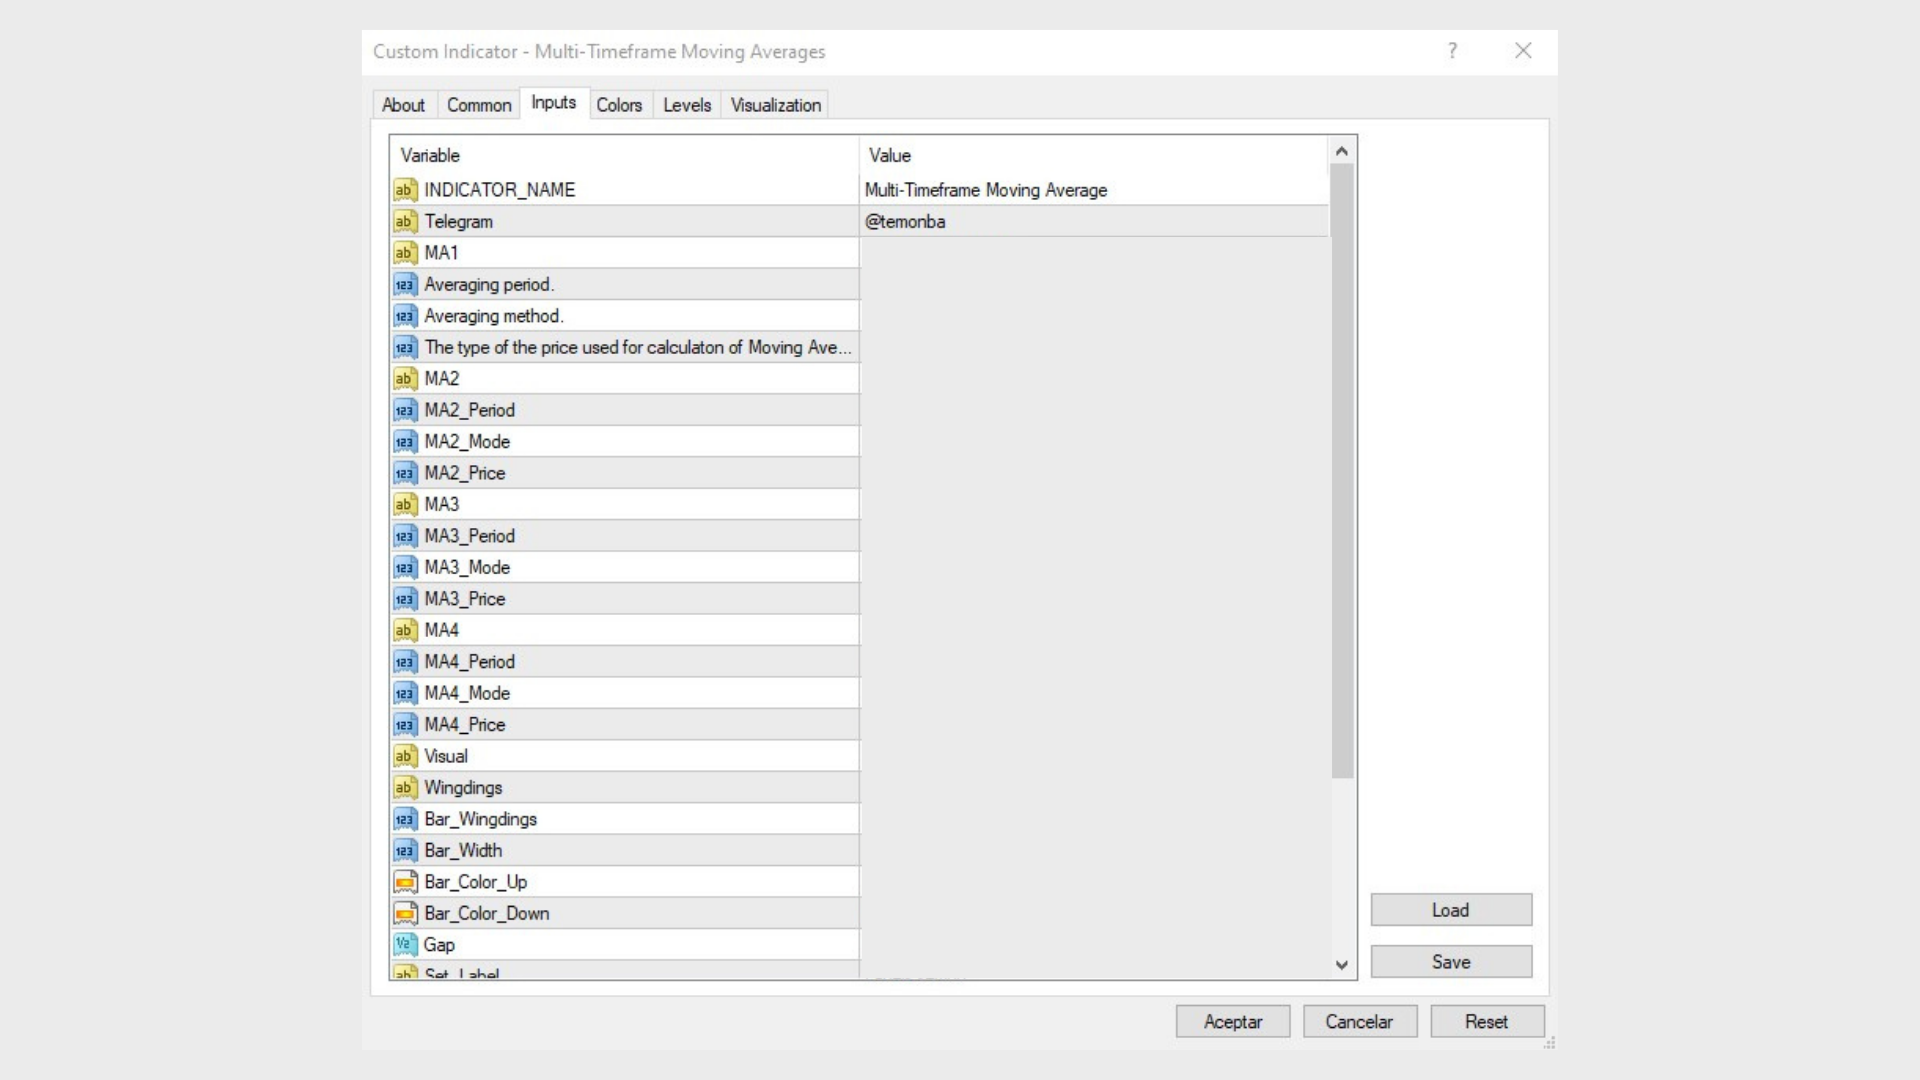
  1. MA1 (첫 번째 이동 평균) 평균 기간(MA1_Period): 첫 번째 이동 평균의 평균 기간. 이 매개변수는 이동 평균을 계산하는 데 사용할 데이터 기간 수를 결정합니다. 이 경우 5입니다. 평균 방법(MA1_Mode): 이동 평균을 계산하는 데 사용되는 평균 방법. 일반적인 값은 다음과 같습니다. 0: 단순 이동 평균(SMA) 1: 지수 이동 평균(EMA) 2: 평활화 단순 이동 평균(SSMA) 3: 선형 가중 이동 평균(LWMA) 이동 평균 계산에 사용되는 가격 유형(MA1_Price): 이동 평균 계산에 사용되는 가격 유형. 일반적인 값은 다음과 같습니다. 0: 종가(Close) 1: 시가(Open) 2: 최고가(High) 3: 최저가(Low) 4: 중간가(Median) 5: 일반 가격(Typical) 6: 가중 가격(Weighted)
  2. MA2 (두 번째 이동 평균) MA2_Period: 두 번째 이동 평균의 평균 기간. 이 경우 8입니다. MA2_Mode: 두 번째 이동 평균을 계산하는 데 사용되는 평균 방법. 이 경우 EMA(1)입니다. MA2_Price: 두 번째 이동 평균을 계산하는 데 사용되는 가격 유형. 이 경우 가중 가격(6)입니다.
  3. MA3 (세 번째 이동 평균) MA3_Period: 세 번째 이동 평균의 평균 기간. 이 경우 18입니다. MA3_Mode: 세 번째 이동 평균을 계산하는 데 사용되는 평균 방법. 이 경우 EMA(1)입니다. MA3_Price: 세 번째 이동 평균을 계산하는 데 사용되는 가격 유형. 이 경우 가중 가격(6)입니다.
  4. MA4 (네 번째 이동 평균) MA4_Period: 네 번째 이동 평균의 평균 기간. 이 경우 28입니다. MA4_Mode: 네 번째 이동 평균을 계산하는 데 사용되는 평균 방법. 이 경우 EMA(1)입니다. MA4_Price: 네 번째 이동 평균을 계산하는 데 사용되는 가격 유형. 이 경우 가중 가격(6)입니다.
  5. 시각적 (표시 매개변수) Wingdings: 매수 및 매도 신호를 나타내는 화살표 유형의 기호 선택. 0: 직사각형. 1: 화살표. Bar_Wingdings: 사용되는 특정 기호 유형. Bar_Width: 차트에 표시되는 화살표 또는 기호의 너비. Bar_Color_Up: 위로 가는 화살표 또는 기호에 사용되는 색상(매수를 나타냄). 이 경우 녹색입니다. Bar_Color_Down: 아래로 가는 화살표 또는 기호에 사용되는 색상(매도를 나타냄). 이 경우 빨간색입니다. Gap: 차트에서 화살표 또는 기호 사이의 수직 거리.
  6. Set_Label (레이블 설정) Show_Label: 텍스트 레이블을 표시하거나 숨기는 부울 매개변수. V_Label: 텍스트 레이블의 수직 오프셋. V_Shift: 수직 오프셋의 특정 양. H_Label: 텍스트 레이블의 수평 오프셋. H_Shift: 수평 오프셋의 특정 양. UP_DN (이동 평균 색상 상/하) Text_Color_UP: 이동 평균이 상승 추세를 나타낼 때 텍스트의 색상. 이 경우 녹색입니다. Text_Color_Down: 이동 평균이 하락 추세를 나타낼 때 텍스트의 색상. 이 경우 빨간색입니다.


추천 제품
ZhiBi Fast Scalp is a good fast scalping index system. The signal is oscillated according to the trend, and the Buy and Sell signals are frequently given. Suitable for all market varieties and time periods. The up arrow appears to place the order Buy; the down arrow appears to place the order Sell; Parameter setting description: [Signal_line_period]: The average period of the small cycle signal line. [Trend_line_period]: The average period of the large cycle trend line. [Alert_No_Off]: Open
"Adjustable Fractals" - 프랙탈 표시기의 고급 버전으로 매우 유용한 거래 도구입니다! 우리가 알고 있듯이 표준 프랙탈 mt4 표시기에는 설정이 전혀 없습니다. 이는 거래자에게 매우 불편합니다. 조정 가능한 프랙탈(Adjustable Fractals)이 해당 문제를 해결했습니다. 필요한 모든 설정이 포함되어 있습니다. 조정 가능한 표시 기간(권장 값 - 7 이상) 고점/저점과의 거리 조절 가능 프랙탈 화살표에 따라 조정 가능한 디자인 // 더 훌륭한 전문가 자문 및 지표는 여기에서 확인할 수 있습니다: https://www.mql5.com/en/users/def1380/seller // 또한 수익성 있고 안정적이며 신뢰할 수 있는 신호 https://www.mql5.com/en/signals/1887493에 참여하실 수 있습니다. 본 MQL5 홈페이지에서만 제공되는 오리지널 제품입니다.
TrendWave Oscillator is an advanced MT4 oscillator that not only identifies the trend direction but also provides visual and audio alerts to enhance trading strategies. Key Features: - Color-coded trend indication:   - Blue : Indicates an uptrend, signaling potential price growth.   - Orange : Indicates a downtrend, suggesting possible price decline.   - Gray : Represents a flat market or lack of clear entry signals. - Graphical signals on the chart :   - Aqua : Highlights an uptrend, empha
This indicator Super Neuro Trend indicator.Indicator displays trend movement. Indicator helps to buy and sell. Features FiltPer- displays indicator period. deviation - displaus indicator deviation. Trend - displaus indicator trend.( true,false) Rectangle - displaus indicator rectangle. (true,false)  How to understand the status: If the trend color is green, trend is up. I f the trend color is red, trend is down. I f the trend waiting,trend waiting.     /////////////////////////////////////////
Boba Binary
Anthonius Soruh
5 (1)
Result look on  https://t.me/BonosuProBinary Pair : All Forex Pairs Time Frame : M1 Expaired : 1-2 Minutes Trade Time Once Time a Day Backtester, Alert Avaliable Average Signals Generate 5 - 20 Signals All Pair A Day Broker Time Zone GMT+3 Default Setting [Example Broker GMT+3 : Alpari, FBS, XM] Support Broker : Deriv, IQOption, Alpari, Binomo, Olymtrade, Qoutex, GCoption, etc Support Auto Trading : MT2 Trading, Binary Bot, Intrade Bot, Binomo Bot, Olymptrad Bot, MX2 trading, Price Pro, etc Ind
Cota Binary
Anthonius Soruh
5 (2)
Result look on  https://t.me/BonosuProBinary Pair : All Forex Pairs Time Frame : M1 Expaired : 1-2 Minutes Trade Time Once Time a Day Backtester, Alert Avaliable Average Signals Generate 5 - 20 Signals All Pair A Day Broker Time Zone GMT+3 Default Setting [Example Broker GMT+3 : Alpari, FBS, XM] Support Broker : Deriv, IQOption, Alpari, Binomo, Olymtrade, Qoutex, GCoption, etc Support Auto Trading : MT2 Trading, Binary Bot, Intrade Bot, Binomo Bot, Olymptrad Bot, MX2 trading, Price Pro, etc Ind
Buy and sell zones
Evgeniy Zhdan
5 (3)
평면 및 추세를 결정하기 위한 표시기. 가격이 2개의 히스토그램과 2개의 선(빨간색 및 파란색) 중 하나보다 낮으면 판매 영역입니다. 이 버전의 표시기를 구매할 때 하나의 실제 계정과 하나의 데모 계정에 대한 MT4 버전 - 선물로(수신하려면 개인 메시지를 작성하세요)! 가격이 2개의 히스토그램과 2개의 선(빨간색 및 파란색) 중 하나보다 높으면 구매 영역입니다. MT4 버전:   https://www.mql5.com/en/market/product/3793 가격이 두 라인 사이 또는 히스토그램 영역에 있으면 시장에 명확한 추세가 없습니다. 간단히 말해서 시장은 평평합니다. 표시기의 작업은 스크린샷에 더 명확하게 표시됩니다. 지표는 선행 데이터를 얻는 데 사용할 수 있습니다. 또는 현재 추세의 상태를 확인합니다.
Indicador Taurus All4
Fabio Oliveira Magalhaes
Taurus All4 Taurus All4 is a high-performance indicator, it will tell you the strength of the trend, and you will be able to observe the strength of the candle. Our indicator has more than 4 trend confirmations. It is very simple and easy to use. Confirmation Modes Candle Trend Confirmations: When the candle switches to light green the trend is high. When the candle switches to light red the trend is reverting down. When the candle changes to dark red the trend is low. Trendline Trend Conf
Champio
Ivan Simonika
It is extremely important for any trader to correctly determine the direction and strength of the trend movement. Unfortunately, the only true solution to this problem is missing. Many traders trade at various time intervals. For this reason, the received signals are perceived subjectively. Trend indicators provide an opportunity to classify the direction of price movement, determining its strength. Solving this problem helps investors to enter the market on time and get a good return. The
Provides Regression Channel on the current chart. Combined by Trend of Moving Averages and Multi timeframes Oscillator Indicators: CCI, RSI, Stochastic, and MACD with specific working logic . It could make us easier to identify swing high-low as an entry point, the retracement area while following the current trend. Consists of 2 types of signal, main and secondary. The main signal will draw very clearly triangle and lines on the chart with the word " BUY" or 'SELL'. and the secondary is the sta
About
Tatiana Savkevych
About - Forex indicator. This trend indicator is used to determine the current trend in price movement, making it clear in which direction it is better to open a position: buy or sell. The About trend indicator is displayed on the chart and moves in parallel with the price. The Forex About trend indicator allows you to determine in time a change in the direction of price movement, thereby minimizing the likelihood of capital loss. In trading practice, various combinations of About and other ind
GeoWprPro
Georgij Komarov
WPR by Profile, or WPR for Professionals Geo_WprPro is one of the well-known currency profile indicators. It simultaneously displays two WPR indicators with different parameters in the matrix form on all timeframes of multiple currency pairs forming the currency profile . As follows from the description, " WPR is a leading indicator that often goes ahead of the price chart. The oscillator frequently reaches extreme values before the price reversal as if anticipating that event: it almost always
ADR Alert Dashboard
LEE SAMSON
3.92 (13)
ADR 경보 대시보드는 가격이 일반적인 일일 평균 범위와 관련하여 현재 거래되고 있는 위치를 한 눈에 보여줍니다. 가격이 평균 범위를 초과하고 선택한 수준보다 높을 때 팝업, 이메일 또는 푸시를 통해 즉각적인 알림을 받을 수 있으므로 신속하게 철회 및 반전에 뛰어들 수 있습니다. 대시는 빈 차트에 배치되도록 설계되었으며 배경에 앉아서 레벨에 도달하면 경고하므로 앉아서 보거나 전혀 볼 필요가 없습니다! MT5 버전은 여기에서 사용 가능: https://www.mql5.com/en/market/product/66316 새로운 기능: 이제 평균 WEEKLY 및 MONTHLY 범위와 경고도 표시됩니다! 여기에서 차트의 수준을 나타내는 ADR 반전 표시기를 얻으십시오. https://www.mql5.com/en/market/product/62757 시간의 약 60%는 가격이 정상적인 일일 평균 범위(ADR) 내에서 거래되고 이 수준 이상으로 상승하면 일반적으로 급격한 가격 변동의
RoyalPrince Fibo
Richard Louis Pastor
4.8 (30)
Royal Prince Fibonacci , has the most advance Trend detection algorithm built into its Alert system combined with the RoyalPrince Non-repaint Arrows with it's own alert system you will never miss the opportunity of the trade.  2nd picture is how to use Guide on how i use it to Scalp or take long trades. works on all Charts and all Timeframe on mt4. ︎Best Timeframe M15 for scalping  H1 for Day Trading Options: • Fibonacci days High and Lows  • Fibonacci Targets • Fibonacci Alert System • Tren
ZhiBiCCI MT4
Qiuyang Zheng
5 (1)
[ZhiBiCCI] indicators are suitable for all cycle use, and are also suitable for all market varieties. [ZhiBiCCI] Green solid line is a reversal of bullish divergence. The green dotted line is a classic bullish divergence. [ZhiBiCCI] The solid line to the red is a reverse bearish divergence. The red dotted line is a classical bearish divergence. [ZhiBiCCI] can be set in the parameters (Alert, Send mail, Send notification), set to (true) to send instant signals to the alarm window, email, in
Supplement for Alpha Trend Spotter (ATS) Indicator: https://www.mql5.com/en/market/product/8590 This indicator acts by price action. Use it when ATS shows clear Bullish or Bearish Trend for finding the strongest trend each day. Suitable for timeframes M5, H1, H4 and D1. Suitable for Binary Option 5 minutes signal. How to Use: RED Arrow means Sell GREEN Arrow means Buy
HMA Trend Professional MT4
Pavel Zamoshnikov
4.57 (7)
Improved version of the free HMA Trend indicator (for MetaTrader 4) with statistical analysis. HMA Trend is a trend indicator based on the Hull Moving Average (HMA) with two periods. HMA with a slow period identifies the trend, while HMA with a fast period determines the short-term movements and signals in the trend direction. The main differences from the free version: Ability to predict the probability of a trend reversal using analysis of history data. Plotting statistical charts for analyz
Night ghost
Dmitriy Kashevich
Night Ghost - Arrow indicator for binary options. This is a reliable assistant to you in the future! - No redrawing on the chart -Works great on EUR/USD currency pairs! -Indicator accuracy up to 90% (Especially at night) -No long setup required (Perfectly set up for Binary Options) - Not late signals - The appearance of a signal on the current candle -Perfect for M1 period (No More!) - Eye-friendly candle color (Red and Blue) -Installed Alert Working with it: - Blue arrow
TrendySignalMt4
Andrey Spiridonov
TrendySignalMt4l is a trend-following indicator that quickly responds to a trend change. The indicator forms the line so that it is always located above or below the chart depending on a trend. This allows using the indicator both for a trend analysis and setting stop loss and take profit. The indicator should be attached in the usual way. It works on any timeframe from M1 to MN and with any trading symbols. The indicator has no configurable inputs. Recommendations on working with the indicato
Sto Signal AM
Andriy Matviyevs'kyy
5 (1)
This indicator displays Stochastic osc signals on the price chart and allows the user to receive notifications of such signals. The Stochastic indicator is a classic and proven indicator of the technical analysis of the markets. Despite its age, it is still relevant today. Depending on the settings, the indicator allows you to work effectively on various TFs and any markets. Signals are given on fully formed bars and are not redrawn. Custom Parameters: Stochastic_Price (0-1) - The applied pric
FREE
Free Lotus
Christophe Godart
Due to the huge success of the limited free version, the now low priced LOTUS version will continue being updated in the future. Optimal for Binary Options and Forex. For beginners and intermediates. Lotus is 100% non repaint. The strategy is based on 4 ADX parameters, including pivot points and candle patterns.  It is recommendable to combine the arrow with an moving average, Elliot waves indicator or Parabolic SAR. The main goal was to  keep it as simple as possible ! No useless oscillators
Gioteen Volatility Index (GVI)   - your ultimate solution to overcoming market unpredictability and maximizing trading opportunities. This revolutionary indicator helps you in lowering your losing trades due to choppy market movements. The GVI is designed to measure market volatility, providing you with valuable insights to identify the most favorable trading prospects. Its intuitive interface consists of a dynamic red line representing the volatility index, accompanied by blue line that indicat
Professional Histogram   ( PH ) is a highly efficient and reliable tool for trading Forex, CFDs and binary options. PH is easy to use and configure both for beginners and experienced traders. Unlike most indicators, Professional Histogram finds longer trends and gives fewer false signals. When a buy or a sell signal appears, an alert is triggered allowing you to open a position in a timely manner and avoid sitting at your PC all the time. Professional Histogram    for the MetaTrader 5 terminal :
PZ Turning Points MT4
PZ TRADING SLU
1 (1)
This indicator examines the price structure of fractals of different periods to determine possible reversal points in the market, providing timing to positional traders that already have a fundamental or technical valuation model. Unlike its younger brother, Reversal Fractals , this indicator won't miss reversals because of the period selected, and will find reversal fractals on a zig-zag fashion, ignoring those reversals which do not carry enough momentum to start a sustained price movement. [
This is a breakout Indicator for MT4 where you can open trades after a breakout has occurred. This indicator will draw blue boxes on the chart. You simply have to follow price until it breaks out of the box and make sure that the candle had closed above the breakout if its a buy trade and the candle must close below if its a sell trade. An alert will now pop up with suggested price entry and TP of 15 pips default. You can change TP Pis depending on your choice The indicator can trade almost any
LR Candles AM
Andriy Matviyevs'kyy
This indicator displays candle prices on the chart, colored according to the data of a linear regression of various prices (at the user's choice) for a selected period of time. The user has the option to select two different price types and two different time periods. The indicator will display the moments of coincidence of the directions of the linear regression. Usage: After the full formation of a candle colored in the opposite color to the previous candle, place a stop order at the high /
FREE
XOatrline
Ainur Sharipov
5 (3)
The indicator is based on crosses of zeros, but their period is equated to the indicator ATR. An alternative to the XOATRHIST indicator with the channel display on the chart. More informative.  Closing a bar outside the channel forms an x or O. The indicator turns on the Alert option. Options: ATRPeriod  - period ATR for the calculation of steps. XOPips    - manual pips XOalert  - output of the signal to the terminal. XOnotification  - sending a signal to the mobile terminal. XOmail  -  send a
Others
Tatiana Savkevych
The Others indicator is a trend-type indicator. In those moments when you need to make a decision to enter a position and give the trader a direction. The indicator gives the trader the opportunity to visually determine which trend will be present at a particular time interval. These are auxiliary tools for technical analysis of the market. Recommended for use in conjunction with any of the oscillators. The main application of the Others indicator is to generate buy and sell signals. Determin
Gartley Projection D
Oleksandr Medviediev
3.71 (7)
The indicator identifies the harmonic patterns (XABCD) according to developments of H.M.Gartley ( "Profits in the Stock Market" , 1935г). It projects D-point as a point in the perspective projection (specify ProjectionD_Mode = true in the settings). Does not redraw. When a bar of the working timeframe closes, if the identified pattern point has not moved during Patterns_Fractal_Bars bars, an arrow appears on the chart (in the direction of the expected price movement). From this moment on, the ar
The new update makes this indicator a complete tool for studying, analyzing and operating probabilistic patterns. It includes: On-chart Multi-asset percentage monitor. Configurable martingales. Twenty-one pre-configured patterns , including Mhi patterns and C3. An advanced pattern editor to store up to 5 custom patterns. Backtest mode to test results with loss reports. Trend filter. Hit operational filter. Martingale Cycles option. Various types of strategies and alerts. Confluence between patte
이 제품의 구매자들이 또한 구매함
Scalper Inside PRO
Alexey Minkov
4.75 (59)
An exclusive indicator that utilizes an innovative algorithm to swiftly and accurately determine the market trend. The indicator automatically calculates opening, closing, and profit levels, providing detailed trading statistics. With these features, you can choose the most appropriate trading instrument for the current market conditions. Additionally, you can easily integrate your own arrow indicators into Scalper Inside Pro to quickly evaluate their statistics and profitability. Scalper Inside
현재 20% 할인 ! 초보자 또는 전문가 트레이더를 위한 최고의 솔루션! 이 대시보드 소프트웨어는 28개의 통화 쌍에서 작동합니다. 2가지 주요 지표(Advanced Currency Strength 28 및 Advanced Currency Impulse)를 기반으로 합니다. 전체 Forex 시장에 대한 훌륭한 개요를 제공합니다. 고급 통화 강도 값, 통화 이동 속도 및 모든(9) 시간대의 28 Forex 쌍에 대한 신호를 보여줍니다. 추세 및/또는 스캘핑 기회를 정확히 파악하기 위해 차트의 단일 지표를 사용하여 전체 시장을 볼 수 있을 때 거래가 어떻게 개선될지 상상해 보십시오! 잠재적인 거래를 식별하고 확인하면서 강력한 통화와 약한 통화를 더욱 쉽게 식별할 수 있도록 이 지표에 기능을 내장했습니다. 이 표시기는 통화의 강세 또는 약세가 증가 또는 감소하는지 여부와 모든 시간대에서 수행되는 방식을 그래픽으로 보여줍니다. 추가된 새로운 기능은 현재 시장 조건 변화에 적
TPSpro RFI Levels
Roman Podpora
4.86 (21)
Reversal First Impulse levels (RFI)    INSTRUCTIONS        RUS       -       ENG              R ecommended to use with an indicator   -   TPSpro  TREND PRO -  Version MT5 A key element in trading is zones or levels from which decisions to buy or sell a trading instrument are made. Despite attempts by major players to conceal their presence in the market, they inevitably leave traces. Our task was to learn how to identify these traces and interpret them correctly. Main functions: Displaying activ
AT Forex Indicator MT4
Marzena Maria Szmit
5 (2)
The AT Forex Indicator MT4 is a sophisticated trading tool designed to provide traders with a comprehensive analysis of multiple currency pairs. This   powerful indicator   simplifies the complex nature of the forex market, making it accessible for both novice and experienced traders. AT Forex Indicator uses   advanced algorithms   to detect trends, patterns and is an essential tool for traders aiming to enhance their forex trading performance. With its robust features, ease of use, and reliabl
FX Power MT4 NG
Daniel Stein
5 (11)
모닝 브리핑 여기 mql5 와 텔레그램에서 FX Power MT4 NG 는 오랫동안 인기 있는 통화 강도 측정기인 FX Power의 차세대 버전입니다. 이 차세대 강도 측정기는 무엇을 제공합니까? 기존 FX Power에서 좋아했던 모든 것 PLUS GOLD/XAU 강도 분석 더욱 정밀한 계산 결과 개별 구성 가능한 분석 기간 더 나은 성능을 위한 사용자 정의 가능한 계산 한도 특별 멀티더 많은 것을보고 싶은 사람들을위한 특별한 다중 인스턴스 설정 모든 차트에서 좋아하는 색상을위한 끝없는 그래픽 설정 수많은 알림 옵션, 중요한 것을 다시는 놓치지 않도록 Windows 11 및 macOS 스타일의 둥근 모서리가 있는 새로운 디자인 마법처럼 움직이는 인디케이터 패널 FX 파워 키 특징 모든 주요 통화의 완전한 강세 이력 모든 시간대에 걸친 통화 강세 이력 모든 브로커 및 차트에서 고유 계산 결과 100% 신뢰할 수있는 실시간100 % 신뢰할 수있는 실시간 계산-> 다시 칠하지 않음
TPSproTREND PrO
Roman Podpora
4.78 (18)
TPSpro TRENDPRO  - is a trend indicator that automatically analyzes the market and provides information about the trend and each of its changes, as well as giving signals for entering trades without redrawing! The indicator uses each candle, analyzing them separately. referring to different impulses - up or down impulse. Exact entry points into transactions for currencies, crypto, metals, stocks, indices!  -  Version MT5               DETAILED DESCRIPTION                R ecommended to use with
Indicator : RealValueIndicator Description : RealValueIndicator is a powerful tool designed specifically for trading on the EURUSD pair. This indicator analyzes all EUR and USD pairs, calculates their real currency strength values, and displays them as a single realistic value to give you a head start on price. This indicator will tell you moves before they happen if you use it right. RealValueIndicator allows you to get a quick and accurate overview of the EURUSD currency pair tops and bottoms,
Quantum Trend Sniper Indicator MT4
Bogdan Ion Puscasu
4.6 (40)
소개       Quantum Trend Sniper Indicator는   추세 반전을 식별하고 거래하는 방식을 변화시키는 획기적인 MQL5 지표입니다! 13년 이상의 거래 경험을 가진 숙련된 트레이더 팀이 개발한       Quantum Trend Sniper 표시기       매우 높은 정확도로 추세 반전을 식별하는 혁신적인 방법으로 거래 여정을 새로운 차원으로 끌어올리도록 설계되었습니다. ***Quantum Trend Sniper Indicator를 구입하면 Quantum Breakout Indicator를 무료로 받을 수 있습니다!*** Quantum Trend Sniper Indicator는 추세 반전을 식별하고 세 가지 이익실현 수준을 제안할 때 경고, 신호 화살표를 제공합니다. 초보자 거래자와 전문 거래자 모두에게 적합합니다. Quantum EA 채널:       여기를 클릭하세요 MT5 버전:       여기를 클릭하세요
TrendMaestro
Stefano Frisetti
5 (3)
note: this indicator is for METATRADER4, if you want the version for METATRADER5 this is the link:  https://www.mql5.com/it/market/product/108106 TRENDMAESTRO ver 2.4 TRENDMAESTRO recognizes a new TREND in the bud, he never makes mistakes. The certainty of identifying a new TREND is priceless. DESCRIPTION TRENDMAESTRO identifies a new TREND in the bud, this indicator examines the volatility, volumes and momentum to identify the moment in which there is an explosion of one or more of these data a
Atomic Analyst
Issam Kassas
5 (3)
우선적으로 언급할 점은이 거래 지표가 다시 그리지 않고 지연되지 않으며 이를 통해 수동 및 로봇 거래 모두에 이상적이라는 점입니다. 사용자 매뉴얼: 설정, 입력 및 전략. Atomic Analyst는 가격의 강도와 모멘텀을 활용하여 시장에서 더 나은 이점을 찾는 PA Price Action Indicator입니다. 고급 필터를 장착하여 잡음과 거짓 신호를 제거하고 거래 잠재력을 높이는 데 도움이 됩니다. 복잡한 지표의 다중 레이어를 사용하여 Atomic Analyst는 차트를 스캔하고 복잡한 수학적 계산을 간단한 신호와 색상으로 변환하여 초보 트레이더가 이해하고 일관된 거래 결정을 내릴 수 있도록합니다. "Atomic Analyst"는 새로운 및 경험이 풍부한 트레이더를위한 종합적인 거래 솔루션입니다. 프리미엄 지표와 최고 수준의 기능을 하나의 거래 전략에 결합하여 모든 종류의 트레이더에 대한 다재다능한 선택지가되었습니다. 인트라데이 거래 및 스캘핑 전략 : 빠르고 정확한
Advanced Currency Strength28 Indicator
Bernhard Schweigert
4.91 (665)
현재 26% 할인 초보자 또는 전문가 트레이더를 위한 최고의 솔루션! 이 지표는 우리가 독점 기능과 새로운 공식을 통합했기 때문에 독특하고 고품질이며 저렴한 거래 도구입니다. 단 하나의 차트로 28 Forex 쌍의 통화 강도를 읽을 수 있습니다! 새로운 추세 또는 스캘핑 기회의 정확한 트리거 포인트를 정확히 찾아낼 수 있기 때문에 거래가 어떻게 개선될지 상상해 보십시오. 사용 설명서: 여기를 클릭  https://www.mql5.com/en/blogs/post/697384 그것이 첫 번째, 원본입니다! 쓸모없는 지망생 클론을 사지 마십시오. 더 스페셜  강력한 통화 모멘텀을 보여주는 하위 창의 화살표 GAP가 거래를 안내합니다! 기본 또는 호가 통화가 과매도/과매도 영역(외부 시장 피보나치 수준)에 있을 때 개별 차트의 기본 창에 경고 표시가 나타납니다. 통화 강도가 외부 범위에서 떨어질 때 풀백/반전 경고. 교차 패턴의 특별 경고 추세를 빠르게 볼 수 있는
Advanced Supply Demand
Bernhard Schweigert
4.92 (313)
현재 33% 할인! 초보자나 전문 트레이더를 위한 최고의 솔루션! 이 보조지표는 우리가 다수의 독창적 기능과 새로운 공식을 통합한 독특하고 고품질이며 저렴한 거래 도구입니다. 이 업데이트를 통해 이중 시간대를 표시할 수 있습니다. 더 높은 TF를 표시할 수 있을 뿐만 아니라 차트 TF와 더 높은 TF 모두를 표시할 수 있습니다: 중첩 영역 표시. 모든 Supply Demand 트레이더들이 좋아할 것입니다. :) 중요한 정보 공개 Advanced Supply Demand의 잠재력을 극대화하려면 다음을 방문하십시오. https://www.mql5.com/ko/blogs/post/720245   진입 또는 목표의 명확한 트리거 포인트를 정확히 찾아냄으로 해서 거래가 어떻게 개선될지 상상해 보십시오. 새로운 알고리즘을 기반으로 매수자와 매도자 간의 잠재적인 불균형을 훨씬 더 쉽게 분간할 수 있습니다. 왜냐하면 가장 강한 공급영역과 가장 강한 수요 영역과 과거에 어떻게 진행 되었는지를(이
Quantum Breakout Indicator PRO
Bogdan Ion Puscasu
4.96 (26)
소개       Quantum Breakout PRO   , 브레이크아웃 존 거래 방식을 변화시키는 획기적인 MQL5 지표! 13년 이상의 거래 경험을 가진 숙련된 트레이더 팀이 개발한   Quantum Breakout PRO는   혁신적이고 역동적인 브레이크아웃 영역 전략으로 거래 여정을 새로운 차원으로 끌어올리도록 설계되었습니다. Quantum Breakout Indicator는 5개의 이익 목표 영역이 있는 브레이크아웃 영역의 신호 화살표와 브레이크아웃 상자를 기반으로 한 손절 제안을 제공합니다. 초보자 거래자와 전문 거래자 모두에게 적합합니다. Quantum EA 채널:       여기를 클릭하세요 MT5 버전 :   여기를 클릭하세요 중요한! 구매 후 설치 매뉴얼을 받으려면 개인 메시지를 보내주십시오. 추천: 기간: M15 통화쌍: GBPJPY, EURJPY, USDJPY,NZDUSD, XAUUSD 계정 유형: 스프레드가 매우 낮은 ECN, Ra
NAM Order Blocks
NAM TECH GROUP, CORP.
5 (1)
MT4 Multi-timeframe Order Blocks detection indicator. Features - Fully customizable on chart control panel, provides complete interaction. - Hide and show control panel wherever you want. - Detect OBs on multiple timeframes. - Select OBs quantity to display. - Different OBs user interface. - Different filters on OBs. - OB proximity alert. - ADR High and Low lines. - Notification service (Screen alerts | Push notifications). Summary Order block is a market behavior that indicates order collection
FX Volume
Daniel Stein
4.61 (36)
모닝 브리핑을 통해 세부 정보와 스크린샷으로 매일 시장 업데이트를 받으세요 여기 mql5 및 텔레그램에서 FX 거래량은 브로커의 관점에서 시장 심리에 대한 실제 통찰력을 제공하는 최초이자 유일한 거래량 지표입니다. 브로커와 같은 기관 시장 참여자가 외환 시장에서 어떤 포지션을 취하고 있는지에 대한 훌륭한 통찰력을 COT 보고서보다 훨씬 빠르게 제공합니다. 차트에서 이 정보를 직접 확인하는 것은 트레이딩의 진정한 판도를 바꾸고 획기적인 솔루션입니다. 다음과 같은 고유한 시장 데이터 인사이트의 이점 비율 는 통화의 매수/매도 포지션 비율을 백분율로 표시 비율 변화 는 선택한 기간 내 매수 비율과 비율 변화를 표시 총 거래량 는 해당 통화의 총 거래량(롱 및 숏)을 로트 단위로 보여줍니다 Volumes Long 는 해당 통화의 모든 롱 포지션의 거래량을 보여줍니다 Volumes Short 는 해당 통화의 모든 숏 포지션의 거래량을 보여줍니다 Net Long 는 순 롱 포지션의 거래량
Enigmera
Ivan Stefanov
5 (4)
에니메라: 시장의 핵심 https://www.enigmera.com 소개 이 지표 및 트레이딩 시스템은 금융 시장에 대한 놀라운 접근 방식입니다. 에니메라는 프랙탈 주기를 사용하여 지지선과 저항선을 정확하게 계산합니다. 진정한 축적 단계를 보여주고 방향과 목표를 제시합니다.  추세에 있든 조정에 있든 작동하는 시스템입니다.  어떻게 작동하나요? 에니메라는 지지선/저항선, 목표선, 편차선의 세 가지 라인으로 구성됩니다. 이 시스템은 과거 데이터를 현재와 미래로 추정하는 일반적인 시장 지표와 달리 현재에 대한 완전한 그림을 제공합니다. 지지선 위에 있으면 실제 지지를 의미하고 저항선 위에 있으면 실제 저항을 의미합니다. 레벨이 깨지면 추세의 변화를 나타냅니다. 다시 그리지 않습니다. 시장이 지속적으로 진화함에 따라 에니메라는 평가 도구를 조정하여 전략을 정기적으로 수정합니다.   이를 통해 모든 시나리오를 철저히 평가할 수 있습니다. 이 시장 지표의 고유성은 분명하며 그 기
Cycle Sniper
Elmira Memish
4.41 (37)
NEW YEAR SALE PRICE FOR LIMITED TIME!!! Please contact us after your purchase and we will send you the complimentary indicators to complete the system Cycle Sniper is not a holy grail but when you use it in a system which is explained in the videos, you will feel the difference. If you are not willing to focus on the charts designed with Cycle Sniper and other free tools we provide, we recommend not buying this indicator. We recommend watching the videos about the indiactor and system before pu
All in One Trade
Alexey Minkov
4.48 (27)
The All-in-One Trade Indicator (AOTI) determines daily targets for EURUSD, EURJPY, GBPUSD, USDCHF, EURGBP, EURCAD, EURAUD, AUDJPY, GBPAUD, GBPCAD, GBPCHF, GBPJPY, AUDUSD, and USDJPY. All other modules work with any trading instruments. The indicator includes various features, such as Double Channel trend direction, Price channel, MA Bands, Fibo levels, Climax Bar detection, and others. The AOTI indicator is based on several trading strategies, and created to simplify market analysis. All-in-One
TakePropips Donchian Trend Pro
Eric John Pajarillaga Aldana
4.61 (18)
TakePropips Donchian Trend Pro   (MT4)는 Donchian 채널을 사용하여 추세의 방향을 자동으로 감지하고 진입 및 퇴장 거래 신호를 제공하는 강력하고 효과적인 도구입니다! 이 다기능 지표에는 추세 스캐너, 거래 신호, 통계 패널, 스크리너, 거래 세션 및 경고 내역 대시보드가 포함됩니다. 거래 신호를 제공하고 차트 분석 시간을 절약하도록 설계되었습니다! 다음 블로그 게시물에서 사용자 설명서 및 설치 가이드를 다운로드할 수 있습니다.   https://www.mql5.com/en/blogs/post/751368 오늘 50% 할인을 받으세요! 가격이 $98에서 $49로 인하되었습니다! 전략 테스터에서 이 지표를 테스트할 수 있습니다(비주얼 모드 활성화).  자세한 내용은 설명 아래에 비디오 자습서도 제공됩니다. 질문이 있거나 도움이 필요하면 저에게 연락하십시오. TakePropips Donchian Trend Pro 지표는 모든 Forex 쌍, 금속
Entry Points Pro
Yury Orlov
4.7 (226)
다시 색을 칠하지 않고 거래에 진입할 수 있는 정확한 신호를 제공하는 MT4용 지표입니다. 외환, 암호화폐, 금속, 주식, 지수 등 모든 금융 자산에 적용할 수 있습니다. 매우 정확한 추정값을 제공하고 매수와 매도의 가장 좋은 시점을 알려줍니다. 하나의 시그널로 수익을 내는 지표의 예와 함께 비디오 (6:22)시청하십시오! 대부분의 거래자는 Entry Points Pro 지표의 도움으로 첫 거래 주 동안 트레이딩 결과를 개선합니다. 저희의   Telegram Group 을 구독하세요! Entry Points Pro 지표의 좋은점. 재도색이 없는 진입 신호 신호가 나타나고 확인되면(시그널 캔들이 완성된 경우) 신호는 더 이상 사라지지 않습니다. 여타 보조지표의 경우 신호를 표시한 다음 제거되기 때문에 큰 재정적 손실로 이어집니다. 오류 없는 거래 게시 알고리즘을 통해 트레이드(진입 또는 청산)를 할 이상적인 순간을 찾을 수 있으며, 이를 통해 이를 사용하는 모든 거래자의
PTS Precision Index Oscillator V2
PrecisionTradingSystems
5 (2)
프리시전 트레이딩 시스템의 로저 메드칼프에 의한 프리시전 인덱스 오실레이터 (Pi-Osc) 버전 2는 차트에 신속하게 로드되도록 주의 깊게 다시 코딩되었으며 경험을 향상시키기 위해 몇 가지 다른 기술적 개선 사항이 통합되었습니다. Pi-Osc는 정확한 거래 타이밍 신호를 제공하도록 개발되었으며 시장이 모든 사람의 스톱을 청산하기 위해 가야 하는 극도의 고갈 지점을 찾는 데 목적이 있습니다. 이 제품은 극단적인 지점이 어디에 있는지 알고 있는 고전적인 문제를 해결하며 트레이더로서의 삶을 훨씬 간단하게 만듭니다. 이것은 업계 표준 오실레이터와는 상당히 다른 강력한 차이점을 가지고 있는 고도로 복잡한 합의 지표입니다. 사용하는 기능 중 일부는 수요 지수, 자금 흐름, RSI, 스토캐스틱, 패턴 인식, 거래량 분석, 표준 편차 극단점 및 다양한 길이에서 위와 유사한 변형을 갖습니다. 미숙한 눈에는 다른 오실레이터와 비슷해 보일 수 있지만 RSI 또는 모멘텀과 같은 다
Pro SMC Tool
The Anh Pham
Welcome to the world of SMC (Smart Money Concepts) Trading, where we empower traders with the tools and knowledge to make smarter trading decisions. Our latest addition to our suite of trading tools is the SMC Trading Pro indicator, version 1.0. Key Features: Major Market Structure Identification with BODY break. Order Block must be in Major Swing ( not Small Swing ). Order Block with Fair Value Gap Detection. Order Block in Discount | Premium zone. Filter for only Bullish, Bearish or All Order
ZeusArrow Smart Liquidity Finder  Smart Liquidity Finder is Ai controlled indicator based on the Idea of Your SL is My Entry. It scan and draws the major Liquidity areas on chart partitioning them with Premium and Discount Zone and allows you find the best possible trading setups and help you decide the perfect entry price to avoid getting your Stop Loss hunted . Now no more confusion about when to enter and where to enter. Benefit from this one of it's kind trading tool powered by Ai an trade
A. A2SR이란 무엇입니까 ?   * 선행 기술 지표입니다(재도장 없음, 지연 없음). -- 안내 : https://www.mql5.com/en/blogs/post/734748/page4#comment_16532516 -- 및 https://www.mql5.com/en/users/yohana/blog A2SR에는 지원(수요) 및 저항(공급) 수준을 결정하는 특별한 기술이 있습니다. 우리가 인터넷에서 본 일반적인 방식과 달리 A2SR은 실제 SR 수준을 결정하는 독창적인 개념을 가지고 있습니다. 원래 기술은 인터넷에서 가져온 것이 아니며 인터넷에 게시된 적도 없습니다. A2SR은 거래 스타일에 따라 SR 수준을 자동으로 선택합니다. 시간 프레임을 변경해도 SR 레벨은 그대로 유지됩니다. 사용하는 시간 프레임에서 실제 SR을 얻지 못하기 때문입니다. A2SR은 거래를 위한 완전한 상품을 보유하고 있습니다 . 실제 지원(수요) 및 저항(공급)에 대한 진정한 개념. 뉴스 이벤트
Beast Super Signal
Dustin Vlok
4.76 (101)
수익성 있는 거래 기회를 쉽게 식별하는 데 도움이 되는 강력한 외환 거래 지표를 찾고 계십니까? Beast Super Signal보다 더 이상 보지 마십시오. 사용하기 쉬운 이 추세 기반 지표는 시장 상황을 지속적으로 모니터링하여 새로운 개발 추세를 찾거나 기존 추세에 뛰어들 수 있습니다. Beast Super Signal은 모든 내부 전략이 정렬되고 서로 100% 합류할 때 매수 또는 매도 신호를 제공하므로 추가 확인이 필요하지 않습니다. 신호 화살표 알림을 받으면 구매 또는 판매하기만 하면 됩니다. 구매 후 비공개 VIP 그룹에 추가되도록 저에게 메시지를 보내주세요! (전체 제품 구매만 해당). 최신 최적화된 세트 파일을 구입한 후 저에게 메시지를 보내주세요. MT5 버전은   여기에서 사용할 수 있습니다. 여기에서   Beast Super Signal EA를 받으세요. 최신 결과를 보려면 댓글 섹션을 확인하세요! Beast Super Signal은 1:
GOLD Impulse with Alert
Bernhard Schweigert
4.56 (9)
이 지표는 Advanced Currency IMPULSE with ALERT  +   Currency Strength Exotics  의 2가지 제품의 슈퍼 조합입니다. 그것은 모든 시간 프레임에 대해 작동하며 8개의 주요 통화와 하나의 기호에 대한 강약의 충동을 그래픽으로 보여줍니다! 이 표시기는 금, 이국적인 쌍, 상품, 지수 또는 선물과 같은 기호에 대한 통화 강도 가속을 표시하는 데 특화되어 있습니다. 금, 은, 오일, DAX, US30, MXN, TRY, CNH 등의 진정한 통화 강도 가속(충동 또는 속도)을 표시하기 위해 9번째 줄에 모든 기호를 추가할 수 있습니다. 새로운 기본 알고리즘을 기반으로 구축되어 잠재적인 거래를 훨씬 더 쉽게 식별하고 확인할 수 있습니다. 이는 통화의 강세 또는 약세가 가속되는지 여부를 그래픽으로 표시하고 가속 속도를 측정하기 때문입니다. 자동차의 속도계처럼 생각하면 됩니다. 가속화할 때 Forex 시장에서 동일한 일이 분명히
FxBears Powers
Rachid Lafhil
3 (2)
️️ Attention:      The price will soon be raised to what it was before ($500).      No more losses with this indicator, test it for years ago and see if there is losses in one day results. but before testing it please see the explaining video down here.    FxBears Powers is working on all forex pairs, metals, commodities, futures, indices, energies, crypto, and everything...and on all timeframes from M1 to MN.   It's based on supply and demand zones, price action, and some internal indicators,
Volume by Price MT4
Brian Collard
4.71 (14)
The Volume by Price Indicator for MetaTrader 4 features Volume Profile and Market Profile TPO (Time Price Opportunity). Volume and TPO histogram bar and line charts. Volume Footprint charts. TPO letter and block marker collapsed and split structure charts. Session filtering and grouping. Static, dynamic and flexible range segmentation and compositing methods with relative and absolute visualizations. Graphical layering, positioning and styling options to suit the user's analytic and aesthetic n
norepaint buy sell indicator is norepaint indicator.and works all pairs and all timeframes. Indicator hold too long way to signals. And show major and minor cycles.and gives signals Minor cycles are indicating with x signs. Major cycles are indicating big arrows. So 5m chart and 15m chart more suitable For major cycles, 1 h and 4h chart suitable for minor cycles. using is wery simple ,it puts arrow on price probably buy sell arrows. thise indicator is suitable for beginner and experienced trader
Currency Strength Exotics
Bernhard Schweigert
4.88 (33)
현재 20% 할인! 초보자 또는 전문가 트레이더를 위한 최고의 솔루션! 이 표시기는 Exotic Pairs Commodities, Indexes 또는 Futures와 같은 기호에 대한 통화 강도를 표시하는 데 특화되어 있습니다. 금, 은, 석유, DAX, US30, MXN, TRY, CNH 등의 진정한 통화 강도를 보여주기 위해 9번째 줄에 모든 기호를 추가할 수 있습니다. 이것은 독특하고 고품질이며 저렴한 거래 도구입니다. 우리는 많은 독점 기능과 새로운 공식을 통합했습니다. 새로운 추세 또는 스캘핑 기회의 정확한 트리거 포인트를 정확히 찾아낼 수 있기 때문에 거래가 어떻게 개선될지 상상해 보십시오. 사용 설명서: 여기를 클릭 https://www.mql5.com/en/blogs/post/708876 모든 시간대에 작동합니다. TREND를 빠르게 확인할 수 있습니다! 새로운 기본 알고리즘을 기반으로 설계되어 잠재적인 거래를 더욱 쉽게 식별하고 확인할 수 있습니다.
제작자의 제품 더 보기
Aurum Apex Mt4 EA
Martin Alejandro Bamonte
Aurum Apex EA 설명 Aurum Apex EA는 MT4 플랫폼을 위해 설계된 강력한 100% 자동화된 거래 도구입니다. 실시간으로 시장을 분석하고 다양한 거래 기회를 감지합니다. 모든 수준의 트레이더에 적합한 Aurum Apex EA는 위험 매개 변수를 통해 조정 가능한 세 가지 리스크 모드를 제공합니다: 리스크 = 0.1 (낮은 리스크): 금 거래에 익숙하지 않은 신규 트레이더에게 이상적입니다. 이 설정은 놀라움을 최소화하고 신뢰를 쌓습니다. 리스크 = 0.2 (중간 리스크): 금 거래에 익숙한 경험 많은 트레이더를 위한 것입니다. 수익 가능성과 손실의 최적의 균형을 제공합니다. 리스크 = 0.3 (높은 리스크): 하루에 몇 시간 동안 로봇을 작동하는 고급 트레이더를 위한 것입니다. 이 설정은 3~4시간 후에 EA를 비활성화하는 사람들에게 적합합니다. 중요한 USD 및 BTC 뉴스 이벤트 중에는 주의가 필요합니다. ECN 또는 제로 스프레드 계좌에서 최소 $1000으로
NextCandlePredictor No Repaint
Martin Alejandro Bamonte
NextCandlePredictor 지표 NextCandlePredictor는 다시 그리지 않으며, 색상이 변경되지 않고, 이동하지 않으며, 사라지지 않으며, 지연이 없는 알림이 있는 신호 지표입니다. 모든 타임프레임에서 다음 또는 다가오는 캔들의 방향을 식별하는 데 도움이 됩니다. 뉴욕, 런던 또는 둘 다 겹치는 고변동성 시장에 매우 권장됩니다. 주요 기능: 타임프레임의 유연성: M1에서 H1 이상까지 모든 타임프레임에서 빠르고 정확한 신호를 제공합니다. 명확한 매수/매도 신호: ADX의 DI+ 및 DI- 라인을 사용하여 명확한 매수 및 매도 신호를 생성하여 최고의 거래 결정을 내릴 수 있도록 합니다. 직관적인 시각화: 신호는 차트에 직접 녹색(매수) 및 빨간색(매도) 화살표로 표시되어 빠르고 쉽게 읽을 수 있습니다. 사용자 정의 가능한 설정: 분석할 막대 수와 경고 옵션을 선호도 및 거래 전략에 따라 조정합니다. 사용하려는 TF에 따른 제안표를 아래에서 확인하세요. 캔들 종료 시
BullsEye Signal NoRepaint
Martin Alejandro Bamonte
BullseyeSignal – NoRepaint 은 그 이름이 나타내는 바와 같이 어떤 상황에서도 다시 그려지지 않는 신호입니다. 신호는 이미지에 표시된 동일한 캔들에 발행됩니다. 외환, 암호화폐, 주식, 지수 및 선물과 같은 변동성이 큰 시장에 이상적입니다. 매수에는 녹색 화살표, 매도에는 빨간색 화살표만 보이지만, 더 간단한 거래 경험을 제공하기 위해 많은 지표가 함께 작동하고 있습니다. 이는 정확한 진입점을 제공하도록 설계되었습니다. 많은 진입점이 아니라, 우리 지표가 추세 변화를 나타내고 이전 추세의 반대 방향으로 0 레벨을 넘을 때 특정 진입점을 제공합니다. 더 정확한 거래를 달성하기 위해 지표는 추세 변화를 확인하기 위해 첫 번째 되돌림을 기다려 잘못된 반전을 피합니다. 따라서 이전 추세의 돌파와 되돌림 확인 후 신호가 발행됩니다. 이것은 매우 신중한 거래 접근 방식입니다, 따라서 이러한 팁을 따르는 것이 중요합니다(초보자 및 고급 트레이더 모두 이 전략을 사용할 수
Scalping Signal NO Repaint NO Lag
Martin Alejandro Bamonte
5 (1)
"Scalping Signal No Repaint No Lag"는 어떤 차트에 드래그하더라도 템플릿이나 다른 지표를 로드할 필요 없이 자동으로 모든 필요한 지표를 로드하는 유일한 지표입니다. 제공된 이미지와 정확히 동일한 모습으로 차트를 자동으로 구성합니다. 이 지표는 재도색 없이 신호를 제공하므로 모든 통화 쌍과 시간대(TF)에서 스캘핑 전략에 이상적입니다. 기능 자동 지표 로딩 : 지표를 어떤 차트에 드래그하면 추가로 필요한 모든 지표가 자동으로 로드되고 설정된 선호도에 따라 차트가 구성됩니다. 원하면 설정에서 매개변수를 변경할 수 있습니다. 차트 시각화 : 일본 촛대 및 특정 색상을 사용하여 시각화를 개선하기 위해 차트 속성을 조정합니다. 배경 및 촛대 색상은 원하면 변경할 수 있습니다. 신호 생성 : 두 이동 평균 간의 차이와 RSI가 EMA와 교차하는 것을 사용하여 매수 및 매도 신호를 생성하며, 차트에 화살표로 표시됩니다. 추세 시각화 : 빠른 이동 평균과 느린 이동 평균
Clear Breakout
Martin Alejandro Bamonte
"Breakout Buy-Sell" 지표는 다양한 시장 세션(도쿄, 런던, 뉴욕) 동안 가격 돌파를 기반으로 매수 및 매도 기회를 식별하고 강조하도록 설계되었습니다. 이 지표는 트레이더가 매수 및 매도 영역뿐만 아니라 이익 실현(TP) 및 손절매(SL) 수준을 명확하게 시각화하는 데 도움이 됩니다. 사용 전략 이 지표는 다음과 같이 사용할 수 있습니다: 초기 설정 : 시장 세션을 선택하고 GMT 오프셋을 조정합니다. 시장 시각화 : 각 세션 시작 시 그려지는 돌파 상자를 관찰합니다. 이러한 상자는 기간의 최고점과 최저점을 나타냅니다. 매수 및 매도 신호 : 상자의 최고점을 초과하는 돌파는 매수 신호로 간주됩니다. 최저점을 밑도는 돌파는 매도 신호로 간주됩니다. 위험 관리 : TP1, TP2, TP3 및 SL 수준을 사용하여 포지션을 관리합니다. TP 수준은 다양한 수익 목표를 위해 설계되었으며 SL은 불리한 움직임으로부터 보호를 보장합니다. 적용 전략 이 지표를 최대한 활용하기 위해
GbpUsd Pip Hunter EA
Martin Alejandro Bamonte
GBPUSD Pip Hunter EA 주요 기능: M15 시간 프레임에 최적화된 GBPUSD: 15분 차트에서 GBPUSD 페어에 맞게 설계되고 테스트되었습니다. 최소 권장 계좌 크기: 낮은 드로우다운을 보장하기 위해 최소 $1000의 계좌 잔액이 필요합니다. 스프레드 호환성: 수익성을 최대화하기 위해 저스프레드 또는 ECN 계좌에서 사용하는 것이 좋습니다. 위험 관리: 지수 로트 기능을 1.0으로 설정하여 비활성화할 수 있는 옵션을 포함하여 거래 요구에 맞게 조정할 수 있습니다. 맞춤형 매개변수: 사용자가 EA를 자신의 거래 스타일과 위험 허용 범위에 맞게 조정할 수 있도록 다양한 조정 가능한 매개변수를 제공합니다. GBPUSD Pip Hunter EA의 매개변수 설명 MM (자금 관리 토글) 설명: 자금 관리 기능을 활성화하거나 비활성화하기 위한 토글 스위치입니다. 옵션: 아니요: 자금 관리를 비활성화합니다. 예: 자금 관리를 활성화합니다. MMType 설명: 사용 중인 자금 관
"MultiSymbol & TF Chart Integrated" 지표는 단일 차트(다중 모드)에서 최대 60개의 통화 쌍을 선호하는 시간대에 따라 모니터링하거나 모든 TF에서 거래 중인 통화 쌍을 볼 수 있도록 빠르게 포괄적인 시장 전망을 제공하도록 설계되었습니다(단순 모드). 주요 장점: 완전 모니터링: 단일 차트에서 모든 원하는 쌍을 한 눈에 실시간으로 모니터링할 수 있습니다. 시간 절약: 차트 간 전환 필요 없이 각 쌍의 행동을 실시간으로 확인할 수 있습니다. 추세 분석: 추세를 따르는 트레이더에게 적합하며, 결정하기 전에 추세를 확인하기 위해 상위 시간대를 볼 수 있습니다. 극한 사용자 정의: 지표의 모든 측면을 특정 요구에 맞게 조정합니다. 극한 사용자 정의: 높은 구성 가능성 지표 매개변수: 심볼 및 시간대: 최대 60개의 다른 심볼을 구성할 수 있습니다. 각 심볼은 고유한 시간대를 가질 수 있습니다(예: M1, M5, M15, M30, H1, H4, D1, W1
Pairs and TF Changer
Martin Alejandro Bamonte
여러 차트를 전환하며 다양한 통화 쌍과 시간 프레임을 모니터링하는 것에 지치셨나요? Pairs and TF Changer 지표가 거래 경험을 혁신합니다! 모든 전략 지표를 로드한 후 Pairs and TF Changer 를 차트에 추가하십시오. 필요에 따라 위치, 색상 또는 표시할 열 수를 조정할 수 있습니다! 주요 기능: 원활한 통합: 이 지표를 거래 전략에 쉽게 통합하십시오. 클릭 한 번으로 단일 차트에서 모든 통화 쌍과 시간 프레임을 거래하십시오. 추가 차트를 전환하거나 열 필요가 없습니다. 높은 맞춤화 가능: 차트의 어느 위치에든 위치를 조정하십시오 (위, 아래, 왼쪽, 오른쪽). 1열 또는 10열의 버튼을 표시하도록 설정하십시오. 거래 테마에 맞게 색상을 맞춤화하십시오. 차트를 깔끔하고 정돈되게 유지하기 위해 버튼을 투명하게 만드십시오. 보편적 호환성: 모든 유형의 지표 및 전략과 호환됩니다. Forex, 금속, 미국 주식, 지수, 석유, 선물 및 암호화폐를 포함한 모든 심
GO Trend MultiTimeFrame
Martin Alejandro Bamonte
GoTrend Multi-Timeframe 지표 "GoTrend Multi-Timeframe" 지표는 여러 시간 프레임에서 통화쌍의 전체 및 특정 추세를 빠르고 효율적으로 평가하려는 트레이더에게 필수적인 도구입니다. 이 지표는 트레이더가 시장 방향에 대한 명확하고 포괄적인 시각을 한눈에 얻을 수 있도록 하여 의사 결정을 최적화하고 거래 전략의 효과를 높일 수 있습니다. 주요 특징: 다중 시간 프레임 분석: 이 지표는 M5, M15, M30, H1, H4 및 D1의 여섯 가지 다른 시간 프레임에 대한 포괄적인 분석을 제공하여 트레이더가 각 기간의 추세를 이해할 수 있도록 합니다. 통합 기술 지표: 이 지표는 RSI, SAR, MA, MACD 및 ADX의 다섯 가지 강력한 기술 지표를 사용하여 각 시간 프레임에서 추세 방향을 결정합니다. 명확하고 직관적인 시각화: 신호는 직관적인 기호와 색상으로 메인 차트의 원하는 코너에 표시됩니다. 이를 통해 트레이더는 시장 상황을 한눈에 평가할 수
필터:
리뷰 없음
리뷰 답변