Watch the Market tutorial videos on YouTube
How to buy а trading robot or an indicator
Run your EA on
virtual hosting
virtual hosting
Test аn indicator/trading robot before buying
Want to earn in the Market?
How to present a product for a sell-through
Technical Indicators for MetaTrader 4 - 137
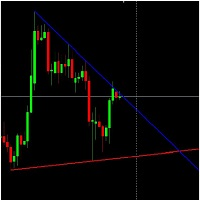
Standard Trend Lines (Automatic).
This indicator draws highly accurate trend lines.
It draws Trend Lines automatically.
This Trend Lines indicator was made by observing lot of discussions made about Trend Lines in forum.
The Trend Lines can also be used to create Expert Advisor.
Latest valid Trend Lines are drawn on Chart.
Trend Lines Work on basis of OHLC price data.
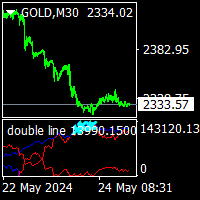
double line indicator is no repaint trend indicator. it can be use all pairs and all timeframes. it is wery ease to use.also beginner can use. it gives gold and aqua points on the double lines. aqua points is come when the prices is down. and gold points is come when the prices is on top. it can be used all time frames and all pairs. suitable for experienced and beginners traders.

Volume Clarity Pro The Volume Clarity Pro provides clarity in the movement of price for any financial instrument, including currency pairs, cryptocurrencies, equities, commodities and indices. The Volume Clarity Pro maps out where price is consolidating, retracing, resisting or settled in areas of support. The Volume Clarity Pro accurately displays the month's price action, offering crucial data about your selected trading pair for chart analysis and trade initiation. The Volume Clarity Pro is

Chart Clarity Dashboard The Chart Clarity Dashboard provides clear insights into price movements for various financial instruments like currency pairs, cryptocurrencies, equities, commodities, and indices. This dashboard displays detailed price information in real-time, making it easier for traders to make decisions quickly. It shows price movements down to the second, giving you essential data before you trade or analyze charts. Chart Clarity Dashboard allows you to monitor price changes acros

It's a variation of mid of HH and LL since it compares the higher of HH or LL against a period and twice the number of bars back to avoid whipsaws.
I used to display this against lines on a chart, but made a histogram out of it and it looks interesting.
It looks good at gauging trend strength and general turns (see image below).
The name of the indicator is BAM, which is an acronym for "Below and Above Mid".
Ways to use it:
1. To see general trend on longer TFs (more than 60 ba

It's a variation of mid of HH and LL since it compares the higher of HH or LL against a period and twice the number of bars back to avoid whipsaws.
I used to display this against lines on a chart, but made a histogram out of it and it looks interesting.
It looks good at gauging trend strength and general turns (see image below).
The name of the indicator is BAM, which is an acronym for "Below and Above Mid".
Ways to use it:
1. To see general trend on longer TFs (more than 30 ba
GAP DETECTOR
FVG in trading refers to "Fair Value Gap", . It is a concept used in technical analysis to identify areas on a price chart where there is a discrepancy or gap between supply and demand. These gaps can occur due to rapid movements in price, usually as a result of important news or economic events, and are usually filled later as the market stabilizes.
The GAP DETECTOR indicator is designed to identify fair value gaps (FVG) on the price chart and filter them using volatility to d
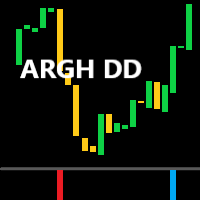
Indicator Argh dd cumpărare vânzare
Acest indicator este un indicator de histogramă.
Este un indicator care poate da puține rezultate fals pozitive.
Tranzacțiile pe care le declanșează sunt tranzacții lungi timp de zile sau săptămâni.
Regulile de intrare sunt foarte simple:
Afișarea histogramei cu o bară albastră indică deschiderea unei poziții de cumpărare;
️ Bara roșie a histogramei indică deschiderea unei poziții de vânzare.
Nu ar trebui să fim surprinși că, după deschiderea

The Prop Trading Scalper indicator is a tool used for manual traders to assist in passing prop trading challenges, which are evaluations set by proprietary trading firms to determine a trader's skill and discipline. This indicator is particularly designed for scalping, a strategy that involves making numerous small trades to capitalize on minor price movements.

Renko Masterx is a mt4 arrow type indicator that is designed to trade renko charts , this indicator has a backtesting dashboard that tells the trader useful info such as winrate and points won, it also gives tp and sl in atr x multiplication, this indicator gives its signal on bar open or intra bar, and it has a white marker that will mark the exact price where the signal were given, the way to use this indicator is by opening a buy or sell according to the arrow given by the indicator and to se
ダイバージェンス はオシレーター系のテクニカル指標が、実際の相場とは逆方向に向かって動いている状態のことを指し、その後のトレンド転換の可能性を示す戦略として有効です。
このインディケータは特に有効性の高いMACDのダイバージェンスを利用した 裁量トレード用サインツールです。
高頻度かつ高い 勝率で サインを発信しますが、各種の強力なフィルターにより、さらに精度の高いサインに絞ることが出来ます。また、通常のダイバージェンスに加えリバーサル( 隠れダイバージェンス) によるサイン発信も可能です。
全通貨ペア、全タイムフレームで利用できます。勝敗判定機能により、このインディケータの直近の相場環境に対する有効性を確認できます。
設定項目は以下の通りです。 Enable Divergence...MACDのDivergenceによるサインの発信を有効にします。ピンクの矢印が表示されます Enable Reversal...MACDのReversal(Hidden Divergence)によるサインの発信を有効にします 。ブルーの矢印が表示されます Fast EMA Pe

Using this indicator, you can see the moving average of 7 time frames in (one time frame) the same time frame you are.
You can also set orders to enter buy or sell positions automatically when the price hits Moving.
You can also set orders to risk free or close existing positions when the price hits Moving.
Also, receive a notification on your mobile phone when the price hits Moving.or position will be risk free or close .

PTW NON REPAINT TRADING SYSTEM + HISTOGRAM Non-Repainting , Non-Redrawing and Non-Lagging Trading System.
Does the following: - Gives Accurate Entry and Exit Points - Scalping, Day and Swing Trading - 95% Accuracy - Targets, where to take profits. - Shows Trends, Support and resistance levels - Works on All Brokers - Works on All Currencies, CFDs and Stocks - It does not place trades for you, it only shows you what trades to place. - It works on All Timeframes - It is for Trend or ra

POWER TO GET WEALTHY TRADING SYSTEMS.
NON REPAINT REVERSAL ARROW AND CHANNEL Intra-Day trading and Scalping Strategy: Designed for fast and accurate day trading and short-term trades.
Day and Swing Trading Strategy: Can be used as a reliable tool for day and swing traders who aim for the big moves of the price.
Multi Currencies and Markets: Works on different instruments and markets with its reliable precision.
Multi Timeframes: Can be used on multiple timeframes with good perfor
Elegant RSI indicator can generate RSI divergence with the availability of user defined filters. It can generate voice alerts for RSI oversold and RSI Overbought situations. Moreover it can also generate voice alerts for RSI Divergneces as well as when price breaks above or breaks below the support and resistances created upon divergence ouccurence. The voice alerts are generated in a way that you will know which market has reached the oversold and overbought conditions as well as the rsi Dive
WONNFX iN M5 - Arrow indicator for Forex and Binary Options. Reliable signal algorithm. Indicator not repaint. Indicator working hours: 21:55-23:00. GMT+2. Average winrate = 60-70%.
Recommendations: Timeframe: M5. Expiration: 2-3 candles (1 candle = 5 minutes) Symbol: EURUSD, USDJPY, EURAUD, GBPAUD, EURJPY, AUDUSD, USDCAD, NZDUSD, AUDCAD, AUDCHF, AUDJPY, AUDNZD, CADJPY, EURCAD, EURGBP, GBPUSD, GBPCAD, NZDJPY, CADJPY, XAUUSD

Spider renko arrow is a renko based arrow indicator that gives signal on bar open/intra bar and uses 2 strategies to plot signal. This indicator can be used to scalp one bar TP or to swing trade if used with higher periods in its settings. This indicator never repaints or back paints. ========================================================= Parameters : Entry Period : main signal period Filter Period : signal filter period Alerts ========================================================= HOW TO

Binary atm is a binary options signals indicator that is based on 2 pieces, the first one is in a form of a colored line that tell trend direction and dictates sells on buys only, the second one is an entry signal in a shape of a dot that come on BAR OPEN and never repaints and is not delayed. HOW TO USE : wait for a sell dot to appear on bar open if previous bar had a sell line color than open a sell, your expiry is that same candle close wait for a buy dot to appear on bar open if previous b

Advantages of the Tick Volume Indicator: Identifying Market Sentiment : A predominance of green bars on the histogram may indicate an uptrend or strong buying pressure, useful for determining entry points for long positions. A predominance of red bars indicates a downtrend or strong selling pressure, useful for determining entry points for short positions. Analyzing Market Activity : The indicator helps identify periods of high activity, when significant changes are occurring in the market, and

Trading Dashboard is a useful tool for your multiple trades. It contain information such as : - Breakeven point(price) of your multiple trades, - Loss point(price) of your trades, - Current Trading Day and Session, - Current Time and time left of candles, - Total Lot Buy & Sell, and sum of it - Spread and ATR of current time frame and symbol - Profit-Loss in percentage of your open trade

The RPO (Relative Price Oscillator) is a technical analysis indicator used in Forex trading to measure the momentum and trend strength of a currency pair. It is derived from the Relative Strength Index (RSI) but focuses on the difference between two moving averages of price, usually the closing price, over different periods. The RPO is similar to the MACD (Moving Average Convergence Divergence) but uses relative price levels instead of absolute price levels. Key Components: Short-Term Moving Ave

Description of Fibonacci Levels for Support and Resistance (SNR) with a Statistical Model Fibonacci levels are widely used in technical analysis to identify potential support and resistance levels in financial markets. These levels are derived from the Fibonacci sequence, a mathematical sequence where each number is the sum of the two preceding ones. The key Fibonacci retracement levels are 23.6%, 38.2%, 50%, 61.8%, and 100%.

YK-Fibo Pivot Indicator: Trade Smarter with Fibonacci Pivot Points The YK-Fibo Pivot Indicator is a powerful technical analysis tool that combines the precision of Fibonacci retracements with the insights of Pivot Points. Whether you're a novice or seasoned trader, this indicator empowers you to spot profitable opportunities in the market with ease. Why Choose YK-Fibo Pivot? Pinpoint Support & Resistance: By calculating Fibonacci levels based on the previous day's high, low, and close prices, y
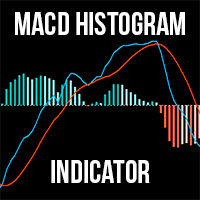
For MT5 The MACD Histogram Indicator is an enhanced version of the traditional MACD indicator, offering superior insights into market trends and momentum shifts. Unlike the default MACD in MT4, this version features a histogram , making it easier for traders to visualize and interpret market conditions. Advantages over the default MACD indicator: Enhanced Visuals: The histogram provides a bar chart representation of the difference between the MACD line and the signal line, making it simpler to i

Backtest with good trend detection results from January 2023
EURUSD Time frame: m15, m30, H1
AUDUSD Time frame: m15, m30 NASDAQ Time frame: m15 S&P 500 Time frame: m15, m30 XAUUSD Time frame: m30 BTCUSD Time frame: H4
These are just some of the assets tested (Please note that past results are no guarantee of future results). Note that this is not a complete strategy, you can use this indicator as an entry trigger after your analysis by setting stop loss and take profit values that you d
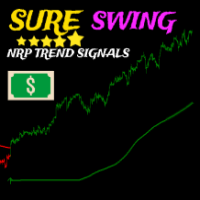
Based on multiple built in indicators-combined together, the Sure Swing indicator is a mutli-time frame trend based arrow indicator that gives swing trading signals, this indicator doesn’t repaint. How to trade : open a buy trade when a green arrow with buy alert appear, stop loss is below the arrow and take profit is 1 time the risk minimal open a sell trade when a red arrow with sell alert appear, stop loss is above the arrow and take profit is 1 time the risk minimal ------------------------

Introducing Smart Gold Pro, a versatile trading indicator suitable for all experience levels. It provides precise buy and sell signals for the gold market, adaptable to any timeframe. Powered by advanced algorithms, Smart Gold Pro accurately analyzes price movements and volume dynamics. What sets Smart Gold Pro apart is its reliability—it doesn't repaint past signals, ensuring dependable insights into potential market reversals. Its user-friendly visual interface on the chart, along with audible
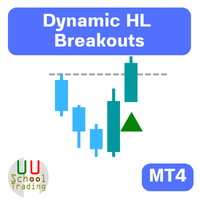
Description of Using the Dynamic HL Breakouts Indicator The Dynamic HL Breakouts indicator is a technical tool designed for trading trend-following assets. Its main purpose is to help traders identify key entry and exit points during strong trending periods of an asset. Components of the Dynamic HL Breakouts Indicator Highs and Lows This indicator calculates and displays the High and Low values for a specified period (e.g., the past 20 days) to create a price movement range for the asset. These

"Trend Finder" is a trend trading strategy that combines market noise filtration and all necessary functions in one tool! The system automatically displays entry and exit points using arrows. Only one parameter is sufficient for configuration. It offers simple, intuitively understandable, and effective trend detection. The intelligent algorithm of the "Trend Finder" indicator identifies potential market reversal points. Often, a good trend can be visually observed on the price chart. However, a

The Your Honor trend indicator is based on price divergence and is designed to analyze and determine market entry points. It can also be used as a filter in trading. The indicator has only two parameters: Period and Level. The Level parameter helps eliminate unnecessary signals. For example, for EURUSD the Level can be set, for example, to 0.0001. Your Honor can be used to both identify entry points and filter signals. The indicator displays information in a clear manner. It is important to reme

The Tin indicator is designed to visually display the current trend in the market. One of the key aspects of foreign exchange market analysis is to determine the trend, which is the sustainable direction of price movement. To do this, the Tin indicator uses algorithms that smooth out sharp fluctuations that do not have a significant impact on the overall trend.
A trend can be either upward (bullish) or downward (bearish). Typically, a trend persists for a long time before abruptly changing di
The indicator calculates delta, the difference in tick volumes between buyers and sellers.
Displays the imbalance of market purchases and sales.
Delta imbalance is a special style of presentation based on the ratio of supply and demand volumes
Using the indicator in real trading mode, you can observe the behavior of the mood of large market participants, thereby you can visually see who currently controls the price and maintains further control.
You can also see the absence of large v
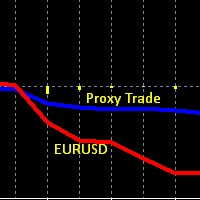
This is an obscure Hedge Fund like strategy, based one of our early indicators on EURUSD originally intended for day trading, while developing and testing the indicator we found out that the data used in this indicator (set of 4 currency pairs) follows EURUSD in a very peculiar way. On one hand these two are correlated, but the 4 currency proxy set tends to lag behind EURUSD, it lags on a day to day basis, and then catches up eventually after several days. And therefore can be used as a proxy

* Pivot Points Magic : Effortlessly Plot Pivot Levels on Any Chart**
Pivot Points Magic simplifies the process of identifying critical pivot levels on any chart, across all timeframes. With just a few clicks, traders can instantly visualize pivot points, enabling them to make more informed trading decisions.
We value your feedback! Share your experience with Pivot Points Magic and help us improve. Your reviews and suggestions are essential for shaping future updates and enhancements to the
This indicator implements the following idea: If the current closing price (or the current average price) overcomes the smoothed value of the minimum/maximum prices for the selected period, this indicates a change in trend.
The indicator effectively follows price movements in trending areas of the market and clearly demonstrates areas of sideways price movement. The product can be useful for both beginners and experienced traders as it is easy to use and intuitive. The indicator allows you to

The KeyLevels Pro indicator is a powerful tool designed to identify significant support and resistance levels based on pivot highs and lows in the price action. This indicator is perfect for traders who rely on market structure and key price levels to make informed trading decisions. It features customizable parameters, automatic detection of pivot points, and visual representation of key levels with optional labels. Features Pivot Detection : Automatically detects pivot highs and lows based on

The “Sharp Scalper” indicator is high-frequency trading tool designed for quick, short term trades in the forex market. It focus on identifying rapid price movement and generating signals for best entry. This indicator is known for its ability to capture small profit opportunities multiple times throughout the day making it ideal for scalpers looking to capitalize on market volatility. The” sharp scalper” indicator employs advance algorithms to detect market trends and fluctuation, helping trade

The 10PIPS Dynamite is a semi-automated cutting-edge Forex indicator designed to automatically revolutionize your trading skills from a being a losing trader to becoming a profitable trader simply by Scalping 10 pips per Trade setup generated by the software. 10PIPS Dynamite Indicator once attached on the main chart it starts an in-depth market analysis based on its unique in-built advanced algorithm which seamlessly combines powerful indicators, statistical analysis, and trend recognition

The SuperTrend MTF indicator is an excellent trend tracking indicator . It can not only display SuperTrend trends within the timeframe of the chart, but also set up to display SuperTrend trends for larger time frames simultaneously . This will be beneficial for grasping trends at a larger time scale and predicting future trends . At the same time, the price of the trend line can also be displayed at a glance, making it easy to observe. Input parameters : ATR period used at chart timeframe

TMA Channel is a price channel obtained through a special calculation method based on traditional TMA . The channel has upper, middle, and lower tracks . When the price approaches or exceeds the upper track, it is already in an overbought state, and attention should be paid to the situation of reversal and decline; When the price approaches or falls below the lower track, it is already in an oversold state, and attention should be paid to the situation of reversal and rise . The indicator will d
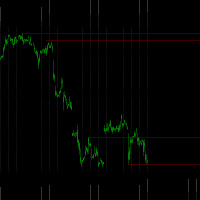

The author's indicator is based on automatically adjusted horizontal and inclined lines from significant market points. In the settings you can specify the period, color and thickness of the lines, disable or enable slanted lines and several other graphic settings.
Recommended rules for entering the market:
Using SELL as an example:
I place a pending order for a breakout - sell stop below the horizontal line of the indicator, then I monitor the work-out, stop loss and take profit are dete

User Manual Download link: https://ontrd.com/our-books/
For all who are asking about indicator ON Trade Numerology Station It obtain about 16 numerology strategies it make together completed unit control your trading . Basic strategies to work with it are 3 strategies statistics about them are the following : 1. RBA levels success rate more then 95%. 2. FF more then 96% 3.RBA SUN 98% We will not say 100 % as they are .. Ratio rates as following : 1.Rba levels more then 1/3 to 1/6 . 2.FF MOR

Average Entry Positions Indicator The Average Entry Positions Indicator provides traders with a clear visual representation of their average buy and sell entry prices on the chart. This indicator calculates the average entry prices for both buy and sell positions and displays them as horizontal lines with customizable colors and labels. By using this tool, traders can quickly assess their overall entry positions, aiding in better decision-making and trade management. Key Features: Displays avera

The Onion Trend Indicator is a revolutionary trend trading and market data filtering solution that combines all the important features of a trend tool in one tool! It is great for any trader, be it Forex or binary options. No settings are required, everything is optimized by time and experience, it works effectively both in flat conditions and in trend conditions.
The Onion Trend Indicator is a technical analysis tool for financial markets that reflects current deviations in the price of

Using the Likdon Forex indicator algorithm, you can quickly determine the current trend in the market. The Elephant indicator tracks long trends and can be used without restrictions on instruments or timeframes. With its help, you can try to predict future price values, but its main purpose is to generate buy and sell signals.
The indicator tracks the market trend, ignoring sharp fluctuations and market noise around the average price. It implements a technical analysis method based on the ass
The LewshaGen indicator is a technical analysis tool used in the Forex market. It helps traders make decisions when to enter or exit a trade based on analysis of market data. Let's look at how it works and why it can be useful.
How the LewshaGen indicator works: Trend Analysis: The indicator analyzes chart data and identifies key turning points and trends in the market. In the chart above, you can see how the indicator helps identify a decline of 180 points (PIP) and a subsequent rise of 330
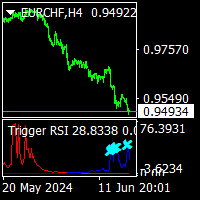
Trigger RSI is a no repaint trend indicator. it can use all pairs and all time frames. easy for use beginner and experienced tarders. it put aqua and gold point on histograms. if aqua point on the blue histogram that is buy signal. if gold point on the red histogram that is sell signal. cnt value has been set to default 1000. you can increase it to see back signals.if there is enough bars on charts. minimum value cnt is 500.

The Dreadnought indicator carefully analyzes price dynamics, identifying temporary weakening of the trend and sharp changes in its direction. By monitoring this indicator, you can easily notice changes in the market and take appropriate action. Entering the market may be easy, but maintaining a position is much more difficult. With Dreadnought, you have reliable support to successfully stay ahead of the trend. This indicator analyzes historical data and provides the trader with the necessary in

Mysterium is a channel indicator without redraws, which is based on double smoothing of moving averages. Unlike channel indicators such as Bollinger, Mysterium uses double smoothed moving averages. This allows you to more accurately determine the direction of market movement, although it reduces the sensitivity of the indicator. However, double smoothing provides a clearer and more stable display of channels on the chart, which helps traders make informed trading decisions.

Volatility Range is an indicator that calculates the range of volatility, predicting key levels such as potential resistance above and potential support below. The indicator can display volatility forecast ranges for the latest 50 days, 10 weeks, or 4 months. By observing these ranges, you can better identify reliable levels where combining with price action enhances trade accuracy significantly.
You have the option to fill the rectangle area with color for easier observation, or leave it unf

Price Action Scanner is an indicator that identifies price behaviors and provides alerts. This indicator can simultaneously detect signals for up to 6 different symbols across various timeframes. By setting a separator, you can add different symbol names and timeframes.
The indicator can detect multiple common signal types such as Pinbar, Engulfing Pattern, Inside Bar, Morning Star, Evening Star, Fakey, and display corresponding information in separate subcharts, indicating the direction of t

Price Action Scanner Pro is an indicator that identifies price behaviors and provides alerts, offering more features and customization compared to Price Action Scanner ( https://www.mql5.com/zh/market/product/118937?source=Site+Profile+Seller ) . This indicator can simultaneously detect signals for up to 15 symbols across different timeframes. You can configure it to detect signals during specific trading sessions such as Asian, European, and US sessions, using different timeframes. This

The Radiant Trend indicator calculates the saturation levels of the price chart. A signal to exit the oversold zone indicates a buy, and a signal to exit the overbought zone indicates a sell. For this indicator, it is usually necessary to set relative values for the overbought and oversold levels – Bottom and Top.
Often a good trend can be seen visually on the price chart. However, an experienced trader must clearly understand the current market situation before opening a position. The indi

The Candlestick Pattern Detector is an advanced MetaTrader 4 indicator designed to identify and highlight candlestick patterns on your charts. Currently, the indicator detects one specific candlestick pattern - the pinbar, known for its significance in technical analysis and trading strategies. This tool provides traders with visual cues, making it easier to spot potential market reversals or continuations. Features: Customizable Colors: Users can customize the colors of the bullish and bearish
Working with the Channel Motion Tracker indicator is as simple as possible. Just react to the arrows that the indicator displays. Each arrow represents an explicit command to action. The signals generated by this indicator are accurate enough to allow you to trade based on this information.
One of the main advantages of the indicator is its ability to build high-quality channels and generate signals for entering the market. This is great for the trader who always finds it difficult to choose

The Geliosx indicator is designed to visually display the trend. One of the key tasks when monitoring the currency market is to determine the trend - a stable direction of price movement. Geliosx uses special calculations to smooth out sharp fluctuations that do not have a significant impact on the overall picture of the price movement.
This indicator is created for those who value their time and money.
The trend can be ascending (bull trend) or descending (bear trend). Typically, the trend

Support and Resistance Levels is an intelligent indicator that displays horizontal support and resistance levels, suitable for traders of different trading frequencies. You can select your preferred trading frequency, and the indicator will automatically calculate the support and resistance levels relevant to that frequency. Among these, the Bull-Bear Line is an interval used to distinguish the strength of bullish and bearish forces, and is an important level.
You can combine it with other in

Product Description: Precision Pattern Indicator for Consistent Profits Elevate your trading with the Precision Pattern Indicator, an advanced tool designed to spot a highly profitable and specific trading pattern. This indicator is your key to unlocking consistent profits with minimal effort. Key Features: Accurate Entry Signals: Receive clear entry signals with green arrows for buy opportunities and red arrows for sell opportunities, ensuring you never miss a profitable trade. Defined Risk Man

The Arriator forex indicator algorithm allows you to quickly determine the current trend in the market. The Elephant indicator accompanies long-term trends and can be used without restrictions on instruments or timeframes. This indicator not only helps predict future values, but also generates buy and sell signals. It tracks market trends, ignoring wild swings and market noise around the average price. The indicator implements a type of technical analysis based on the idea of market cyclicalit

The Sirius X indicator reliably tracks market trends, ignoring wild swings and market noise. Suitable for trading on any timeframe, effectively filtering sudden price spikes and corrections by reducing market noise around the average price. For calculations, the indicator uses iLow, iHigh, iMA and iATR. The output based on these reliable indicators is also reliable. You can set up a sound signal and notifications, for example by email. The indicator does not redraw and works stably.
Configura
FX Strength Meter Pro is a powerful indicator designed for traders seeking optimal trading opportunities in the forex market. Our indicator provides real-time displays of the relative strength of major currency pairs (USD, EUR, GBP, CHF, AUD, NZD, JPY, CAD), helping you quickly identify the strongest and weakest currencies to enhance your trading strategy. Key features include: Multi-timeframe support: From minute to monthly charts (M1, M5, M15, M30, H1, H4, D1, W1, MN1), users can choose which
The MTFMA (Multi-Timeframe Moving Averages) indicator uses multiple moving averages (MAs) across different timeframes to provide buy and sell signals (which do not repaint) in a separate window from the main chart. It is versatile and easy to interpret, suitable for both scalping on smaller timeframes and long-term trading on larger timeframes. Why is it Multiframe? The term multiframe refers to the indicator's ability to use and combine data from multiple timeframes. The MTFMA calculates and di

Why do I need to use the Market PA Monitor:
1.It is impossible to monitor multiple varieties and multiple TF of the market.
The market situation is constantly changing, with numerous varieties, and each variety has different timeframe from small to large. Each TF contains different market changes and trend alternations. Under numerous varieties and multiple TFs, there are countless trading opportunities every day. However, an ordinary trader cannot detect the trading opportunities of each v

Subscribe to the MA7 Trading channel to receive notifications about new programs, updates and other information. Ask questions in the profile on the MQL5 .
Description of work The MA7 Moss indicator is based on the standard Accelerator Oscillator (AC) indicator. Shows overbought and oversold zones. Detailed information about the MA7 Moss indicator.
Indicator settings General settings: Upper level ; Lower level .
Message settings: Send message to the terminal (Alert) – permission to send m

Golden Range 2 is one of the top entry indicators securing its future with its results. Indicator settings: Points = how precise pattern detection is AlertConfirmation = turn on(true) off(false) alert CalculatedBars = how many bars will be calculated
Please leave Positive comments, reviews. Buffer 0 Buy Arrow, Buffer 1 Sell Arrow, Buffer2 Buy Signal(Value:1/0), Buffer3 Sell Signal(Value:1/0) Buy Green, Sell Red

Powerful Order Block indicator in Tradingview platform. Indicator type: Price Action indicator Introduction: The Order Block Indicator - Elevating Your Price Action Analysis. If you're seeking a comprehensive Order Block indicator on the MQL5 platform, look no further.
Firstly, according to this indicator, an OB is understood as a zone of pending orders from large institutions that haven't been fully executed, revealing themselves in the market through subtle signs. Prices react strongly wh

The Listo trend direction indicator shows the current trend direction by coloring the bars in red and blue. It is suitable for all currency pairs and timeframes. It is important to remember that to enter the market it is necessary to take into account an integrated approach and additional signals. The operating principle of the indicator is based on automatically determining the current state of the market and analyzing historical data when placing it on a chart.

Gann Angles Indicator The Gann Angles Indicator is a powerful technical tool based on the theory of William Delbert Gann. It helps traders identify potential support and resistance levels, as well as trend direction across various time intervals. Key features: Automatic determination of extremum within a specified time range Construction of 9 Gann Fan lines with angles of 82.5, 75, 71.25, 63.75, 45, 26.25, 18.75, 15, and 7.5 Flexible line color customization Adaptation to both upward an

Get rid of trading confusion and embrace stable income! Are you still worried about finding a low-risk and stable profit method? Are you still anxious about judging the market direction and controlling the risk of placing orders? The new cross-platform arbitrage indicator helps you easily achieve stable returns! Accurately capture arbitrage opportunities without you having to worry! The cross-platform arbitrage indicator is a powerful tool that can monitor the price differences of the same finan
The MetaTrader Market offers a convenient and secure venue to buy applications for the MetaTrader platform. Download free demo versions of Expert Advisors and indicators right from your terminal for testing in the Strategy Tester.
Test applications in different modes to monitor the performance and make a payment for the product you want using the MQL5.community Payment System.
You are missing trading opportunities:
- Free trading apps
- Over 8,000 signals for copying
- Economic news for exploring financial markets
Registration
Log in
If you do not have an account, please register
Allow the use of cookies to log in to the MQL5.com website.
Please enable the necessary setting in your browser, otherwise you will not be able to log in.