Divergence Strategy All Indicators
- 지표
- Issam Kassas
- 버전: 1.0
- 활성화: 20
Description:
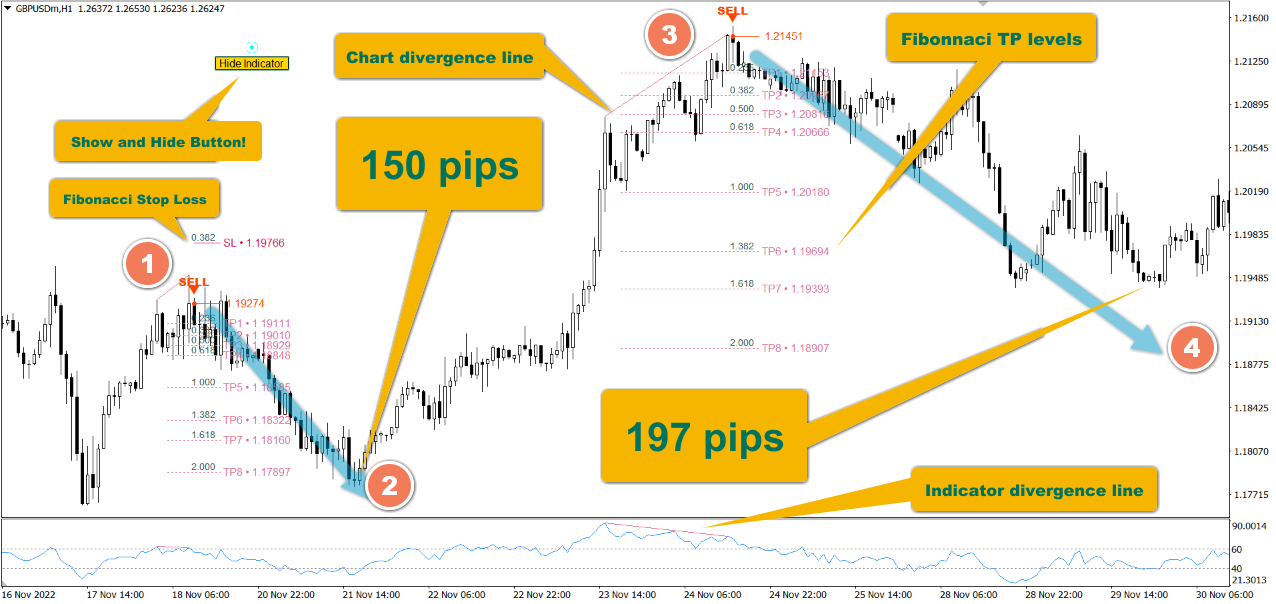
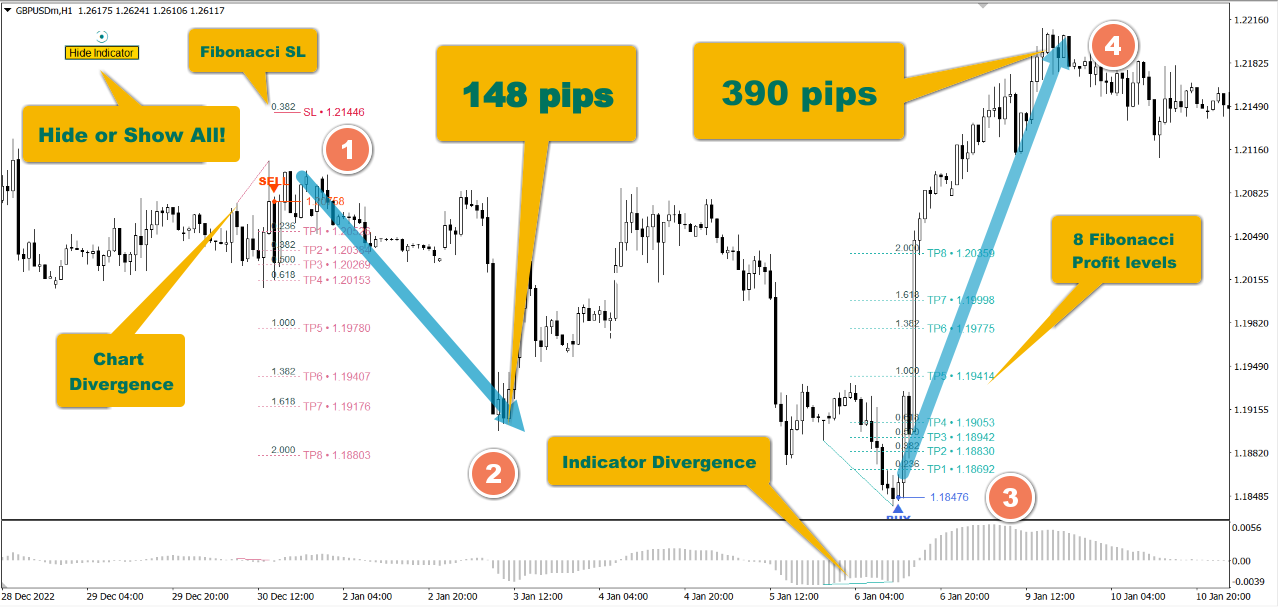
The "Divergence Strategy Indicator" is an advanced technical analysis tool designed to identify potential trend reversals and continuation opportunities in the market through the powerful concept of divergence. By detecting divergences between price and all kinds of oscillators like MACD, RSI, ATR or Stochastic ... the indicator helps traders uncover hidden opportunities, signaling potential trend shifts. Real-time alerts keep users informed when new opportunities are detected. the indicator offers stop loss and multiple TP levels to help make the life of traders lot easier.
Features:
- 13 oscillators all in one.
- Alerts to phone and email in real time.
- Comes with SL and multiple TP levels drawn on the chart.
- Up to 8 TP levels.
- Smart button to hide and show all divergences patterns.
- Hotkey to hide and show all divergences patterns.
- Invest in an all in one instead 1 indicators 13 indicators in one.
Related Topics:
Divergence Detector, Divergence Finder, All in One Divergence, RSI Divergence, MACD Divergence, Stochastic Divergence, ATR Divergence, Divergence Pattern, Reversal Pattern, Divergence Reversal, Divergence Indicator, Divergence Analyzer, Divergence Scanner, Hidden Divergence Finder, Multi-Oscillator Divergence Tool, Complete Divergence Analysis, Relative Strength Index (RSI) Divergence, Moving Average Convergence Divergence (MACD) Identifier, Stochastic Oscillator Divergence, Average True Range (ATR) Divergence, Divergence Pattern Recognition, Reversal Pattern Identifier, Reversal Divergence Finder, Comprehensive Divergence Indicator, Divergence Trend Analyzer