YouTubeにあるマーケットチュートリアルビデオをご覧ください
ロボットや指標を購入する
仮想ホスティングで
EAを実行
EAを実行
ロボットや指標を購入前にテストする
マーケットで収入を得る
販売のためにプロダクトをプレゼンテーションする方法
MetaTrader 5のためのエキスパートアドバイザーとインディケータ - 155

Welcome Today I'll bring you a Trend Breaker with a 90% of accurate rate. It SUPPORTS ANY FUNDED CHALLENGE! Invests now and if you don't get any profit within a week you'll get a REFUND FOR FREE! WORKS WITH ANY MARKET , feel free to test it out without any problem at all. If you have any problem or question you can just contact me thorugh my Instagram Page: https://instagram.com/tomybevi98 Feel free to test the Demo First!
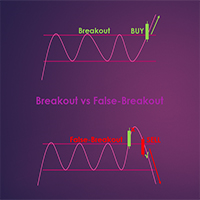
Breakout & False-Breakout with Grid is the EA build with one single shot and multi-trade based on Support & Resistant Breakout or False-Breakout.
First Trade: Off/On first trade First Trade Mode: 1. False-Breakout: It will open first trade when it detected a False-Breakout 2. Breakout: It will open first trade when it detected a True-Breakout Series Trade: Off/On sequences trade Series Trade Mode: 1. Dual_BUY_SELL_Series: Sequences trades will be open both BUY or SELL
UR パルススカルプ MT5 ペースの速い市場で究極の優位性を求めるスキャルパー向けの調整済み取引指標
UR PulseScalp MT5 は、ペースの速い市場で究極の優位性を求めるスキャルパー向けの最先端の取引ソリューションです。 この革新的なインジケーターは、ボラティリティ、マネーフロー、相対強度の力を組み合わせて、非常に正確で信頼性の高いシグナルを作成する、科学的に調整された式に基づいて構築されています。
UR PulseScalp MT5 を使用する利点:
快適なインタラクティブパネル M5 と H1 で高精度 初心者におすすめの EURUSD ペア 設定なし あらゆる種類のアセットに調整 すべての波をキャッチするわけではありません - それがその美しさです。 それを待たなければならない場合でも、最良のエントリを分析します。 ツールの最新情報を入手できる特別な電報チャットがあり、何か不足していると感じた場合はリクエストを送信することもできます!
UR PulseScalp MT5 を選ぶ理由
あなたがベテランのスキャルパーであろうと初心者であろうと、「UR Pul

This EA will help you to trade automatically Gold or XAU/USD. Click here for signal: https://www.mql5.com/en/signals/1854961 Minimum deposit: $5,000 Timeframe: M1 Tested broker: XM Global Please try backtest this EA first before you buy it. Backtest 1 January 2022 - 1 January 2023 growth the account from $5,000 to $17,000. Backtest 1 January 2021 - 1 January 2023 growth the account form $5,000 to $29,000. For more information about this EA you can contact me at syamirc91@gmail.com. "DISCLAIMER
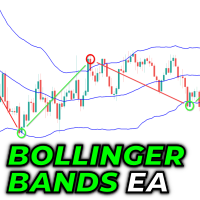
This is a simple Bollinger Bands EA with dynmaic lot size, trailing stop loss and reverse exit signal. EA works with open ticks. The coding tutorial for the core logic is on my youtube channel. If you have any questions or suggestions for improvement, you can write to me at any time.
Current components: Magicnumber Dynamic lot size (fix lots/fix amount/percent of account) Bollinger band entry signal Trailing stop loss Reverse Exit signal

AC Trade Assistant – Simplify Your Trading Experience The AC Trade Assistant is a compact and efficient tool designed to help traders execute orders quickly and manage trades with ease. Whether you’re a beginner or an experienced trader, this assistant streamlines your workflow and enhances your trading performance. Key Features : Compact Design : A non-intrusive dialog box that keeps your chart clean and organized. Fast Order Execution : Place market orders, pending orders, and manage risk

O Scorpion Trader é um robô trader de negociação automática projetado especificamente para a bolsa brasileira B3. Ele utiliza uma estratégia exclusiva baseada na técnica japonesa Heikin Ashi para identificar pontos de reversão (mean reversion). Para calcular a tendência, o robô usa a técnica de médias móveis e candlesticks Heiken Ashi. Ele posiciona ordens de compra e venda nos pontos de reversão, com base em stops fixos ou variáveis determinados com base em candlesticks anteriores. O robô ta

Mean Reversal Heikin Ashi Indicator calculates special trade reversal points based on Heikin Ashi candlesticks patterns. This indicator can be used on all symbols, even in Forex or B3 Brazillian Markets. You can configure just the position of each arrow. Then, after include the indicator on the graphic, pay attention on each arrow that indicates a long or short trade.

- UPDATE 1.2 IS OUT - PLEASE READ ALL THE DESCRIPTION BEFORE USE IT THE EA IS ALREADY OPTIMIZED FOR EURUSD H4, YOU ONLY HAVE TO CHANGE MAX ORDERS TO 5 IN ORDER TO WORK. LL Long Term EA is an algorithm developed to apply a long-term strategy . The main features are the use of grid pending orders for both recovery and continuation in the trend, the use of the martingale, selectable via the multiplier . Processing a series of data through various indicators , the EA selects the best possible entry

Discount on all my products until 01.05. Prestige は、完全自動の外国為替取引アドバイザーです。 Expert Advisor の監視: https://www.mql5.com/ru/signals/1856929 Prestige は、平均注文を使用して固定損失を削減する EA です。 EA は、Wyckoff 価格波分析と最後の取引セッションの価格/出来高分析を使用します。ワイコフ チャート パターンは、結果の分析と予測におけるその有効性が長い間証明されてきたので、注文のグリッドを使用するアドバイザーがあなたの預金を信頼できるというまれなケースです。アドバイザーは 5 つ以下の平均注文を開きますが、アドバイザーにはストップ ロスがあります。これは、最悪の場合、アドバイザーが預金全体を無効にしないことを意味します。 EA のセットアップと使用は非常に簡単で、1 つのチャートから 6 つのペアすべてで使用できます: EURUSD GBPUSD AUDCAD AUDNZD CADCHF NZDUSD.必要なことは、Expert Ad
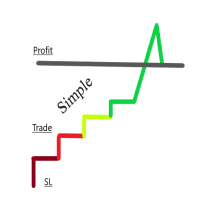
This EA is all about Safe Trading it uses multiple timeframes for detection of trend and after checking multiple conditions it go for either Buy or Sell. There are 2 Safety filters in it 1st with the Stoploss and 2nd is with the name of "Max DD To Close All". This EA is Profitable on US30 with default settings. You can use it (on your own) on other pairs. Timeframes are automatically selected by EA so, don't worry about that.
Couple of things you need to understand about EA are: 1. When you set

NEW UPDATE 1.4 :
Range Breaking EA. The perfect solution for smart traders who want a simple and effective way to catch big market moves, whether it's a news event or just day-to-day breakouts, Range Breaking EA will get the job done! Range Breaking EA is an Expert Advisor that uses a range breakout strategy to trade financial instruments. This EA is designed to work with all types of financial instruments, including Forex, stocks, commodities, and Crypto. Its key feature is the ability to ide
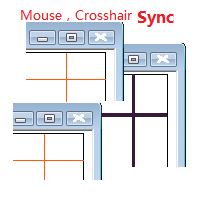
Objective: Mouse Crosshair Synchronization In multiple-charts. Syncronization crosshair for other timeframes. Syncronization mouse for other timeframes. Use: 1. Download the program and put it in the dir (MQL 5 / Indicators or MQL 4 / Indicators). 2. Load this indicator to the charts that need to be synchronized. It just work. 3. Support the left and right keys of the keyboard. When the left and right keys move crosshair on a chart, the same symbol charts will a

Multi-Timeframe Moving Average Indicator Provides you a simple edge. How? Let me explain.. Have you ever tried using Moving Average Strategy to trade but you find those entries too late? Have you ever tried to trade with moving averages on 1 Timeframe chart (example 4h) and when i try to lower the timeframe, moving averages change position? If you answered Yes to Both questions , This indicator is the solution for you! 1- You can visualize lower timeframes moving averages on higher timeframes ex

I present my new EA for investments based on one of the most famous indicators of all time, the RSI indicator. It identifies reversal opportunities in the market to take profits on fast and accurate price movements. With a win rate of 70% to 90% without using a martingale. Position size is always kept under control, minimizing the risk of significant losses. This EA is customizable, allowing you to tweak the parameters to suit your basic investment needs and objectives. Tips for other setups: h

...Forex Moon Ai the intelligent scalper...
重要
バックテストをエラーなく実行するために、以下の設定を行う必要があります。
制限時間範囲:Timerange = True
を選択する必要があります。 ブローカーのロールオーバー中にEAが取引しないように、時間を設定する必要があります。
マーチンゲールやグリッドのような危険な戦略は使用しません。すべての取引はSLとTPで実行されます。
Forex Moon AIは、インテリジェントなSL計算を行うスキャルパーです。
Lifesignal : https://www.mql5.com/de/signals/1819818?source=Site +Signals+My
様々な指標からの信号をAIが変換します。
中にはユーザー設定があるものもありますが、きれいな結果を得るためには、すべての設定をデフォルトのままにしておくことをお勧めします。
目的に応じて自由に設定を変更してください。
初期設定値 インジケーター
ボリンジャーバンドのレンジ期間=69
M
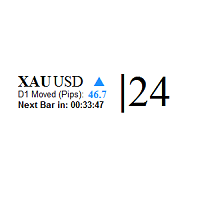
This indicator shows: The market spread Current candle time left to be closed and the pips of market movement from the beginning of the day play sound when candle is going to be closed This is an extremely useful tool for watching the spread rise and fall, allowing you to enter the market at just the right time. This indicator will help you stay out of the market when the spread begins to rise and help you get into the market as the spread begins to fall again.
very useful for day trading and s
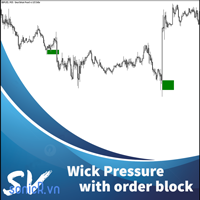
Multiple Wicks forming at OverSold & OverBought levels create Buying and Selling Pressure. This indicator tries to capture the essence of the buy and sell pressure created by those wicks. Wick pressure shows that the trend is Exhausted. Order block should display when buying or selling pressure wick. When price go inside buy order block and up to outside order block, trader should consider a buy order. If price go inside buy order block and down to outside order block, trader should consider a s

THE SWAP KING. Be the Bank.
THE SWAP KING is a multicurrency bot that is simple but ingenious. The Bot was created two years ago and has been growing my account since then. If you have traded with CFDs before you will know that you either need to close all trades before midnight and weekend OR you will be charged a hefty fee for keeping the trade(s) open. Unfortunately that leaves us traders only three options: scalping, spending lots on spreads and commissions for closing and opening trades o

Price DNAは、複合比率加重移動平均を利用することで、遅れを少なく し、トレンドの早期発見を可能にするトレンド指標です。このインディケータは再描画されず、どのような時間枠の金融商品にも適用することができます。
プライスDNAの仕組みは? このインディケータは、現在の取引の方向を示す複数の 波を チャート上に表示します。 緑の5つの波と赤の5つの波は、それぞれ強い強気と弱気の傾向を示しています。 個々の取引スタイルに基づき、すべての波または特定の数の波がトレンドの反転を示したときに、ポジションをオープンまたはクローズすることを選択することができます。強気と弱気の波の数は、常に端末の左上隅に表示されます。
設定 個々のDNA波の周期を調整することで、Price DNAインジケータを、より積極的に、あるいはより慎重に、自分の取引スタイルに適合させることができます。 第1波の周期第1波の周期 第2波のピリオド第2波の期間 第3波のピリオド第3波の期間 第4波のピリオド第4波の期間 第5波のピリオド第5波の期間 乗算器複利の倍率
テストとインストール このインディケータをテストするに

CAP Ashmiza Trading EA MT5 , a cutting-edge trading robot meticulously developed over 16 years of algorithmic trading expertise. Designed for traders who truly care about their money, are committed to avoiding losses, and seek steady growth and robust trading logic, this expert advisor (EA) is your ultimate tool for achieving consistent success in the forex market.
Why Choose CAP Ashmiza Trading EA MT5? Unmatched Experience : Developed by an algo trading expert with over 16 years of experience

Trade on Binance in MT5! GRat_Crypto is a tool for manual and automated trading , including ANY available EA, ANY cryptocurrency on most popular crypto exchange Binance in the familiar MT5 environment 24/7. Features 1. ALL instruments of the 5 most popular crypto exchange Binance . 2. The ability to place ANY type of order available in MT5, both market and pending, to modify orders and positions, to delete orders and close positions (even partially), to set trailing stop and trailing profit.

Sniper Zones are our best kept secret for trading the forex markets profitably and extremely simple ! After years of profitable trading we are launching it to the public !
After thousands of hours of testing, we have developed an indicator that simplifies trading to the point where anyone can become a profitable trader. There exists certain zones and areas in the market that are used by institutions to move price and cause retail traders to lose their money ! We have done the hardwork and mad

Advanced Trader MT5 is a fully automated trading robot developed by using custom indicator "Trend for MT5", which can be found here . The expert has been tested on AUDNZD、NZDCAD、AUDCAD and USDCHF using historical data of many years, you can also test it using real ticks history data on MT5 backtest platform. Even if you don't want to 100% automatically trade by it, you can still use it as a good tool for trading, there is parameters for you to control the EA trading and use it as a trade assist

With dynamic Moving average, you can estimate the price movement, predict the next trend of price and have a better decision. Parameters setup: Period start <= Period Stop Period start >= 1
Maximum lines is 100 You can customize Moving average method: Simple averaging, Exponential averaging, Smoothed averaging, Linear-weighted averaging and price to apply: PRICE_CLOSE: Close price
PRICE_OPEN: Open price
PRICE_HIGH: The maximum price for the period
PRICE_LOW: The minimum price for the period
PRIC
2023年2月
津波
アイデア: 急激な値動きを待っています。 トレンドに合わせて一次発注を行います。 価格は同様の値に戻ると考えているため、価格の動きを変更した後、反対方向に 2 番目の注文を出します。
フェーズ 1 - 待機中
1 分足チャートの平均価格が T1 分で D1 ポイント以上変化するのを待ちます。
価格の動きに合わせてポジションを開きます - 価格が下がれば、買い注文が上がると売り注文が上がります
注文パラメータ:
- サイズ - パラメータで指定
- テイクプロフィット - 未定義
- StopLoss - TV1 の値の 3 倍に等しい緊急値。EA で注文を閉じることができなかった場合、障害が発生した場合にストップロスが設定されます。 通常、オーダーはプログラム レベルからクローズされます。
フェーズ 2 - 最初の注文
価格が極端な価格からTV1ポイント変化した場合、注文を終了します。
- 買い注文の最大価格から TV1 だけ下がります。
- 売り注文の最低価格から TV1 だけ増加します。
フェーズ 3 - カウンター オーダー
最初の注文をクローズし、
The Scalping Project EA follows a scalping breakout strategy. It trades the breakouts from relative highs and lows. For the entry stop orders are used for the fastest possible execution. Profits can be secured by the adjustable trailing stop. Since the strategy works with small average profits it is highly suggested to trade with a low spread and commission broker. Trading costs are crucial here! The backtests shown in the screenshots were done with the default settings. There might be better or
ONLY 3 COPIES OUT OF 10 LEFT AT $299! After that, the price will be raised to $349. IMPORTANT! Contact me immediately after the purchase to get instructions and a bonus! Advanced Fibo levels is a trading robot for the trading on forex. This is a Fibonacci system that designed to trade for most popular Fibonacci strategy that's completely automated. Warning:
I only sell EA's through MQL5.com. If someone contacts you saying it is me trying to sell you something, they are a Scammer. Block and repo

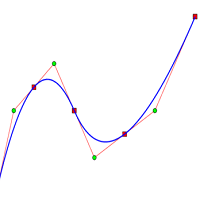
Fit line supports to extrapolation next movement of market, support for buy/sell decision. Indicator using spline algorithm to extrapolation. You can change number of spline with parameter "PointsNumber" and number of extrapolation point with "ExtrapolateBars". Eextrapolation points will be save into csv format, with prefix in parameter "PointsPrefix", and store in folder File of Data Folder.

Time in Trade Expert Advisor は、指定された時間に未決注文をオープンする戦略を適用し、自動切り替えで冬時間と夏時間も使用します。 シグナルが発生すると、取引ロボットは売買の等量で未決注文を開きます。 取引に使用される時間枠は 5 分です。 指値注文のトリガーは、以下に応じた急激な価格変動です。 取引セッションの開始/終了; 重要な経済指標の発表; トレーダーの最大数の時間間隔。 ユーザーは次の設定を使用できます。 Open Price - BID および AKS 価格に基づいて注文の始値レベルを設定します。 Stop Loss - 望ましくない価格変動の場合のストップレベル; Trailing - フローティング ストップ ロス レベル; Volume - 固定取引量 (リスク = 0 の場合のみ有効); RISK - リスク レベル (%): 0 - リスクが設定されていません。 固定ボリュームが適用されます。 1 以上 - 無料資金のリスク レベル %。 HOUR_n - 指定された時間 (サーバー時間) に取引を有効/無効にします。 true - 許可

Fight Club GBPUSD is a trend trading EA that has stood the test of time with a lot of positive years. it trades Long or Short with a specified percentage risk. The EA will set lot size, stop loss and take profits and timed exit. Inputs: Percentage risk Tips: - Sometime is better to trade with small risk and participate in many markets.
- The key to Algo trading is letting the EA do its thing. Try it, add this EA to your portfolio. Please leave a review or a comment. :)

This bot is designed for high-frequency, small-profit trades, ideal for prop trading challenges like FTMO and The 5%ers. Feel free to reach out with any questions or for further information: https://www.mql5.com/en/channels/newcapital Key Features: Built-in Equity Stop Function : Automatically halts trading at set equity levels for better risk management. Trade Entry Randomization : Adds variability to entry points, reducing predictability. Adjustable Trade Distance : Customizable trade distan
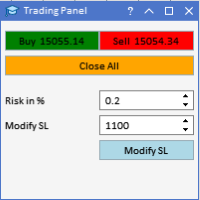
Automatic Trade Calculation Panel One-Klick-Trading Automatic calculation of Lot sice Atuomatic calulation of Stop-Loss and TakeProfit Up to 3 partial closings Trailingstop (Stop-Loss moves automatically) The lot size is calculated by the previously determined risk (e.g. 1.0% of the account size) and the distance of the Stop Loss from the entry point. The distance from the Stop Loss to the entry point results from the ATR indicator multiplied by a freely selectable factor. The Stop Loss and

BUY ONE FREE ONE, contact me after purchase for your special gift. Live Signal: LINK
Premium Ace MT5 emerges as a cutting-edge Expert Advisor designed for the MetaTrader 5 platform, specializing in exploiting market trends through a refined trend-following strategy. This document delineates the technological innovation, strategic implementation, and empirical validation that establish Premium Ace MT5 as a formidable tool in algorithmic trading. By integrating sophisticated analytical models

Using this robot, you can avoid sudden stops without setting a limit, especially during news. This robot will not enter the trade until the trigger is taken in the specified time frame. The amount of risk and volume of transactions is completely dynamic and customizable. Also, by specifying different goals, after reaching each of the targets, it will automatically become part of the close volume. Let us know what you think about correcting this indicator. If accepted, it will be applied immediat

2015年からのバックテスト | MT4版 | FAQ MiloBot PRO –2年以上にわたって開発、テスト、最適化された著者の戦略に基づいているForex アドバイザー。 戦略の信頼性の指標は、合計100,000ドル以上の預金を持つ実際の開発者アカウントと考えることができます。 MiloBot PRO の高度なアルゴリズム戦略により、毎月一貫して利益を上げることができます。 また、著者の指標により、EA は市場の反転の瞬間に可能な限り正確に市場に参入することができます。 開発者の本当の意見をチェックしてください: 2019 年 11 月からのアカウント (利益 +1520% 以上): myfxbook.com/members/Malik87/robot-advisor-launched-november-11/3623023 私たち自身もMiloBot Proを取引に使用しているため、常に新しいものをテストしてEAに実装しています。すべてのクライアントは更新を受け取り、最新かつ最も信頼できるバージョンのアドバイザを使用します。 Sergey Ermolov と

Able Turn indicator.
Currency pairs never rise or fall in a straight line. Their ups and downs are interspersed with rollbacks and reversals. Every rise and fall is reflected in your emotional state: hope is replaced by fear, and when it passes, hope appears again. The market uses your fear to prevent you from taking advantage of a strong position. At such moments you are most vulnerable.
Everything will change if you use the Able Turn indicator.
The Able Turn indicator was created to neutra

Your Helper is a global trend indicator. The indicator should be used on a period not less than H1, H4 and higher is recommended. Despite the apparent simplicity of the indicator, it has complex analytical algorithms inside, with the help of which the system determines the moments of entries. The indicator gives accurate and timely signals to enter and exit a trade that appear on the current candle.
The main purpose of this indicator is to determine the moments of entries and exits from transa

Crash Wizard Indicator works on 1 Minute time frame of Crash 500 and Crash 1000 ONLY. This indicator will plot a Red (x) on the Drop candle . it will plot Green arrows as BUY entry signal and will plot orange (x) as multi-exit points. You the indicator is 85% Accurate . you may use it together with Price action. NOTE: To use the indicator , make sure you have an account with Deriv the only synthetics indices broker. DONT use it on any other assets.

This is a machine learning trend following strategy based on the Ichimoku Kinko Hyo indicator combined with market volatility and volume metrics. It works best on the H1 Chart . The signals utilized to begin trading are carefully vetted via the machine learning capability, and a sophisticated algorithm ensures that the trader remains in the trend for as long as possible. Features.
This is a fully automated multi-symbol expert advisor. It works on the following symbols USDJPY, AUDJPY, CHFJPY, EU

Live signal https://www.mql5.com/en/users/datbh/seller
[MT4 version: https://www.mql5.com/en/market/product/93601 ] ! Next price --> $699 and final: 1779$ This is a smart grid-based automated trading system, meticulously developed from over a decade of trading experience. The system leverages quantitative analysis, trend evaluation, and key resistance levels to execute precise entries. Our EA specializes in trading three major currency pairs: AUDCAD NZDCAD AUDNZD Designed with both efficiency a

It is enough to optimize Regular once, for example, a month. After that, Hanvest shows excellent results in the forward period. There are several parameters to optimize. In addition to the indicator itself, it is necessary to optimize the stop levels. You need to trade on the M1 timeframe. The Expert Advisor was created for trading on EURUSD, but it can also work on other currency pairs, you need to select it. The Expert Advisor automatically determines the number of digits in quotes and give

The Trend A indicator is a forward-looking arrow indicator that reliably tracks the market trend, ignoring sharp market fluctuations and noise around the average price. It catches the trend and shows favorable moments of entering the market with arrows. The indicator can be used both for pipsing on short periods and for long-term trading. The indicator implements a kind of technical analysis based on the idea that the market is cyclical in nature.

Impulse Fibo indicator is used to determine price levels after some price impulse occurs. How to use it you can see in screenshots and video. In the indicator setup you can fix two different setups for two different patterns. For drawing convenience also two different rectangles can be easy put on the screen to draw support/resistance levels. .
Inputs Draw pattern 1 Line color - choose color from dropdown menu
Line style - choose style from dropdown menu
Line width - enter integer number 1,2,3.

The Turtle EA is a fully automated robot that uses a very efficient strategy and good money management. These are the suggested Settings: EA for trading long term, Best Results Starting from 2023 Lot Amount suggested use the Dynamic Position Size and Risk % per trade. Trade XAUUSD, USDCHF on 5m, settings for XAUUSD are the standards of the program, for USDCHF are the comments near the inputs The screenshots are based on a backtest using Real Tick data on a 1000$ account on a 3 months backtest d

Big Trader use special orders for buying, selling, taking profit, and closing the orders. When Big Traders want to open a position with volume, they do not randomly place a position to upset the price and trigger their order at a worse price that may result in lowering their profit . Order blocks are special kinds of supply and demand zones formed when there is a block order. It comes into place due to buying and selling of big traders.
This Powerfull EA using Big Traders Mindset Powered by Ar

Only 7 copies of the EA left at $499! Next price --> $599 Live signal: https://www.mql5.com/en/signals/1866411 [MT4 version: https://www.mql5.com/en/market/product/94064 ] Discover the power of MSC ProMax EA , a fully automated trading system designed to capitalize on the highly effective “pullback” strategy. Perfectly suited for trading popular pullback currency pairs like AUDCAD, AUDNZD, and NZDCAD , this system leverages key Forex market patterns — specifically the price reversal aft

Thank you for your interest in the Boss EA, Currently the Boss EA is only available for MT5
THERE ARE ONLY 10 COPIES OF THE BOSS BANNED EA ARE LEFT AT $749 <--- NEXT PRICE ---> $999
EXPLANATION:
Introducing the Boss Banned EA, a powerful breakout scalping system designed to trade three currency pairs simultaneously with low drawdown and high win rates. This expert advisor uses advanced algorithms to identify key support and resistance levels, as well as price patterns, to generate highly ac

EURUSD M5 Set -> start 01:00 | end 04:00 | TP3 | Pending Distance -100 | Multiplier Pending 150 | Risk% 0.1 | Max Orders 5 - Recommended Deposit 1.000$
"like all expert advisors, LL Night Scalper EA works for you, but you can't always leave it alone. use it with care and attention, choose a time slot and decide your money management first. the best results are obtained by using with care, avoiding important news that generate large movements and keeping the EA off on high volatility days.

Signaling is a very interesting trend indicator. The Destroyer of Chaos indicator helps to identify either a new or an existing trend. One of the main definitions for monitoring the currency market is a trend, which is why this indicator was created. Its signals are based on a reliable algorithm. When used simultaneously on multiple timeframes, this indicator truly "makes the trend your friend". With it, you can follow trends on multiple timeframes in real time. One of the advantages of the indi

Provided Trend is a complex signal formation indicator. As a result of the work of internal algorithms, you can see only three types of signals on your chart. The first is a buy signal, the second is a sell signal, and the third is a market exit signal.
Options: CalcFlatSlow - The first parameter that controls the main function of splitting the price chart into waves. CalcFlatFast - The second parameter that controls the main function of splitting the price chart into waves. CalcFlatAvg - Para

Magnetic levels for MT5 is a great addition to your trading strategy if you use support and resistance levels, supply and demand zones. The price very often gives good entry points to the position exactly at the round levels and near them.
The indicator is fully customizable and easy to use: -Choose the number of levels to be displayed -Choose the distance Between The levels -Choose the color of the levels.
Can be added to your trading system for more confluence. Works very well when combined

We publish the indicator as a useful tool in trading and call this indicator the "Swiss Army Knife" because it provides many possibilities and combinations to help understand the material on the "Masters of Risk" trading system. The indicator itself is not part of the tools used in the "Masters of Risk" trading system.
The indicator consists of 3 separate multi-timeframe indicators, which in combination with each other help to reduce the "noise" of false signals. The first of the indicators are

Deer MA は、金融市場での効率的なトレードを目的とした高度に進化したトレードロボットです。この完全自動化されたソフトウェアは、2つの移動平均線とその他の高度なインジケーターを利用して市場を分析し、スキャルピングまたはトレンドトレード戦略に基づいてトレード決定を行います。同ソフトウェアの最新鋭のアルゴリズムは、迅速かつ正確にトレードを特定できるようにし、先進のマネーマネジメント機能によりリスクを最小限に抑え、結果を最適化します。初心者のトレーダーからベテランのプロフェッショナルまで、ディア・マはどんなトレーダーにとっても貴重な追加要素となります。
初回は79ドル、次回からは99ドルです。
アプリケーション: USDJPY 1H MEAN_MOVING
戦略: Deer Maが使用する戦略は、短期移動平均線が長期移動平均線を上回った場合または下回った場合にポジションを取る、簡単な移動平均線クロスオーバーシステムに基づいています。しかし、この基本的な戦略を改善するために、Deer Maはさまざまなカスタマイズ可能なパラメータを提供しており、さまざまな市場環境や取引スタイルに合わせ

!!!ATTENTION TRADERS!!! Bug hunters will get an EA of their choice FOR ABSOLUTELY FREE!!! If you purchase any of my EAs and happen to find a bug, report it to me and I'll gift you one of my EAs here on MQL5 for ZERO dollars, no strings attached! Description: Dualis is an EA that utilizes a custom logistic regression algorithm to make trades. This trading methodology has a maverick approach, because the algorithm puts all of its focus on detecting anomalies in the market that it can secretly exp

!!!ATTENTION TRADERS!!! Bug hunters will get an EA of their choice FOR ABSOLUTELY FREE!!! If you purchase any of my EAs and happen to find a bug, report it to me and I'll gift you one of my EAs here on MQL5 for ZERO dollars, no strings attached! Description: Golden Mountains is a next-gen trading robot for the XAUUSD pair that successfully applies the multiplicative weight update method (MWUM) on the indicators that it uses for trading. This confirmed methodology is as simple as it is effective

Perfect Sniper! is a triple indicator with support resistance detection, downtrend channel, uptrend channel Bands included! where he hunts the rebounds in the red lines for sale, in the green lines mark purchase, in the lower bands that are the breaks gives another second entry either buy or sell, perfect to take advantage of the double entrance, It is used in any temporality, It is used to scalp and long on h1 or h4 to D1. It works for Forex markets, All pairs. It is used for the synthetic inde

BandSniper! band indicator , programmed %100 to hunt rebounds on the bands both bounce for the downside and bounce for the upside,, It serves to hunt trends too! where you can see in the photo marked with arrows the buy and sell signals. can be used at any time, Ideal for scalping and long h1 or h4! works for all Forex pairs! and for all pairs of synthetic indices ! World Investor. Good profit

EA Toolkit is a library that allows any developer to quickly and easily program Advisor experts. It includes many functions and enumerations such as trailing stop, lot, stop loss management, market trading authorisations, price table updates, trading conditions and many more.
Installation + Documentation : You will find all the information to install this library and the documentation of its functions on this GitHub : https://github.com/Venon282/Expert-Advisor-Toolkit WARNING : The installat

Fast and Furious EA is one of the most wanted Expert Advisor programme or as some would like to refer to as ‘ TRADING BOT ’ in the market. The Fast and Furious EA, just as the name suggests, is an EA that is programmed to precisely scan the market and come up with validated trading signals . These signals can either be used automatically by the EA to make market orders or can be manually used by the trader to make personal trading decisions and be integrated to the trading system. The Swiftness

Fully automated expert advisor. It was developed for quick overclocking of the deposit.
It has a minimum of settings, which makes it easier to set up and speed up the optimization of the EA if necessary. The same settings are used for long and short positions. Thus, the Expert Advisor works equally in both directions. All orders are set with the TakeProfit parameter. And this guarantees the closing of transactions regardless of the quality of the Internet.
My recommendations:
Using a levera

A depth of market product is a powerful trading tool that provides a comprehensive view of the supply and demand levels for a particular financial instrument. It provides traders with a real-time display of all the buy and sell orders that are currently available in the market, allowing them to make more informed trading decisions based on the most up-to-date information available. With Valle Depth Of Market , traders can see not only the best bid and ask prices, but also the volume of orders at

Blind Broker System の唯一の目的は、取引計画を隠し、ブローカーに見えないようにすることです。 あなたが本当に彼を「ブラインド」にしたいのであれば、彼があなたのストップロスレベル、テイクプロフィットレベル、ボリュームについて事前に何も知らないことを確認してください - ただこのトレーディングロボットを使用してください.
氏に感謝します。 このプロジェクトの開始とアイデアについては、Henryk Kardas 氏に感謝します。 MQL が提供する無料のデモでは、この EA の機能をテストできないことに注意してください。 実際のテストについては、実際のデモ バージョンをダウンロードしてください。
デモ版へのリンク https://www.mql5.com/en/market/product/94192
Blind Broker System は、注文管理の代替システムです。 ある意味、Meta Trader Terminal 内のシステムと同じです。
違いは、ブローカーのサーバーに書き込まれるのではなく、Blind Broker System を通じて
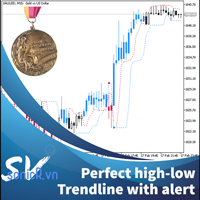
This indicator calculate trendline base on high, low of two period: fast and slow. From that, we have two line for fast signal and low signal. We tested many time on many assets, in most case, when fast signal crossup slow signal, price going up and vice verser. We also add alert function when two signal line crossed. For most effecient, user can change fast and slow period in setting. This indicator is good advice for price move. It better when combine with other trend indicator. For me, i us

Night Scalper is a professionally coded night scalper that trades during the quiet session one hour before and after rollover timing. It is designed to trade EURUSD ( M5 timeframe ), though it is not limited to this currency pair. It does not use dangerous strategies, such as grid or martingale strategies, so it is a safe Expert Advisor. It is recommended to use a tight spread broker, preferably an ECN broker with good liquidity. For a list of brokers that work well with this EA, please visit my

The TrendChangeZone indicator displays global and local price highs and lows on the chart. The indicator also shows the global trend on the chart and corrective waves. This indicator is designed to determine the direction and change the trend. Most importantly, the indicator shows trend continuation or reversal zones. An indispensable assistant in trading. The indicator does not redraw. The indicator can work on all trading instruments.
Important !!! Top trend if 2 (two) or more bl
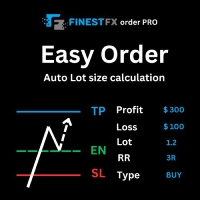
FinestFx order PRO is easy order execution and auto risk management tool developed by FinestFx official Programmer : Mohammed Rafi Just move SL,TP , Entry lines or Type SL,TP on entry columns . Lot are calculated automatically by fill out the loss cut amount. Work with all base currencies Fixed loss amount can be selected. Calculate risk rewards. Market order, limit order, and stop order are selected using buttons Supports FX, CFD, and crypto currency on MT5 Visit the owner website to see it

The Expert Advisor works as quickly as possible using a minimum of resources, which is very good when using a VPS.
Includes the latest grid algorithm implementation solutions: trend tracking separate automatic Breakeven for Sell and Buy series Active Hedging Algorithm during the trading process, sets Stop loss and Take profit for orders
The default parameter settings do not use martingale. Works on all Forex instruments. Recommended: Deposit from $300 (only USD) with leverage from 1:500 Best res

An oscillator that shows price changes and identifies areas of overbought and oversold. It can also show trend reversal points. WaveTrend Oscillator is a port of a famous TS /MT indicator. When the oscillator is above the overbought band (red lines) and crosses down the signal (solid line), it is usually a good SELL signal. Similarly, when the oscillator crosses above the signal when below the Oversold band (green lines), it is a good BUY signal. Good luck.

Flags and pennants can be categorized as continuation patterns. They usually represent only brief pauses in a dynamic market. They are typically seen right after a big, quick move. The market then usually takes off again in the same direction. Research has shown that these patterns are some of the most reliable continuation patterns. Bullish flags are characterized by lower tops and lower bottoms, with the pattern slanting against the trend. But unlike wedges, their trendlines run parallel.
MetaTraderマーケットは自動売買ロボットとテクニカル指標を販売するための最もいい場所です。
魅力的なデザインと説明を備えたMetaTraderプラットフォーム用アプリを開発するだけでいいのです。マーケットでプロダクトをパブリッシュして何百万ものMetaTraderユーザーに提供する方法をご覧ください。
取引の機会を逃しています。
- 無料取引アプリ
- 8千を超えるシグナルをコピー
- 金融ニュースで金融マーケットを探索
新規登録
ログイン