YouTubeにあるマーケットチュートリアルビデオをご覧ください
ロボットや指標を購入する
仮想ホスティングで
EAを実行
EAを実行
ロボットや指標を購入前にテストする
マーケットで収入を得る
販売のためにプロダクトをプレゼンテーションする方法
MetaTrader 5のためのエキスパートアドバイザーとインディケータ - 152

Multi Strat is an fully custimizable Expert Advisor. It opens a sell/buy trade when a 'trigger' signal is activated. Triggers are only activated if it meets the filter criteria. Once a trigger passes, a trade is opened with a maximum Take Profit (customizable) of a daily ATR percentage. That range is divided by the number of trades so the Take profit levels are divided among the trades (also customizable). The parameters should be self explanatory. In short, everything you would/could change is
T D Sequential indicator consist of two components. TD Setup is the first one and it is a prerequisite for the TD Countdown – the second component.
TD Setup TD Setup compares the current close with the corresponding close four bars earlier. There must be nine consecutive closes higher/lower than the close four bars earlier.
1- TD Buy Setup - Prerequisite is a bearish price flip, which indicates a switch from positive to negative momentum.
– Af

The indicator scans for TD Sequential signals in multiple timeframes for the all markets filtered and shows the results on Dashboard. Key Features Dashboard can be used for all markets It can scan for signals on MN1, W1, D1, H4, H1, M30, M15 ,M5, M1 timeframes Parameters UseMarketWatch: Set true to copy all symbols available in market watch MarketWatchCount : Set the number of symbols that you want to copy from the market watch list. CustomSymbols: Enter the custom symbols that you want to be a

The indicator scans for TD Combo signals in multiple timeframes for the all markets filtered and shows the results on Dashboard. Key Features Dashboard can be used for all markets It can scan for signals on MN1, W1, D1, H4, H1, M30, M15 ,M5, M1 timeframes Parameters UseMarketWatch: Set true to copy all symbols available in market watch MarketWatchCount : Set the number of symbols that you want to copy from the market watch list. CustomSymbols: Enter the custom symbols that you want to be availa
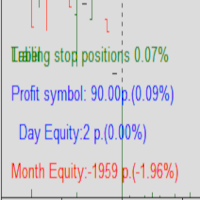
Protected profit это логическое продолжение проекта Equity monitor. Исправлены недочёты и внесены дополнительные моменты. В данном продукте разработан процентный Traling stop, как на отдельную позицию, так и на дневную прибыль в целом. Есть возможность закрыть позицию по заданному проценту убытка, а так же можно закрыть все позиции по проценту дневной прибыли. Настройки просты и понятны. Например: Риск на позицию 1% Позиция закроется если процент убытка превысит 1%. Traling 3% допустимое сниже

Crash 1000 Alert is an indicator that alerts trader when price is in the CRASH ZONE. The defaults settings work best only on Crash 1000 Index but are also fully customizable.
How to use: When price enters the crash zone, the indicator will send out messages of a potential crash. Traders can use this info to enter sell trades and capitalize on the spike down. Notifications and alerts are sent to your mobile device and platforms respectively. NB: please make sure notifications are enabled
DNA is an indicator that allows us to operate both in favor of a trend and a pullback. You can download the demo and test it yourself.
Trend trading is above zero and pullback trading is below zero.
The direction of the operation is marked by the color of the line.
If the line is green it corresponds to purchases.
If the line is red it corresponds to sales.
For example, if the green line is above zero and growing, we will have an uptrend operation. If the red line is above zero and

Micro ******************* Секундные графики MT5 ********************** Более точного инструмента для входа в сделку вы не найдёте. Входные параметры: Timeframe, sek - период построения графика, секунды Displayed bars - отображаемые бары Step of price levels, pp, 0-off - шаг отрисовки ценовых уровней, пункты Scale points per bar, 0-off - масштаб в пунктах на бар Show lines - отображение текущих уровней Show comment - отображение комментария Standard color scheme - стандартная цветовая сх
Matematiks
The expert Advisor is based on simple math. The expert Advisor puts 2 multidirectional orders further, wherever the price goes, it turns out that one order is always in the plus, the second in the minus. If we average it, then on the reverse price movement (only a few spreads), the averaged orders are closed and only the profitable one remains! It is thanks to his profit that the trade goes on. Of course, the averaging positions themselves also add profit to the piggy Bank at the e

The Jurgen Expert Advisor is part of a series of robots known for their minimalist style, emphasizing ease of use and system management. This robot belongs to the trend generation of robots, executing all types of orders based on specific rules. One distinctive feature of this application is its somewhat lower trading frequency. Therefore, I recommend creating an Expert Advisors Portfolio, utilizing this application simultaneously on different trading symbols and timeframes. This approach increa

Prices move for many reasons and these can vary from one operator to another: software, private and institutional traders simultaneously contribute to the formation of the price, making predictive art very difficult. However, there are measurable factors that bind the price to an underlying trend in line with the physical reality that the financial asset represents: these are the macroeconomic indicators. Large investors use this information wisely to set their strategies. Understanding these m
Pullback Probability It is an indicator that shows us the probability that the price will t urn around and we can operate that market turn.
The indicator marks a line that oscillates between a percentage of 0% to 100%.
The one indicated in the upper left corner shows us a help in which it informs us of the area in which the price is in real time, as well as the percentage that the candle is open. You can download the demo and test it yourself.
The indicator marks 6 work zones. 1) Above 80
The stocks that make up the index are one of the drivers of the movement. Analyzing the financial performance of all elements of the index, we can assume further development of the situation. The program (script) displays corporate reports of shares that are part of the index selected in the settings.
"Indexes" cannot be tested in the tester (since there is no way to get information from the Internet).
Information is downloaded from the site investing.com: Report Date Earnings per share

Are you tired of drawing Support & Resistance levels for all charts of the same Symbol while doing Multi-Timeframe analysis? Well, if you are Price Action trader then this indicator will solve your problem. Draw on 1 Timeframe and it will auto-sync with other charts of the same Symbol. You can draw rectangles, lines, arrows, and eclipse. It will give an alert when touched/break on line and arrow. It work's on all Timeframe.
Major Update
Added::
1}Triangle
2}Fibonacci Retracement
3}

MoMo Trade MT5 (MT4 version https://www.mql5.com/ru/market/product/57354 ) - trading system based on one of the momentum strategies. It uses simple and reliable tools like MACD and EMA to find entry points. The trading strategy looks for reversal patterns after trend area. The EA has implemented to work on M5 timeframe and focuses on short-term profit targets. But it also can be used on any timeframe. Volume calculation The volume amount is fixed ( Fixed volume ) or calculated based on risk pe

MOUNTAINS:It is an indicator that detects market consolidations prior to a movement.
The objective of this indicator is to indicate the areas before the market makes a move.
The areas that we are interested in detecting are the PLATEAU, which are between the slopes.
When the system detects a PLATEAU , the trader must place his operation in that area, waiting for the increase in volatility to reach its target.
The best option to carry out the operation of the PLATEAU is th

The EA opens trades based on Fractals indicator signals and uses smart averaging and position volume calculation.
Unlike most grid expert advisors, Double Grid Pro opens averaging positions only on signals. The Fractals indicator is considered the most effective in this case. The expert Advisor can be configured for an aggressive and conservative trading style. The key parameter in the strategy is the CorrectionValue parameter, it indicates the size of the correction at which we close the ent
Artemis is a currency-pair-EA which detects entry points by Moving Average - controlled by multiple trend-following-indicators. With Artemis you can trade every currency pair. Signals are generated when the price crosses the moving average and in parallel all three additional indicators confirm the trend direction. If only one indicator deviates from the trend direction, no position is opened. Basically, you can use Artemis on every time period. For best results it is recommended to use it on ti

Dies ist ein robuster EA, der Sicherheit und Effektivität vereint. Wenn er auf mehreren Symbolen installiert wird, unterstützen diese sich gegenseitig, sodass immer Stabilität angestrebt wird. Dabei wird ein Teil des Profits, der auf einem Chart entsteht, genutzt, um negativen DrawDown auf einem anderen Chart auszugleichen. Je mehr Charts zusammenarbeiten, desto stabiler wird das System.
Beschreibung der Eingaben: MagicNumber: Frei wählbar, zur eindeutigen Identifikation der Chart-Trades. J

In the current version this filter will only work with my night scalpers and the EA Profitection Filter or with other EAs that utilize the global variables set by this EA. An MT4 version is availalble here . Many scalpers these days have a "normal" news filter, which filters calendar news such as interest rate decisions or CPI releases. However, this breaking news filter is able to filter non-standard breaking news. It will check every minute for news and if it finds a news event, it will

Sniper Extended EA uses short-term trading - night scalping, not using martingale. Indicators used: ATR, RSI, Stochastic, CCI, WPR, DeMarker, RVI. Each indicator can be used optionally on/off.
The strategy of the adviser is based on an assessment of the strength of the trend and the finding of correction / reversal points; it compares the absolute values of the rise and fall of the market over a certain time period. Filters are used for news, delay, spread expansion, increased volati
QXSTREND Our "Support and Resistance" indicator shows the support and resistance levels using the ADX indicator, and create an arrow based on three ADX Periods on different levels.
Recommended TIMEFRAMES:- M15,M30 and H4 (For Long Term Target) 120 pips & Approximately M5 (For 30 Pips target) ENTRY SIGNALS:- You need to take trade based on Arrows if Green Arrow occurs then you need to buy if Magenta Down Arrow occurs then sell trade.
About QuantXsystem Products: – Simple installatio

You ask yourself the question every time you open your charts: how to win in trading? Will using a lot of indicators work? well know that I also asked myself the same questions when I first started trading. After testing many indicators, I realized that winning trading is simple and accurate trading. after several months of thinking and optimizing I was able to find my solution: Candle Good Setup Candle Good setup is a trend and entry timing indicator analyzing the market in multi-frame to give

THE SOUND OF MARKET is an indicator designed to detect the sound produced for the market movement. This system detects the background sound produced by market movements in real time to decide in your operation. In addition, by analyzing the sound recorded in the indicator, we can detect operational patterns. You can download the demo and test it yourself.
The indicator has a text help in the upper right corner, in which it shows whether the indicator has a bullish or bearish backgro

zap 43996914141 pelo valor de 50 + brinde
ProTrader B3 Mini é um utilitário para a plataforma de negociação MetaTrader 5
Foi programado especialmente para os ativos WIN (mini índice bovespa) e WDO (mini dólar)
O conceito do B3 Mini é ser simples, prático e intuitivo, um excelente assistente para scalpers/day traders!
Opere totalmente pelo teclado do seu PC, experimente, você vai gostar de usar! ( 'ω' )
Nota:
1 - Este utilitário não funciona no testador de estratégia
2 - Teste a ve
Yellow mouse neo Yellow mouse neo - fully automatic Expert Advisor designed to test the strategy of the Yellow mouse scalping Expert Advisor with advanced settings and additional filters. To purchase this version, you can contact in a personal. The standard RSI and ATR indicators are used to find entry points. Closing of transactions takes place according to the author's algorithm, which significantly improves the risk control and security of the deposit. Risky strategies like "martingal

DAILY STATS PANEL is a small panel that shows some statistic of opened chart. For example: Fibonacci resistance and support, daily average moving points and today's moving range, etc. After applied this expert advisor to chart, a small panel will be shown on the right. ** NOTE: This is not an algo trading expert advisor. **
Input parameters show_pivot - Whether or not to show pivot, resistance and support line on the chart. Pivot Color - R1-R4, Pivot and S1-S4 horizontal line colors.
Stati

The Crash BandiCoot works on the Crash 1000 and Crash 500 index which is available on the Binary.com or Deriv.com platforms. The EA uses the Awesome and Accelerator Oscillators to enter and exit trades on the 1minute (M1) time frame. The minimum lot size is 0.2 for Crash 1000 and Crash 500. The EA works best on a VPS. Minimum account size should be $200. How it works:
***************** 1. Entry : After a spike(only), the EA looks at the Awesome Oscillator and Accelerator Oscillator for a green

HAWA GOLD MT5 Advanced trading indicator with realistic pre-defined entry and exit levels with almost 80% win rate. The system focuses only Small and Steady Profits . It uses fixed stop loss for every signal to keep money management in place. As compare to other available indicators in market, HAWA gold has unique feature of displaying total profit and loss in terms of points where 1PIP=10points and Minimum profit is 10 pips. Its smart and advanced algorithm detects trend and trend strengt

商業経験はほとんどありませんか?
あなたがプロの再販業者であることを証明したいですか?
このコンサルタントはあなたにぴったりです! ブローカー Rannforex.com または IcMarkets.com を使用することをお 勧めします
この戦略の本質は、購入するダウンライン(青)から販売するアップライン(赤)までです。
比較的平らな楽器を選びます。たとえば、夜のEURGBP。 M1-M5タイムスロットを開きます。そして、チャート上でEAを開始します。
EAは最初にチャネルを確立します。また、ボタンと操作の自動構成に関する情報を含むパネルが表示されます。ロットサイズと取引時間が適切な場合は、取引チャネルを確認してください。チャネルが何らかの形で市場に適応し、一部のバーの上部がわずかに上部の線を壊し、バーの下部が下部の線を壊す場合、自動チャネルと自動スイッチボタンがアクティブになります。この種の取引には限定注文を使用するのが最善ですが、多くのブローカーでは、限定注文を価格に近づけることができないため、このようなブローカーの市場執行を維持しています。
チャネルを

This indicator will create bars in 4 deference colors. The Green Bar is Up Trend. The Red Bar is Down Trend. Lite Green Bar is No Trend (corrective or sideway) but still in Up Trend. Pink Bar is No Trend (corrective or sideway) but still in Down Trend. You can just looking at the Bar's Color and Trade in Green Bar for Long Position and Red Bar for Short Position. You can change all the colors in your way. 1. Alert function : Will popup Alert Windows and play sound when the Bar was changed.

Мониторинг https://www.mql5.com/ru/signals/892896 настройки комментарий 2 Цена робота формируется довольно просто: прибыль на сигнале равна цене советника (На Мой взгляд довольно честно)
Прибыль в прошлом не гарантирует прибыль в будующем!
Когда рынок перепродан или близок к перепроданности открываются позиции против тренда. Если рынок продолжает движение против нашей позиции открывается сетка. Рабочий тайм фрейм H1 M30 но также можно оптимизировать под любой ТФ. Управление рисками д
The San Andres Fault is an indicator designed to detect the movements that make the market tremble. This system detects a tremor and marks its intensity in real time to decide in your operation. In addition, the recording of the sismic signal allows us to interpret movement patterns that help us in decision making You can download the demo and test it yourself.
The indicator has a text help in the upper right corner, in which it shows whether the indicator has a bullish or bearish b
Robot autotrading forex yang bekerja secara full otomatis menggunakan Strategi Scalping yang sangat profitable.Tidak menggunakan metode strategi yang berbahaya dalam trading yang menyebabkan hilangnya seluruh Deposit secara tajam seperti Hedging, Martingale, Grid, Arbitrage, dll. Kelebihan RainScalper adalah memiliki status Live Development yang berkesinambungan dalam jangka panjang berbeda dengan robot lain yang sering berganti nama ketika terjadi crash/mc; serta memiliki kemampuan multi-strate

もしアクティブなトレーダーであり、市場の動きを効果的に解釈する方法を探しているなら、Weis Wave Boxを知ることはきっとお好きになるでしょう。この素晴らしいインジケーターは、明瞭で正確なボリュームの波とそれに対応するスウィングポイントのプロットを提供するために設計されています。5つのカスタマイズ可能なスウィング形状と他のユニークな機能を備えたWeis Wave Boxは、経験豊富なトレーダーや初心者にとって欠かせないツールとして際立っています。
Weis Wave Boxの注目すべき特徴の1つは、カスタムティックにおけるボリュームの波を作成できる能力です。これにより、取引の好みに合わせて適応し、戦略に精度と関連性をもたらすことができます。さらに、このインジケーターには調整可能な履歴制限があり、目的の時間帯に焦点を当てて特定のトレンドを分析することができます。
Weis Wave Boxの大きな利点の1つは、ティックボリュームと実際のボリュームに関する情報を提供できる点です。これら2つのボリュームの違いを理解することは、正確な市場分析にとって重要です。このインジケータ

Steel è un potente expert advisor dal codice stabile e pulito che apre un singolo trade per mercato impostando Take Profit e Stop Loss e sfrutta il Trailing Stop Loss per ottenere il migliore profitto. Può essere utilizzato e configurato su qualsiasi mercato in quanto il segnale di acquisto o vendita viene elaborato dalla sola lettura delle candele rendendolo immune da falsi e ritardatari segnali generati dagli indicatori. Si può impostare la lettura di una singola candela o di un gruppo, quand
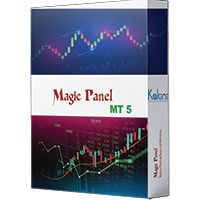
Magic Panel for MT5 is a Menu based Trading Panel. with the help of Magic Panel traders will be able to access various trading tools right from Menu Panel in MetaTrader Chart. All tools are one click to activate and another click to deactivate its that simple. Current version of Magic Panel comes with. - Trend Scanner. - Five in One Pivot Point. - Currency Strength Meter. - Multi Symbol Heat Map Scanner. - Auto Trend Line. - Symbol Search Box. - Symbols Dropdown Menu. - One click object Clear Bu

The background trend is an indicator that helps us to know the trend that is dragging the market. The indicator has 2 possibilities: 1) If the indicator is above zero the trend is buying and the indicator will be green.
2) If the indicator is below zero, the trend is selling and the indicator will be red.
You can download the demo and test it yourself.
The indicator has a text help in the upper right corner, in which it shows whether the indicator has a bullish or

Swing Point Volume, the indicator that signals weakness and strength at the tops and bottoms. This indicador can be for used the Wyckoff Method.
Information provided; - Swing on customized ticks. - Volume and points in each balance sheet. - Percentage of Displacement. - Sound alert option on top and bottom breaks. - Volume in ticks and Real Volume. - Volume HL (extreme) or (opening and closing) - Customized volume shapes.

Trend Indicator This indicator is about long buy and long sell using a simple visualization of trend. The green candle after a long sell period means a good moment to buy. A red candle after a long sequence of buyers means a good moment for sell. After all, you can use all time-frames on this indicator. * * If you prefer a better visualization, use long period on chart. Ex: 1H and 4H.

Hello
This EA for send any indicator Signals (buffer) to your channel in Telegram with photo for chart also you can share your signals with your clients in your telegram please watch the photos
you must have Telegram channel then make bot and give it Permission and get token (watch this video to know how do it) https://www.youtube.com/watch?v=x1bKWFOjSBE
and you must download this files https://drive.google.com/file/d/1pYpnWUr4Kb4aIwdoGVD_9zSH1HWX-tt3/view?usp=sharing then unzip files the

If you are looking for a EA can Auto Trading and not send Signals to yours Telegram Chanel . DON'T MISS IT!
The Expert Advisor works on a linear regression channel. The Expert Advisor trades from the channel borders, stop-loss and 2 take-profit levels with partial closing of orders are used for closing. The chart displays information about profit and draws the regression channel itself. The channel values are recalculated only when a new bar is formed.
Min deposit: 200$
Reco

The 4 headed dragon is an indicator that has two functions. 1) Set the background trend. 2) Mark the predominant trend. By combining these two indicator signals, we will be able to trade for or against the trend, adapting the signals to your reading of the market.
You can download the demo and test it yourself.
1) Set the background trend.
Define four possibilities of trend that are the four heads of the dragon, marked by colors on the indicator, marking a) Powerful buying trend. b)
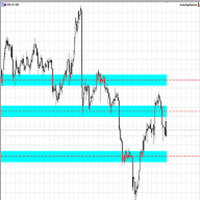
Making Charting simple!
The Support/Resistance EA combines a sophisticated neural network algorithm with an Average Range computation to make your supply and demand zones easy to spot! The EA is very easy to use and can save you valuable time when charting through financial instruments. Areas of consolidation are highlighted according to your preference and timeframe, making it easier to identify areas of break-out or small regions to scalp. Features :
Choose two Timeframes (From 1 Minute

Multicurrency and multitimeframe indicator of the Standard Deviation Channel. Displays the current direction of the market. On the panel, you can see breakouts and touches (by price) of the levels of the linear regression channel. In the parameters, you can specify any desired currencies and timeframes. Also, the indicator can send notifications when levels are touched. By clicking on a cell, this symbol and period will be opened. This is MTF Scanner. The key to hide the dashboard from the char

If you are looking for a Best Grid EA. DON'T MISS IT!
The King EA combine 2 Strategy, which strategy in all top Grid EA Include in The King EA . With only 1 EA, you can change setting to use many Strategy you want to get good result. Recommend ECN broker with LOW SPREAD: IC Market , Exness, NordFX , FXPRIMUS , Alpari , FXTM
Strategy 1: A professional Grid advisor works according to RSI ( Relative Strength Index ) indicators. A nd has the function of Reducing the Drawdown

MoneyMachine MT5 Expert Advisor is a fully automated forex trading robot designed using our ten unique trading strategies that we have developed over the years. In addition, you get a Metatrader 5 Expert Advisor builder featuring many technical indicators. We assign each of these strategies weights to determine how much they contribute to each trade. The combination of these successful strategies ensures maximum efficiency. Each strategy loops through different settings for signal confirmation.

Walking Steps EA is a scalping Expert Advisor designed to work in a volatile market. It is suitable for working with any brokers, including American brokers, requiring FIFO to close primarily previously opened transactions. All orders are accompanied by a virtual stop loss and take profit in pips, and there are also breakeven and trailing stop functions. The chart displays information on the speed of order execution and slippage. Advisor does not use martingale or grid. The EA does not

Night Vision Scalper EA is a scalping system for working in a calm market at night. Does not use martingale or grid. Suitable for all brokers, including American brokers with FIFO rules. All orders are accompanied by a virtual stop loss and take profit in pips, the values can be either fixed or dynamic. It also has a virtual trailing stop and breakeven. The chart displays information on the speed of order execution and slippage.
Min deposit: 100$
Recommend ECN broker with LOW
DNA is an indicator that allows us to operate both in favor of a trend and a pullback.
You can download the demo and test it yourself.
Trend trading is above zero and pullback trading is below zero.
The direction of the operation is marked by the color of the line.
If the line is green it corresponds to purchases.
If the line is red it corresponds to sales.
For example, if the green line is above zero and growing, we will have an uptrend operation. If the red line is above zero and

EA GAP Strategy MT4 - Expert Advisor for trading on gaps. This strategy is very popular in the FOREX market - when a gap arises on the chart, then most often the price then closes it. Advisor rarely trades, mainly at the opening of a new week on Monday, so testing should be carried out over a large period of time. The most volatile pairs are suitable for work: GBPUSD, USDCAD, EURUSD, USDJPY, USDCHF, AUDUSD, NZDUSD. Min deposit: 100$
Recommend ECN broker with LOW SPREAD: IC

Genetic Code , is an indicator that differentiates two types of market: the market in range and the market with volatility.
This indicator allows the trader to choose whether to use a range trade or a volatility trade. You can download the demo and test it yourself.
When observing the trace of the indicator it shows us narrow areas that correspond to market ranges.
These ranges always end with a volatility process, so you can work with two conditional pending orders.
When th

It transforms imprecise and crooked lines INTO perfectly STRAIGHT and HORIZONTAL Lines!
DO NOT WASTE your TIME anymore trying to draw perfectly straight lines!
This useful tool straightens crooked lines and saves you from the nervousness!
You can also switch, with a button, between Normal Trendlines and STRAIGHT Horizontal lines! Enjoy it and have a nice trading!

O Pokas Speed aplicado ao mini índice no período gráfico de 5 minutos é um EA (Expert Advisor) que possui 3 opções de estratégias visando auferir bons resultados a favor de tendência abruptas . Os modos de negociação são adaptativos de acordo com o perfil do investidor conservador , intermediário ou agressivo . Esse EA não trabalha especificamente com uma tendência de mercado, ou seja, ele pode realizar operações tanto em tendências quanto em consolidações, sendo ideal para quem busca operações

Ichimoku KumoTwist M_M
Description in English and Italian =
This Indicator is based on one of the Strategies with Ichimoku Indicator, in particular the KUMO TWIST! The Kumo Twist is the cross of the Senkou Span A with the Senkou Span B; The Senkou Span A and the Senkou Span B are the two lines that create the Cloud in the Ichimoku Indicator; it will give you of Buy and Sell when they Cross, with Arrows and Alerts.
When you attach the indicator on the chart , a window will open where
Boleta de negociação, para aglizar operação manual no Metatrader 5 no mercado de futuros.
Principais Funções :
Utilização de teclas de atalho para pre-visualizar ordens pendentes; Botões para operações a mercado; Botões para ordens atrás do preço, as quais ajustam o ponto de entrada, esperando o preço voltar uma quantidade de pontos definida no campo "Dist. Atras" para abrir a posição; Botões para zerar posições e para cancelar as ordens pendentes; Botão para colocar uma ordem

Buy and sell signals based on the Day Trade Trap Strategy for failed breakouts, popularized in Brazil by Alexandre Wolwacz (STORMER).
How does the indicator work? The indicator activates the buy and sell signal when their respective conditions are met. For a buy signal, we need a bar making a low lower than the previous day low. On this moment, the signal is plotted with the secondary color. For a sell signal, we need a bar making a high higher than the previous day high. On this moment, the

Audible order flow, we can set a different tone for up to 12 buy order sizes and 12 other sizes for sell orders.
Up to 84 musical notes are available, ie 7 octaves. The default settings have been tested in the Forex (EURUSD, GBPUSD, XAUUSD, USDJPY, USDCHF and USDMXN) and Brazilian futures (WDOFUT, DOLFUT, WINFUT and INDFUT).
This tool was inspired by an interview with a visually impaired trader, as there are no tools for this type of trader and I decided to make it available for free, so

Why should I choose this EA over others?
Fiber Trail Blazer does fit your needs , if: - you’re tired of fighting the market each day just to cover the spread and your broker’s commissions, - you’re looking for a robust EA tested under many different conditions - you believe that Biden will actually be the next president of US, pushing Trump’s tweets into the past (his tweet storm was the only unfavorable market conditions for the EA discovered dur
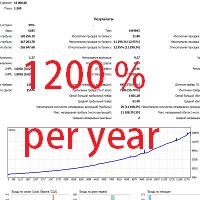
3つの通貨ペアのための複数通貨expert Advisor。 設定で設定された異なるペアを使用することができます。 新しい通貨を追加するときにマジックナンバーを変更するだけです。 その後、収量はさらに高くなります。 ロット注文とクロージング注文は、口座の無料資金から計算されます。 したがって、他のexpert advisorsと同時に使用することができます。
Expert Advisorは複数のマジックナンバーを一度に使用し、注文はそれらを使用して閉じられます。
借入の増加な心が強いボラティリティの危機にある。 しかし、短期間でうまく対処します。 収量はさらに高くなります。 ロット注文とクロージング注文は、口座の無料資金から計算されます。 したがって、他のexpert advisorsと同時に使用することができます。

The world of fractals is an ea that uses the power of fractals to detect market turns in the system's recovery algorithm.
This system detects a point to operate if that point is not correct, it uses the fractals to close the cycle with profits.
For this algorithm to be effective, it has filters that improve the efficiency of the system. You can download the demo and test it yourself. Very stable growth curve as result of smart averaging techniques.
"Safety first" approach in development. S

The RealCryptoLevels indicator by downloading the order book of crypt exchanges with maximum depth shows horizontal volumes of popular crypto currencies on the chart, so you can see not only the volumes, but also the levels and them strength (see screenshots), which is very important for successful trading in all strategies from scalping to medium-term trading, because you can see the preferences of buyers and sellers at the moment and their mood for the future. The indicator pulls volume data
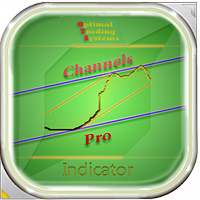
This indicator determines the channels along which prices move on the trading history. There are many trading strategies that rely on channel trading on a channel breakout. This indicator can draw price channels by reading information from several timeframes at once (from the current, from the second and third). You can customize the color and thickness of the lines for each timeframe. Also, you can set a different distance between highs and lows to draw channels or lines. There is also a simple

Las Bandas de Bollinger se encuentran entre los indicadores más utilizados en el análisis técnico, su autor es el estadounidense John Bollinger, analista financiero y gran colaborador en el área. John comenzó a desarrollar esta técnica en la década de 1980 y en 2001 publicó su libro Bollinger on Bollinger Bands.
Las bandas de Bollinger son muy útiles para indicar niveles de precios en los que una acción puede haberse apreciado o devaluado demasiado, además de indicar signos de máximos y fon

The Keltner Channels are powerful tools of technical analysis made specifically to take advantage of the opportunities created by price volatility. The indicator was originally developed by the American Chester W. Keltner, in the 1960s, and is widely used, especially in the American market.
However, despite the high usability in the market, the Keltner Channel suffers from a problem of having only 2 channels, which makes it very difficult to know the right time to enter or leave a position. S

BTFXピボットポイントは、毎日のサポートレベルとレジスタンスレベルを計算するインジケーターです。 この指標を使用することにより、ピボットレベルは目標とする明確な目標を示します。 抵抗レベルは、銀色のピボット線の上に紫色で表示されます。 サポートレベルはオレンジ色で表示され、銀色のピボットラインの下にあります。 このインジケーターは、BTFX夜明けインジケーターと一緒に使用すると非常にうまく機能します。 これらの指標の詳細については、添付のYouTubeビデオをご覧ください。 その他のお問い合わせは、メールまたはお電話にてお問い合わせください。 support@besttradesfx.co.uk 01827 842 418
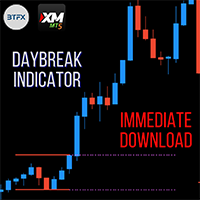
Best Trades Fxによって作成された夜明けインジケーターは、ロンドン市場のオープン中にブレイクアウトに気付くようにゾーンをマークします。 ゾーンは標準でGMT + 2に設定されています。これをプラットフォームで有効にするには、ブローカーサーバーに応じて、午前12時GMTと一致する開始時間と午前7時GMTと一致する終了時間を選択する必要があります。 このインジケーターは、すべてのシンボルで使用できます。 このインジケーターの詳細については、Youtubeのビデオをご覧ください。 これとBTFXピボットポイントインジケーターは完璧に機能します。 サポートゾーンとレジスタンスゾーンがチャートに自動的にプロットされるため、分析を行う必要がないためです。 指標に関するご質問は、メールまたは電話でお問い合わせください。 support@besttradesfx.co.uk 01827 842 418 www.besttradesfx.co.uk

Provide ideas for trend trading.
Automatic calculation and generation of trend channels.
The channel line, also known as the pipeline line, is to draw a straight line parallel to the trend line in the opposite direction of the trend line, and the straight line crosses the highest or lowest price of the recent period. These two lines run the price in the middle and have obvious pipe or channel shapes. Necessary for traders: tools and indicators Waves automatically calculate indicators, chann
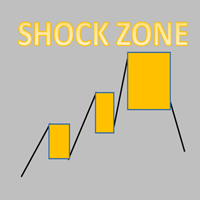
Every trading shock range is a point of gaining momentum!
The stop loss is generally the height of the shock zone.
Take profit depends on personal preference and market position. Generally at least double the height of the shock zone. Being in a good market position, it can have a profit-loss ratio of 5-10
Necessary for traders: tools and indicators Waves automatically calculate indicators, channel trend trading Perfect trend-wave automatic calculation channel calculation , MT4 Perfect

In the battle of Kursk every time a Russian tank fell, another appeared to take its place. This system is replenishing the tickets one after another until the market battle is beaten. The system distributes its trade in the key points of the market, in those places where the market gets stuck and it is easier to start the counterattack. So the system first chooses the battle site. Once started, it places as many troops in the rear as necessary to beat the market. No matter how hard the battle is
MetaTraderマーケットが取引戦略とテクニカル指標を販売するための最適な場所である理由をご存じですか?宣伝もソフトウェア保護も必要なく、支払いのトラブルもないことです。これらはすべて、MetaTraderマーケットで提供されます。
取引の機会を逃しています。
- 無料取引アプリ
- 8千を超えるシグナルをコピー
- 金融ニュースで金融マーケットを探索
新規登録
ログイン