Смотри обучающее видео по маркету на YouTube
Как купить торгового робота или индикатор
Запусти робота на
виртуальном хостинге
виртуальном хостинге
Протестируй индикатор/робота перед покупкой
Хочешь зарабатывать в Маркете?
Как подать продукт, чтобы его покупали
Торговые роботы и индикаторы для MetaTrader 5 - 155

Ни один EA не может гарантировать нашу вечную стабильную прибыль, но она является демонстрацией идеи сделки. Качество и качество возвращаемых данных является интуитивно понятным подтверждением EA. Если результат обратного визирования EA окажется неудачным, мы не поверим, что он сможет заработать нам деньги на фирменном бланке. И наоборот, EA, родившая красивую кривую активов в процессе обратной съемки, заслуживает нашей уверенности в том, что она способна выполнять задачи обновления.
GOLD ONE
HEDGING ACCOUNTS ONLY!!! Double Trouble RSI uses 2 Moving averages to define trend then opens trades based on RSI over bought or over sold conditions. It also has a time filter to define trading times. Default settings are for 5 minute timeframe. This EA is highly configurable and can be optimized to be used on most instruments and currencies, including DAX and S&P 500
The money management section is also highly configurable and does not make use of any risky strategies like martingale etc..

MANUAL OF RECOVERY GRIP
The recovery grip system can recover both an isolated loss and a loss produced by a grip or multiple orders, the algorithm gradually compensates the losses until the equity returns to zero.
The time it takes for the algorithm to reverse the loss is proportional to the volatility of the pair and the size of the loss.This system allows you to test the algorithm prior to purchase.For this, it has a powerful simulation system in which you can choose whether your loss i
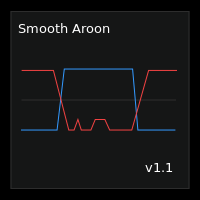
Smooth Aroon is a version of the Aroon Up and Down with smoothing and filtering.
Features :
Smoothing : You have smoothing from 0 to 99 . To smooth a signal, find the maximum value of the points in question then set the smoothing level above the maximum value. For example : If you want to smooth all signals below 30, then you should set the smoothing level above 30 This also smooths all signals above 70, since the Aroon Up and Down Oscillates between 0 and 100. Filtering : If you only

Секвента Демарка (Sequential) - индикатор, демонстрирующий развитие тренда, его структуру. Довольно точно отображает начальную и конечную точки, важные точки перелома. Срабатывает по открытию свечи, поэтому перерисовок не будет никогда.
Здесь нет сложных формул, только статистика, отсчёт свечей, выбранных по определённым критериям. При этом индикатор может давать очень точные сигналы для входа, особенно при поддержке какого-нибудь индикатора уровней, например, этого . Алгоритм нахождения сигнал

Индикатор Fixed Trend ищет и отображает на графике цены точки разворота. Индикаторы тренда являются одним из основных инструментов анализа тенденций на валютном рынке Форекс.
Целью, которая преследовалась при его создании, является получение сигналов которые будут давать меньше шума и быстрее реагировать на изменение цены. Индикатор Fixed Trend является трендовым индикатором, который используется для поиска разворотов при пробое его границ.
Трендовые индикаторы позволяют эффективно опре

You know you are not a shark but maybe you can be a remora fish. You just have to locate a shark and feed on the remains. This system uses an indicator that detects the movements of the shark and positions itself in favor of it, taking advantage of its capture.
This system analyzes the market looking for the waves that the shark produces in the forex sea when it attacks the market. Once the shark attack is located, it enters the market to catch a piece of the catch. All operations have thei
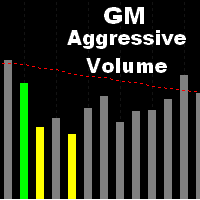
Объем - это ресурс, используемый аналитиками с различными методологиями именно потому, что он показывает подтверждение движений и прогресса рынка. Это индикатор, который анализирует финансовое количество, которое было продано в течение определенного периода.
Этот индикатор анализирует объем для каждой свечи, при чрезмерном увеличении он отличается от других цветной полосой.
Помимо информирования в виде цветных полос, этот индикатор позволяет выдавать звуковое предупреждение при возникновени

This EA is a unique approach to Gold day/swing trading. The objective of the strategy is to: Identify ideal and repeatable trade entries with high level of certainty Create a day trading strategy which doesn’t require a hard SL and TP Use alternate risk management mechanism instead Visualize and auto manage trades based on S/R A trade management solution that can be applied to any trading pair
Please also install the free custom indicator: FibonacciVPT https://www.mql5.com/en/market/product

Hello You can copy orders between terminals for any computer via Internet (MT4 to MT4) or (MT4 to MT5) or (MT5 to MT4) or (MT5 to MT5)
it's fast Open orders Modification Stop Loss and Take Profit Close Orders This is EA (slave) put it in Experts folder you must buy (Copy orders for any computer via Internet Master) EA too from this link if you want to copy from MT4
https://www.mql5.com/en/market/product/55096 if you want to copy from MT5
https://www.mql5.com/en/market/product/56397

Индикатор Inno Trend отслеживает рыночный тренд с приемлимой надежностью, игнорируя резкие колебания рынка и шумы вокруг средней цены. Индикатор Inno Trend упрощает процесс принятия решений, распознавая развороты с помощью встроенного алгоритма, а затем подтверждает сигналы на уровнях поддержки/сопротивления, реализует разновидность технического анализа, основанную на идее о том, что рынок имеет циклическую природу. Можно использовать как для пипсовки на мелких периодах, так и для долгосрочной

MOST IMPORTANT INFORMATION
<1>
Exactly this program was used to set World Record in Trading 2020
Account Equity was increased from $1,000,000 to $100,000,000 in 16 days
Details => www.mql5.com/en/users/AIS
<2>
In the last days of this record the position was creating by 1000-2000 orders
It was used the computer with 1 core Pentium 4 CPU at 2.8 GHz and 1 GB memory
In the last two days the daily profit was $40,000,000 every day
<3>
It was 100% manual trading
And this special program w

Hello You can copy orders between terminals for any computer via Internet (MT4 to MT4) or (MT4 to MT5) or (MT5 to MT4) or (MT5 to MT5) it's fast Open orders Modification Stop Loss and Take Profit Close Orders This is EA (Master) put it in Experts folder you must buy (Copy orders for any computer via Internet Slave) EA too from this link if you want to copy to MT4
https://www.mql5.com/en/market/product/55097 if you want to copy to MT5
https://www.mql5.com/en/market/product/56414
Pleas

This plots Fibonacci deviation levels above and below a moving average of the price. Companion indicator to the " Golden Bull Wave Trader " expert advisor which uses volume\price trend to determine price reversals. https://www.mql5.com/en/market/product/56291 The expert advisor and this indicator were created in order to: Identify ideal and repeatable trade entries with high level of certainty Create a day trading strategy which doesn’t require a hard SL and TP Use alternate risk management me

Hello This EA (expert advisor) will open orders from Telegram "Auto Open orders from Telegram" (Telegram to MT5). Please watch our video for more details: https://www.youtube.com/watch?v=p06o1xgsD5c
download instructions from here https://drive.google.com/file/d/1rwZnvgaWoi3gSkEwsi7s5jeatjJLGTWc/view?usp=sharing
Good luck -------------------------------------------------------------- السلام عليكم هذا الاكسبيرت سيفتح صفقات آلية وفورية من تليجرام (Telegram إلى MT5) يرجى مشاهدة الفيديو لمزيد من
This utility sends notification to trader’s MT5 (for MT4 version, checkout this link ) mobile app, to remind traders about their open positions. Super useful for part time traders to keep track and not forget any positions. To turn on notification, please visit this link (https://www.metatrader4.com/en/trading-platform/help/setup/settings_notifications)
Features Keep track on open orders (pending orders, running orders) Customize time to send notification Customize notification interval (s

VWAP - это внутридневной расчет, используемый в основном алгоритмами и институциональными трейдерами для оценки того, где торгуется акция, относительно ее средневзвешенного объема за день. Дневные трейдеры также используют VWAP для оценки направления рынка и фильтрации торговых сигналов. Этот индикатор используется для анализа и расчета Vwap от определенной точки на графике, что широко используется для анализа начала движения цены, взаимосвязи с объемом.
- Множественные Vwaps на одном графике

Ema Pro v1.17 is a newly developed robot featuring a classic crossover strategy using two MA indicators. What sets it apart is the integration of a data miner. Additionally, the system supports various order types and enables flexible trading. Exit rules, such as take profit, stop loss, trailing, and break-even, are determined based on independent ATR indicators. The default configuration targets EURUSD in the H1 time frame, though the robot can also be applied to XAUUSD in the same time frame.
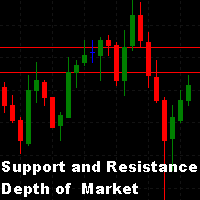
Мы часто ищем на графике точки поддержки и сопротивления. Один из методов, который можно использовать, - это количество лотов, предлагаемых в книге заказов. Этот индикатор ищет самые большие лоты в книге заказов и рисует их на графике в виде линий, тем самым определяя наибольшую концентрацию лотов, предлагаемых на централизованном фондовом рынке в то время, таким образом настраивая возможные линии поддержки и сопротивления.
- Количество линий для рисования может быть определено пользователем;
Multiple Exponential Moving Averages from two different timeframes have been used in making this fully automatic trading robot. The backtest screenshots speak the rest. The amount to be invested has to be put manually in input tab. So works on all account sizes. For best results - Timeframe = 15M - Leverage = 100 - Preferred pair = EURUSD but gave profit on other pairs too. - Avoid trading between last week of December and first week of January.

Introductory offer.
The EA has been built around the London Stock Exchange open and the currency pair GBP/JPY. It is based on taking entries during the first hour of the London Stock Exchange open due to the volume in this period. The EA will take a maximum of one trade per day; it will not take multiple trades. The EA also has the option to use the MACD for exit management instead of a fixed take profit. The use of the MACD for exit management is to maximise trade exits at potential reversa

Советник предназначен для работы на Hedge счетах. Основная задача данного советника - выход из просадки, возникшей. например, при использовании рискованных стратегий. Советник может работать с использованием полного локирования или без него. Данный советник не открывает сделки сам, кроме локирующей позиции. Он использует прибыль других советников для закрытия убыточных ордеров, накапливая в специальном буфере результаты закрытых профитных сделок. Другие советники могут быть запущены на любом ин

Этот мультивалютный эксперт использует 28 валютных пар. Прогнозы основаны на двух индикаторах: Bollinger Bands и DEMA. Настройки для MultiBolbands Советник работает с программой MultiBolbandsTrainer, написанной мной для быстроты оптимизации советника, которую можно скачать тут же Настройки по умолчанию предназначены для валютной пары EURUSD H1 Algorithm1. Оптимизация с 2016 года Перед тестированием в тестере стратегий или установки эксперте на график если хотите ускорить процесс тестирования ус

Trader's Panel is a simple EA for managing trades once open. Your options for managing open trades are to close an entire open trade, close a percent of an open trade, which can be input from the trader panel, and then set stop loss to break even on an open trade. The Trader's Panel hovers at top left of screen right below the one click order buttons. **Note that this EA does not open trades. It only manages trades once they are open.
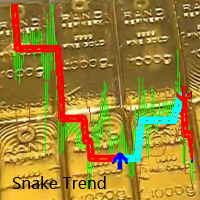
Содержание индекса: 1. Контрольная цена, относится к контрольной цене. В краткосрочной перспективе цена колеблется непрерывно и беспорядочно, и краткосрочная судьба будет казаться непредсказуемой. 2. Справочное направление тренда
Предлагать: Ослабьте краткосрочные колебания линии K и следуйте средне- и долгосрочному тренду.
"Расти вместе!" «Кооператив QQ: 556024» "Сотрудничество WeChat: 556024" «Совместная электронная почта: 556024@qq.com»
"Тенденция формируется или умирает, и

Mr Martin MT5 EA Mr.Martin MT5 - полностью автоматический советник, который предназначен для спокойной, инвестиционной торговли на длительном промежутке времени. Советник использует в своей стратегии принципы усреднения убыточных позиций, но за счёт уникальной системы входов, нескольких фильтров,а также системе защиты депозита, выраженной параметром SL_percent_balans , является полностью безопасным для вашего депозита.
Настройки "по умолчанию" предназначены для работы на EURUSD M1 G

Protect your EA from unauthorized use. With EA Locker you can generate individual licenses for your EA to your customers.
Product blog page Download MT4 version from here
Protection consists of three parts: 1. Your Unique EA identifier 2. User Identifier 3. Expiration date
Description of parts: 1. EA ID is your internal EA identifier. Itcan be the short name of the EA. (MyGridEA, TradeCopierEA...) 2. User identifier can be anything user specific data (Mt4 account number, Account number + U

ISS Station MT5 it is a Secure Automated Software for trade Forex market and indices.
The architecture is a Fully Automatic Autonomous Robot Expert capable of
independently analyzing the market and making trading decisions
ISS Station MT5 Have neurals nets to used the correct algoritm in the correct market situation
ISS Station MT5 It is an advanced trading system. This is a fully automatic Expert Advisor.
ISS Station MT5 is a plug and play system ISS

FIRST 10 COPIES AT 30 USD, NEXT PRICE WOULD BE 50 USD
HAWA MOMENTUM & TREND PRO (MT5) Advanced trading indicator with proper pre-defined entry and exit levels with almost 80% win rate. Its smart and advanced algorithm detects trend and trend strength using momentum for maximum profits and send signals after filtering out market noise. SETTINGS: Please make sure all inputs are NOT "false" in indicator properties otherwise it will not display identified trades. Directory Location: Download f

This robot is not such a martingale and is designed based on a special and unique strategy which is beneficial for traders who are looking for quick profitable trading processes, that is why it works in 5 minutes timeframe as well as theCurrency pair of EUR/USD. Instructions for EXPERT settings FastM5: Adjust/select 0.1 for any any 1000 USD, “refer to the photos attached” It means you need to trade 1 Lat per 10000 USD.
Реинкарнация.
Из-за шести правил, а цикл бесконечен.
Вступление:
1. Это вид торговли по тренду: свинг-трейдинг, трендовый трейдинг.
2. Для каждого ордера будет установлен соответствующий стоп-лосс и соответствующий тейк-профит.
3. Способ вывода и входа в рынок, прогнозирование и расчет точки.
4. Процент выигрыша низкий, около 20%, но соотношение прибыли к убытку около 10: 1.
5. Сложный рост процентов.
За и против:
В торговле по тренду выгодно входить в рынок, но из-за высокого

Общие сведения
Советник позволяет получать уведомления на мобильный телефон (или планшетный компьютер), по электронной почте или в виде звукового сигнала о таких событиях, как открытие и закрытие торговой позиции (а также, всех позиций), установка и удаление отложенного ордера, изменение таких параметров, как цена, Stop Loss или Take Profit, достижение указанного в настройках уровня балансом счета, уровнем залога, просадкой, собственными или свободными средствами. Вы можете указать интервал, с


Эксперт помогает в ручной торговле или закрывает позиции другого эксперта, он создан для автоматического закрытия позиции или группы позиций при достижении общего положительного баланса. Самостоятельно он сделок не открывает. Умеет закрывать позиции на одном символе, на всём счету или по указанному магическому числу. Можно указывать в настройках общий Тейк и общий СтопЛосс для группы позиций для закрытия. Если у Вас есть вопросы, замечания или предложения пишите мне в группу https://www.mql5.com
Thesoo 89 is a multi-functional Expert Advisor working with Triangular or Single Pair systems, including Scalper Martingale Anti-Martingale MultiCurrency / SingleCurrency Default parameter for Multi Currency (setfile T88-1), works with Anti-Martingale using the multiplier constant This EA can manage transactions made manually from all platforms including from a mobile phone Time Frame: Works on all Timeframes, preferably M1 or M5
Pairs: Default Paramaters for Multi Currency Triangular, works

Советник предназначен для разруливания сложных ситуаций, в том числе лока. Помимо этого советник может и сам успешно торговать. Для этого в нем предусмотрены функции автоторговли. Параметры: BUY – разрешить разруливать продажи
SELL – разрешить разруливать покупки
Step = 60; – шаг между усредняющими позициями
ProfitClose – прибыль закрытия в валюте
Lot = 0.01; – первый лот усреднения
K_Lot = 1.5; – коэффициент усреднения
Max_Lot = 10.0; – максимально возможный объем
StartLot

Написал для себя хорошего эксперта для прибыльной торговли, который и вам может помочь приумножить депозит. Он может отслеживать все или отобранные торговые инструменты вашего брокера на предмет резких скачков цены. Лучше всего для отслеживания и торговли подходят акции, как более трендовые инструменты в отличие от Форекса, и более предсказуемы в своём движении, особенно на сильных позитивных или негативных новостях. Например акции Tesla после объявления сплита выросли на 60 процентов за две нед

Triple Threat is the latest offering from Algotrading_za It uses Bollinger Bands and RSI to determine entry positions with MACD as confirmation of trend. It also has a time filter to define trading times. This EA is highly configurable and can be optimized to be used on most currencies.
The money management section is also highly configurable and does not make use of any risky strategies like martingale etc..

This Currency Meter Calculates Strength Using a currency basket of 28 pairs? This Currency Meter uses a basket of 28 currency pair to define strength. This is very important because it gives an wholesome view of the strength of a currency by considering its reaction to all major currencies paired with it.
This Currency Meter is Multi-timeframe!!! Majority of the currency strength indicators around the market today only has a single time frame view. Even with the so called multi-timeframe versi

Отличная панель для аналитики рынка. Панель помогает анализировать значения индикатора TRIX (Triple Exponential Moving Average) и его сигналы.
С помощью данной панели вы сможете: смотреть текущий сигнал с TRIX по всем таймфреймам; смотреть текущий сигнал с TRIX по разным символам; смотреть текущее значение TRIX ; несколько типов сигналов для аналитики.
Значения в ячейке таблицы: Значение индикатора
Тип сигнала: TRIX пересекает уровень 0 TRIX выше/ниже цены уровня 0
Вариант работ

EnkiSoft Trade Clone EA
User description in MQL5 blog New version 1.57 Read updates MT4 version download here
With Trade Clone EA you can trade on multiple MetaTrader 4 and MetaTrader 5 accounts simultaneously, clone the trades of any trading robot from server account to your friends and family accounts. Note: All MetaTrader 4 and MetaTrader 5 must run in same computer, or you need copy the trade file to the Client computer. You can run multiple Trade Clone EA as server, and

EnkiSoft Trade Clone EA new!
User description in MQL5 blog
You can use it on unlimilted clients for unlimited time! MT4 version download here
With Trade Clone EA you can trade on multiple MetaTrader 4 and MetaTrader 5 accounts simultaneously, clone the trades of any trading robot from server account to your friends and family accounts. Note: All MetaTrader 4 and MetaTrader 5 must run in same computer, or you need copy the trade file to the Client computer. You can run multip
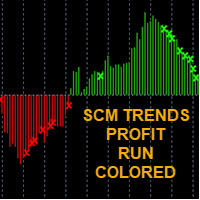
-EASY TO FOLLOW TRENDS -RED SELL / GREEN BUY -CROSS SIGNAL IS MEAN "TRENS WARNING" TO EXIT ORDER (WEAK TRENDS)
-WITH AUDIBLE ALERT ON/OFF
SCM indicator with different colors at levels 0, 100 and -100. The cross is a signal for " Exit" This exit signal is effective especially in short-term breakout trades, because it prevents early exiting at small corrections.
*****TIP EURUSD/BTC TF 10 min is work very Well****
****** GOLD TF15min is work very Well***** (after TF 15min show exit buy an

️ SOBRE A ESTRATÉGIA
O robô DayLong foi programado a partir da estratégia desenvolvida pelo engenheiro Vinicius Reis após anos de trading, centenas de alunos formados e milhares de horas operando.
Eles utilizam em sua fórmula alguns indicadores e osciladores parametrizados de maneira a prever os pontos explosivos de início de tendência do índice futuro brasileiro.
Com seus parâmetros otimizados pelo histórico de movimentação do ativo, foram configurados para entrar em trad

This strategy was learned from Stormer to be used on B3.
Basically, 15 minutes before closing the market, it will check RSI and decided if it will open an position.
This strategy do not define a stop loss. If the take profit reach the entry price it will close at market the position. The same happens if the maximal number of days is reached.
It is created to brazilian people, so all configuration are in portuguese. Sorry
Activations allowed have been set to 50.

Mir Station MT5 it is a Secure Automated Software for trade Forex market and indices.
The architecture is a Fully Automatic Autonomous Robot Expert capable of
independently analyzing the market and making trading decisions Mir Station MT5 Have neurals nets to used the correct algoritm in the correct market situation
Mir Station MT5 It is an advanced trading system. This is a fully automatic Expert Advisor.
Mir Station MT5 is a plug and play system Mir

Данный индикатор предназначен для мониторинга торговой активности вашего счета. Особенно полезен будет тем, кто торгует сразу на нескольких инструментах. В одном окне индикатора собрана наиболее важная информация о счете с детализацией по инструментам и мониторингом заработка. Описание настроек: Start from date history - с какой даты индикатор будет обрабатывать торговую историю Max symbol on screen - индикатор берет данные по символам из обзора рынка. В данной настройке вы можете ограничить

Индикатор Analytic Trade - это полноценная торговая система. Он состоит из 4 частей: Первая - это стрелочки, показывающие наиболее оптимальные точки открытия и закрытия ордеров. Стрелка вверх - сигнал на покупку, вниз - на продажу. Вторая - это информационная панель в правом верхнем углу. Крупным шрифтом обозначена текущая цена, над ней показаны: максимум дня, расстояние от текущей цены до него и разность максимума и минимума (в пунктах). Под ней расположены: минимум дня, расстояние до минимума,

Professional tool for professional traders It allows you to browse all available financial instruments and select best ones to trade with lightning speed.
Fastest market screening ever
Move your mouse over the instruments and instantly see 3 charts with selected timeframes and predefined indicators! Click on the symbol name to hold it. Use UP and DOWN keys to select previous / next instrument.
Ultimate charting Smooth scale, automatic indicator lines width, smart grid and much more. You'll

This EA places trades since opening of NewYork Stock Exchange (NYSE). It is based on a day reversal patterns which use the tendency of FX prices to move toward their average value during the NYSE session. The EA does not use indicators, martingale, arbitrage. The trading system is suitable for both experienced traders and beginners. Monitoring: https://www.mql5.com/en/signals/835592
Timeframe is the M5
Minimum account balance is $500 Default parameters are for EURUSD M5. But GBPUSD, GBPJ

Traders Toolbox Premium - это универсальный инструмент создан на основе обширного обучения общим торговым стратегиям с целью автоматизации этих стратегий и расчетов. Функции: 19 отдельных сигналов - Каждый из этих сигналов , которые смещены в нейронной сети конфигурации стиля , чтобы составить окончательный / общий результат. Каждый сигнал имеет свои собственные настройки, которые при необходимости можно настроить или оптимизировать. Всестороннее On экран Дисплей

Hedge Pro sfrutta la tecnica dell'hedging gestendo simultaneamente posizioni Buy e Sell e grazie al sistema di Recovery Integrato assegna alle posizioni successive un Size Lots proporzionale ai punti da recuperare sulla controtendenza affinché i Take Profit del Both Side siano sempre vicini al prezzo attuale di mercato. Hedge Pro è un expert dal codice stabile, professionale e pulito che crea dei profitti costanti nel tempo con un processo completamente automatico ed è immune da falsi e ritard

Быстрое закрытие всех позиций в один клик. Очень полезная кнопка, когда вы используете устреднение позиций, добавление новых ордеров, и когда цена возвращается на несколько секунд в нужную точку, и ордеров больше 10 очень важно успеть закрыть их все. Второй раз цена может и не вернуться. Сверхбыстрое исполнение. Ордера закрываются асинхнонно не дожидаясь предыдущего результата. Утилита позволяет добавлять кнопку в любое окно. Можно добавлять несколько кнопок для удобства. Кнопку(и) можно двигат

PanelCME - это инструмент для помощи трейдеру в ручной торговле. Данная панель автоматически выставляет стоп лосс и тейк профик к каждому ордеру. Имеет функцию перевода позиции в безубыток и функцию трала стоп лосса. Основное преимущество данной панели то, что тейк профит выставляется встречным лимитным ордером , что позволяет избежать проскальзывания при закрытии позиции. Данная панель делалась для скальпинга на СМЕ, но может так же работать и на форексе.
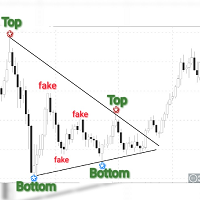
Obaforex Tops & Bottoms is a trading tool born out of a personal need to accurately filter tops and Bottoms and ensure consistency in the way tops and bottoms are picked for technical analysis. Mt4 version https://www.mql5.com/en/market/product/53637
It does not repaint (once top or bottom is printed, it don't disappear) It only prints tops and bottoms after a specified No of bars or candles to the right
This tool is expected to significantly improve the decision making of almost any form o

Индикатор Premier League связывает цену по циклично-волновой зависимости. Точки пересечения можно использовать как точки потенциального разворота рынка. Таким образом, все точки пересечения будут оптимальными точками, в которых изменяется движение с учетом периода индикатора. Но не надо забывать, что подход должен быть комплексным, сигналы индикатора требуют дополнительной информации для входа в рынок.

Easy Scalper MT5
LAUNCH PROMO: ONLY FEW COPY OUT OF AT $99!
Next price: 299$ Easy scalper designed to calculate the best time to buy or sell using many different techniques. The EA does not use grid, martingale, arbitrage. The trading system is suitable for both experienced traders and beginners. The EA includes protection against high spreads, and allows you to trade with a fixed or automatic lot size.Feel free to get in touch with me for any questions.
Monitoring : https://www.mql5.co

Xrade EA is an expert advisor as technical indicator. For short period trade it's the best for next previsions of the trend of the market.
+--------------------------------------------------------------------------------------- Very Important Our robot(data anylizer) does'nt take a trade procedure. If using only our robot you must take positions by yoursels +---------------------------------------------------------------------------------------
The technical indiator provide for a give

The Alexis EA Expert Advisor is a professional tool for trading grids of orders on financial instruments. The algorithm of the program is arranged in such a way that the EA uses price action base signals not on the current price. A special algorithm calculates the channel and the price range and uses it to generate signals. And if trade went into loss, EA manage it by martingale /grid. Advantages Automatic trading mode, no need manual interference Minimum Balance requirement; 200k cent / 200k
V3 RELEASED!
Promotional price: $30 - price will increase with the number of copies sold! PickyTrader V3
The EA is based on 3 WPR and 1 RSI and a Bollinger Bands indicator. The Bollinger Bands is the main filtering indicator, the EA trades can set to trade either when bands widen or when bands narrows. If Bollinger Bands allows a trade, the values of the other indicators are fed into a 3 layer neural network to filter the signal. If this neural network indicates that setup is tradable, the ve

Отличная панель для аналитики рынка. Панель помогает анализировать значения индикатора Momentum и его сигналы.
С помощью данной панели вы сможете: смотреть текущий сигнал с Momentum по всем таймфреймам; смотреть текущий сигнал с Momentum по разным символам; смотреть текущее значение Momentum ; несколько типов сигналов для аналитики.
Значения в ячейке таблицы: Значение индикатора
Тип сигнала: Momentum пересекает уровень 100 Momentum выше/ниже цены уровня 100 Momentum направление инди
GG Signal Scanner ATR base on ATR, MA and RSI indicators to determine trade times and entry points. The indicator scans all currency pairs in Market Watch or according to the list of currency pairs. The entry points will be listed of alerts and sent to the phone or email. Indicators are for use on one chart only and should not be used in conjunction with other indicators. Indicator should be used for M15 - H1 - H4 timeframe. In the strategy tester, the indicator only checks for 1 currency pair

Описание
Impulse Angle - индикатор, который идентифицирует на рынке импульсы и отображает на графике угол их наклона.
Рекомендации
Вы можете использовать данный индикатор для определения тренда (импульса) и соответственно для определения направления открытия позиции или закрытия противоположной позиции.
Параметры
===== _INDICATOR_SETTINGS_ ===== - настройки расчета индикатора
Maximum History Bars - максимальное количество баров истории для расчета индикатора. Average True Range Perio
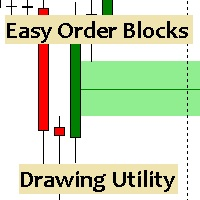
Esta utilidad dibuja Order Blocks y otros bloques fácilmente mediante el trazado rápido de lineas y rectángulos con 1 click y 1 tecla. Las teclas Hotkeys son programables y son 5: Order Blocks Fair Value Gaps (o Liquidity Void) Rejection Blocks Mitigation/Breaker Blocks Fast Object Delete (Borrado Rápido de objetos) Las 4 teclas de dibujo toman las coordenadas de la barra donde se clickeo y trazan 1 linea horizontal y 1 rectángulo delimitando la zona de OTE (Optimal Trade Entry). Automáticamente

The price is 450$ for next 10 buyers (Remaining copy :10) Next price: 600$ KAPITAL SECURE EA : I s a fully automated "arbitrage" trading system, which is especially effective in trading popular currency pairs, it uses 11 pairs at the same time: EURCHF, GBPNZD, AUDNZD, NZDUSD, NZDJPY, GBPAUD, EURCAD, EURUSD, EURJPY. In order to pass the MQL4 tests, we have modified the settings, you just need to download our profitable settings that we use on LIVE accounts. LIVE Signals: Capital #1 50K € Cap

Lows Highs Finder
Трендовый индикатор, дающий точные сигналы для входа в сделки. Идеальные точки входа в сделки для валют, крипты, металлов, акций, индексов. Наилучшие результаты на таймфрейме M15\H1 и выше!
Бывает на бирже маркетмейкер, не пускает цену у какого то уровня. С точностью до пункта. Вы хотите увидеть где? Индикатор находит и показывает на каком уровне цена ударилась в одно и то же место 2 или 3 раза! После этого, на следующей свече стрелкой указывает вход. + Свечной GA
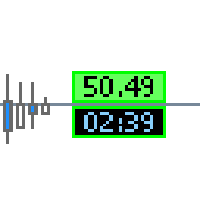
This tool gives you several informations about your broker and the current market events.
The top Infolabel shows the current spread price .
You can set whether the label should be displayed or hidden.
You can adjust price levels for automaticly change of background color.
The lower Infolabel shows the candle timer of the current time frame.
You can set whether the label should be displayed or hidden.
The bordercolor change to red if:
1. you have no connection to the tradeserver
2. y
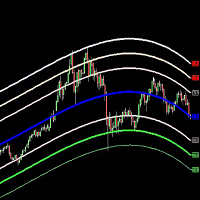
Belkhayate Gravity Center MT5 Custom
The Belkhayate center of gravity indicator is best used to confirm major turning points, and distinguish price extremes. Generally if price reaches the upper or lower levels one should expect a turn around coming soon, or at least a pull back towards the centre line if there is a strong trend. The upper and lower levels are red and green lines.
Our indicator use the same parameters as the well known trader M.Mostafa Belkhayate the inventor of the indi

The indicator determines a special pattern of Joe Dinapoli. It gives very high probability buy and sell signals. Indicator does not repaint. Indicator Usage Buy Signal ''B'' Entry : Market buy order at signal bar close Stop : Low of signal bar Take Profit : First swing high Sell Signal ''S'' Entry : Market sell order at signal bar close Stop : High of signal bar Take Profit : First swing low Indicator Parameters Fast EMA : External Parameter (should be kept as default) Slow EMA: External Param

The Squat is a function of the range of a given price bar and the volume, or TIC volume, that occurs while that range is being created. The basic idea is that high volume and little price movement indicate substantial support or resistance. The idea behind the approach to this indicator is to first look for likely Fibonacci support and resistance and then see if Squat manifests when that point is reached. The indicator determines one of the high probability patterns of DiNapoli. It does not re
MetaTrader Маркет - уникальная площадка по продаже роботов и технических индикаторов, не имеющая аналогов.
Памятка пользователя MQL5.community расскажет вам и о других возможностях, доступных трейдерам только у нас: копирование торговых сигналов, заказ программ для фрилансеров, автоматические расчеты через платежную систему, аренда вычислительных мощностей в MQL5 Cloud Network.
Вы упускаете торговые возможности:
- Бесплатные приложения для трейдинга
- 8 000+ сигналов для копирования
- Экономические новости для анализа финансовых рынков
Регистрация
Вход
Если у вас нет учетной записи, зарегистрируйтесь
Для авторизации и пользования сайтом MQL5.com необходимо разрешить использование файлов Сookie.
Пожалуйста, включите в вашем браузере данную настройку, иначе вы не сможете авторизоваться.