YouTubeにあるマーケットチュートリアルビデオをご覧ください
ロボットや指標を購入する
仮想ホスティングで
EAを実行
EAを実行
ロボットや指標を購入前にテストする
マーケットで収入を得る
販売のためにプロダクトをプレゼンテーションする方法
MetaTrader 5のためのエキスパートアドバイザーとインディケータ - 159

AnaliTIck is a financial instrument analysis and testing program based on the Metatrader5 platform. The object of analysis is the sequence of changes in the prices of Bid and Ask - ticks. The program may be useful to developers of scalping advisers and strategies, those who work on the news. When the program is loaded, an array of ticks for the financial instrument, on the chart of which the program is installed, is filled for the current period. The analyzed period is 4 trading days. On this pe

The result as the name explain, displays the result of a swing. Sometimes weis waves show a big effort, but a little result... The weis waves result is a better revelation about the volume, if united with weis waves. it is a volume indicator, but it is different from a conventional volume indicator, this indicator came from the wyckoff method, if you use the result you will have a different view of the market, regardless of which asset is operating.
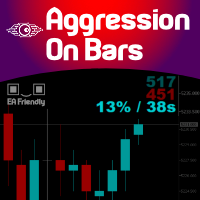
Imagine a Buy and Sell Pressure monitor on your chart that shows in REAL-TIME this data, bar by bar? Well, imagine no more. We present you an exclusive creation of Minions Labs : Aggression On Bars indicator. On every new bar on you chart this indicator will start counting in real-time the BUY/SELL pressure and present this data statistics directly inside your chart. As soon as a new bar is created in your chart, the counter restarts. Simple and effective. Just watch the video to see it running

The indicator predict the future candles direction, by scanning past candle movement. Based on the principal: “ The history repeat itself”. Programmed according to Kendall Correlation. In the settings menu, different scanning options are available. When the indicator find a match, start painting future candles from the current candle to the right, also from the current candle to the left as well, showing you the candle pattern what the actual signal is based on. The left side candle are option

The strategy which is applied in finance market all around the world is known as CTA strategy. A successful CTA always includes multi-strategies, multi-instruments and multi-timeframe. The series of Multi Instruments TrendSystem (MITS) provide a profitable strategy which can be used in different instruments with different timeframe. Multi Instruments TrendSystem 7 LB (Level Break) MT5 is a fully automated multi-instrument Expert Advisor. This EA works well in BTCUSD. This EA is one of our trend

Indicador Para Opções Binarias. Indicator for Binary Options Usa dois gales. Instalar em mt5 Esse indicador é para ser usado no tempo de vela de 5 minutos e em M5. Este também funciona em M1, porém é mais eficiente em M5. Só descompactar e copiar os arquivos na pasta de dados do seu MT5. Arquivos indicator na pasta MQL5 - Indicator. Baixe também a Media Movel totalmente gratis:
https://www.mql5.com/pt/market/product/50400
Esse Indicador é para a próxima vela. Apareceu a seta, só aguardar a pr
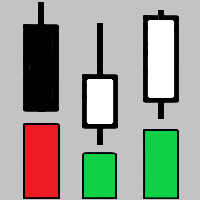
The indicator shows key volumes confirmed by the price movement.
The indicator allows you to analyze volumes in the direction, frequency of occurrence, and their value.
There are 2 modes of operation: taking into account the trend and not taking into account the trend (if the parameter Period_Trend = 0, then the trend is not taken into account; if the parameter Period_Trend is greater than zero, then the trend is taken into account in volumes).
The indicator does not redraw .
Settings Histo
MT4 Version Available Here: https://www.mql5.com/en/market/product/48040
Telegram Channel & Group : https://t.me/bluedigitsfx
V.I.P Group Access: Send Payment Proof to our Inbox
Recommended Broker: https://eb4.app/BDFXOsprey
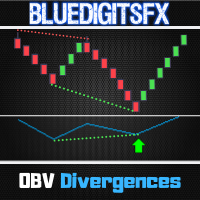
* Non-Repainting Indicator To Trade Divergences for any Newbie or Expert Trader ! BlueDigitsFx's OBV Divergence draws divergence lines on the chart and on the On Balance Volume (OBV) Indicator. Performs Amazingly at significant price areas such as support
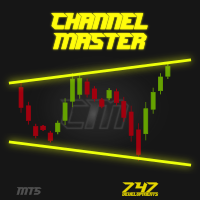
Channel Master is unique indicator for automatic channel finding. This indicator is fully adjustable by user. User can also put more instances of Channel Master to one chart with different channel size for better trend filtering. To find more information visit the 747Developments website. Features
Easy to use (just drag & drop to the chart) Fully adjustable Accessible via iCustom function Possible to use with any trading instrument Possible to use on any time-frame

Llama Crazy Pro MT5 is a trading robot for the trading on forex. This is a complete system with 11 Strategy in 1 EA . This Robot opens a large number of orders .
Important Information Revealed By purchasing this Expert Advisor you are entitled to receive a free copy of Scorpion Crazy Pro MT5 ! (All future updates included) -> To Receive it, Please Contact me by mql5 message or email !
This Expert advisor not use arbitrage or breakout, then we see an high resistance to slippage L

The Raschke Oscillator (LBR-RSI) indicator is the famous oscillator described in the book " Street Smarts: High Probability Short-term Trading Strategies " This indicator is perfect for a variety of researchs and it can be suitable to be used in combination with your own strategy just for trend trading or range-bound trading. The personal preference is to use it when the trend is not too strong, for example you can combine it with ADX to measure the strength of the trend and use it when ADX is b

The Hulk v1.15, expert advisor is configured to trade with default settings on three currency pairs and the H1 time frame: CHFJPY,USDCAD and CADJPY . If you intend to test or use this robot on multiple symbols, assign a unique magic number to each of them to ensure the robot understands its tasks. The default risk is set at 0.01, but you have the option to activate the MM system and manually determine the risk level for each position.
This robot encompasses 50 independent strategies that can

Только что открыли позицию, а цена резко пошла в другую сторону..Что делать? Просто потерпеть, усредниться или отстопиться (закрыться) и снова войти в сделку, но уже в противоположную сторону? Как поступить...а может просто снимать сливки и торговать по разворотным импульсам ….в этом Вам поможет и подскажет Индикатор тенденций и разворотов на базе коллекции паттернов советника ReversMartinTral https://www.mql5.com/ru/market/product/28761
который кроме рекомендаций и сигналов реверса вклю

The presented Damon expert system works with the EURUSD currency pair and only with it. This system implemented the principle of five orders - that is, a maximum of five orders can be placed in one direction, after which the total position of the series must be closed by stops, either real or virtual. The trading system is designed to work separately with a series of buy orders and separately with a series of sell orders. which makes the trading system versatile enough. The expert passes all ty

Skiey - Indicator of easy solutions! Using this indicator is very simple, since the simplest is to look at the chart and act according to the color arrows. Such a calculation option takes into account intraday price fluctuations and focuses on measuring the "candlestick" share in the trend.
The algorithm takes into account the measurement of prices, this method also emphasizes the measurement of each of the price drops (H / C, H / O, LC, LO) - which gives more detailed information but also mo

The Get Trend indicator was created to neutralize temporary pauses and rollbacks. It analyzes the behavior of the price and, if there is a temporary weakness of the trend, you can notice this from the indicator, as in the case of a pronounced change in the direction of the trend.
Currency pairs never rise or fall in a straight line. Their rises and falls are interspersed with pullbacks and turns. Every growth and every fall is reflected in your emotional state: hope is replaced by fear, and w

This indicator supports fast drawing of trendlines 1. Support drawing the next peak higher than the previous peak 2. Support drawing the lower peak after the previous peak 3. Support drawing the lower bottom of the bottom. 4. Support to draw the lower bottom higher than the previous bottom. 5. Support drawing trendline across the price zone. Peak connected vertex 6. Support drawing trendline across price range. Bottom connected Link to download and use for free. Including 02 files s

Despite the apparent simplicity of the indicator, inside it has complex analytical algorithms with which the system determines the moments of inputs. The indicator gives accurate and timely signals to enter and exit the transaction that appear on the current candle.
The main purpose of this indicator is to determine the moments of entry and exit from transactions, therefore, the Trend Revers indicator will display only the trend line and entry points, that is, displays the entry points to the

Price activity indicator showing the trend zone - flat, not redrawing previous values. The indicator is very sensitive to current price activity and displays signals quite well. The state of the market, the phase of its movement largely determines the success of the trader and his chosen strategy. The color version of the indicator signals a trend change. The indicator allows you to see a rising or falling trend. In addition to the trend direction, the indicator shows a change in the angle of in

The indicator displays 05 important parameters for traders 1. Display Bid -ASK price in big font 2. Display currency pair name and large time frame 3. TradeTick parameters 4. Swaplong and SwapShort 5. Point parameters used to calculate the price of SL or TP Indicators include 02 files supporting MT4 and MT5, You can download the link below. And follow the instructions of the video.
***Please Give Some Feedback and Reviews*** This is an indicator which shows the direction and the strength of the selected Symbol based on the two outputs, Signal and Value. The Signal indicates the directions as Buy equals 2(Blue) and Sell equals 1(Red). The Value output indicates the strength of the signal between -100 to 100. This indicator is both trend and fast preliminary indicator by choosing appropriate parameters. Indicator uses the Normalized ADX value as the hitting catalyst, which

Indicador Para Opções Binarias. Indicator for Binary Options Usa dois gales. Instalar em mt5 Esse indicador é para ser usado no tempo de vela de 5 minutos e em M5. Este também funciona em M1, porém é mais eficiente em M5. Só descompactar e copiar os arquivos na pasta de dados do seu MT5. Arquivos indicator na pasta MQL5 - Indicator. Baixe também a Media Movel totalmente gratis:
https://www.mql5.com/pt/market/product/50400
Esse Indicador é para a próxima vela. Apareceu a seta, só aguardar a pr
This utility tool shows the intraday price variation as a percentage. It just works on any symbol and timeframe. Inputs: Font Size: You can change the font size of the price variation. Defaults to 15. Corner Location: You can choose between "Left upper chart corner", "Left lower chart corner", "Right upper chart corner", "Right lower chart corner" to show the information.
At its most basic, the "Average Directional Movement Index Wilder" (ADXW) can be used to determine if a security/index/currencie is trending or not. This determination helps traders choose between a trend-following system or a non-trend-following system. Wilder suggests that a strong trend is present when ADXW is above 25 and no trend is present when ADXW is below 20. There appears to be a gray zone between 20 and 25. ADXW also has a fair amount of lag because of all the smoothing techniques. Ma

This Indicator draws Fibonacci Extension levels in two different ways. You can select whether to draw Fibonacci Extension levels based on your favourite ZigZag settings or you can let the indicator to draw Fibonacci Extension level based on given number of Bars or Candles. You can also set Mobile and Email notification for your favourite Extension levels individually. With this indicator you will not have to feel lonely as the it can generate Voice alerts, which will keep you focused on your

機械学習用のデータを用意するスクリプトです。 ストラテジーテスターで使用します。(気に入ってくれたら寄付感覚で購入お願いします) ファイルは「C:\Users\<ユーザ名>\AppData\Roaming\MetaQuotes\Tester\***アプリのID***\Agent-*\MQL5\FIles\」配下に出力されます。 (環境によって異なる可能性があります)
項目名 説明 MaPeriod 基本となる移動平均線の期間 PredictPeriod 予測対象となる未来の期間、(1時間足)30であれば30時間後 InputRange 過去~現在時刻までの幅 出力されるファイルの例: https://gist.github.com/tonarino210/26cdd8a3573fb71a3458616cbf99150e
FibTracer is an interactive Fibonacci tool that is aim to improve and facilitate your Fibonacci trading style. This Indicator can generate Fibonacci Retracement levels in two different ways. You can select whether to draw Fibonacci Retracement levels based on you favourite ZigZag settings or you can let the indicator to draw Fibonacci Retracement level based on given number of periods. You can also set Mobile and Email notification for your favourite Retracement levels individually. With this i

多数の取引を行う非指標グリッドアドバイザー。 Expert Advisorは常に市場に出ており、チャートにインストールされると、すぐに2つの反対方向のポジションを開き、組み込まれているアルゴリズムに従って作業を開始します。ポジションをクローズするには、ストップロス、テイクプロフィット、損益分岐点、トレーリングストップ機能を使用できます。貿易統計がチャートに表示されます。エキスパートアドバイザーは、経験豊富なトレーダーと初心者の両方に適しています。最も不安定なペアは仕事に適しています:GBPUSD、USDCAD、EURUSD、USDJPY、USDCHF、AUDUSD、NZDUSD。
オプション:
START_LOT-天びんの各Nの開始ロット(パラメーターSTART_LOT_BALANCE); START_LOT_BALANCE-ロット計算の基本通貨のN単位。 MIN_INTERVAL_SEC-新しい注文を開始する間隔(秒単位)。 ORDER_OPEN_STOP-注文間のグリッド注文を開くためのステップ。 ORDER_OPEN_STEP-注文を開くための現在の価格からのオフセット
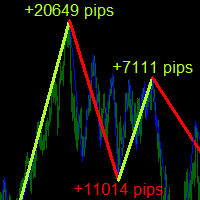
Description
ABC Trend Detector Pro is an indicator that identifies impulses and trends in the market and displays their presence on the price chart. Found patterns are drawn as colored connecting lines between their highs and lows. Above / below each extreme, the value of the range (the number of pips) of the trend is displayed.
Recommendations
You can use this indicator to determine the trend and, accordingly, to determine the direction of opening a position or closing an opposite posit
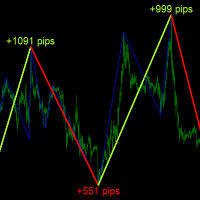
Description
ABC Trend Detector is an indicator that identifies impulses and trends in the market and displays their presence on the price chart. Found patterns are drawn as colored connecting lines between their highs and lows. Above / below each extreme, the value of the range (the number of pips) of the trend is displayed.
Recommendations
You can use this indicator to determine the trend and, accordingly, to determine the direction of opening a position or closing an opposite position

Hello!
My name is Daniel and I started developing a robot that followa the trends during the opening of the markets: NYSE, LSE etc.
The first minutes determine market trend. Current version: 1.1 At the moment it is only applicable on EUR/USD pair. DS - Robot v1 is very simple to use: Inputs: Fixed_volume - specify whether you want the transaction volume to depend on account resources. Volume - if Fixed_volume = true -> the transaction volume will always be constant if Fixed_volume = fal

Um especialista poderoso e profissional que permite gerar lucros estáveis com risco mínimo. IMPORTANTE! As instruções (na captura de tela) mostram as configurações para EURUSD. As configurações para outros pares de moedas serão otimizadas e adicionadas no futuro! IMPORTANTE! A frequência das ofertas de abertura pode variar de 1 em alguns dias a 5 em 1 dia. Depende diretamente do estado do mercado e do algoritmo para procurar sinais de entrada! IMPORTANTE! Recomendamos o uso das configurações e

CopierTrader is an easy-to-use and reliable position copier for the MetaTrader 5 account hedging system.This expert Advisor allows you to copy trades from multiple terminals (master) to a single terminal (slave).
When writing this adviser, the idea of quickly copying positions was implemented, i.e. the adviser sends requests to the server as quickly as possible. If it is impossible to quickly accept requests for trading operations by your broker, the adviser not only resends the rejected requ

Fibonacci fast drawing tool with 4 outstanding features 1. Quick action by clicking on the candle 2. Draw the bottom of the selection exactly 3. Include Standard Fibo levels and display prices at levels 4. Draw extended fibo to identify the price zone after break out Please see video clip below for more details. Free download link of FiboCandleClick indicator inside youtube.

Elite Tacticsは、安全で完全に自動化されたエキスパートアドバイザーであり、市場で最も重要なレベルを分析し、保留中の注文と取引して最速の執行を実現します。すべての注文はStopLossで保護されており、このEAは、スプレッドおよびスリッページ保護とともに高度なフィルタリング機能を実装しています。このEAは、マーチンゲール、グリッド、アービトラージなどの危険な戦略を使用していません。エリートタクティクスは、ユーザーが完全にカスタマイズできます。
このEAは、取引ペアや時間枠によって制限されません(EURUSDH1の時間枠で使用することをお勧めします。EliteTacticsのデフォルト設定もEURUSDH1用に最適化されています。
エリートタクティクスは、実際の取引口座を持つ両方のプラットフォーム(MT4とMT5)で検証され、可変スプレッドとシミュレートされた実行遅延を伴うMT5の100%実ティック、および可変スプレッドを備えたMT4の99.90%実ティックでテストとシミュレーションに合格しました。
すべての詳細情報、セットファイルの例、追加情報、最適化の推奨事項

******** 5 INDICATORS IN 1 *********** In statistics, the Zscore tells us the number of standard deviations by which the value of a raw score is above or below the mean value of what is being observed or measured. In trading the Zscore tells us the number of standard deviations by which the value of price is above or below a moving average of choice. For example a Zscore of 1.5 in a period of 20 tells us the closing price is currently 1.5 x standard deviations above the 20 period Moving Average

Quark "Old Style Guy!" The Expert Advisor is designed for use on any currency pair, but by default, it can be used on EURUSD in the H1 timeframe and is ready for immediate deployment. Please note that the latest update does not include preset files, and as a result, the behavior of old sets(comment sections) within this version may be uncertain. The robot is configured with a micro lot size for each individual position by default. To manage your risk level, you can activate the Money Management

MT5 の ALPHA TRADER インジケーターは、 Average Directional Movement Index と ATR インジケーターの有効性を活用するインジケーターであり、市場トレンドと、反転シグナルに命を与えるそれぞれの売られすぎおよび買われすぎゾーンへの確かな洞察を提供できます。したがって、投資家に反転シグナルを視覚的に提供できるインジケーターを作成するために使用される信じられないほど信頼できるリソースです。結局、このインジケーターは、色付きの矢印を使用して入力シグナルを正確に発信するためです。取引チャート。 <:p><:p> 下の赤い矢印は売りのシグナルを示し、青い矢印は買いのシグナルを示しますが、トレーダーは通常のルーチンを破棄してはならないため、このインジケーターを盲目的に使用しないようにする必要があります。テクニカル分析と弱気のトレンドでは、トレーダーは売りシグナルのみを優先することを決定でき、強気のトレンドでは、トレーダーは買いシグナルのみを優先することを決定できます。これにより、トレーダーはリスクを大幅に削減できます。インディケータとトレーダーが間

Robô Animus. Animus é um robô para day trade em mini índice Bovespa. Sua estratégia funciona exclusivamente no ativo WIN, apresentando uma ótima sequência de ganhos com suas duas operações diárias. - Negociação no ativo Mini Índice (WIN) na BM&F BOVESPA; - Operações 100% day trade; - O robô vai completamente configurado com os parâmetros da estratégia, pronto para realizar as operações diárias.
ATENÇÃO: Tipo de conta: [x] Netting, [ ] Hedge. Ativar o horário de funcionamento nos "Parâmetros d

This application exports all finished operations to a text file delimited by <TAB>, comma, semicolon or any character defined by the user, also including the comments and magic number of the operations, which can be easily exported to EXCEL or Google Spreadsheets.
The files are generated in the "files" folder, individually separated by month with the name in the format: 999999-AAAA BBBB- [9-9999] where:
999999 = MT5 Trading Account Number AAAA BBBB = Trading Account User Name [9-9999] - Mo

This application exports all completed operations to a text file delimited by <TAB>, comma, semicolon or any character defined by the user, also including the comments and magic number of the operations which can be easily exported to EXCEL or Google Spreadsheets.
The files are generated in the "files" folder, individually separated by month with the name in the format: 999999-AAAA BBBB- [9-9999] where:
999999 = MT5 Trading Account Number
AAAA BBBB = Trading Account User Name
[9-9999]

Hurst Fractal Index Фрактальный Индекс Херста - показатель персистентности временного ряда При значении индикатора >0.5 временной ряд считается персистентным (тенденция сохраняется) При значениях индикатора явно < 0.5 временной ряд считается антиперсистентным (возможна смена направления движения) Для наглядности значения индекса усредняются периодом 2-3. Настройки индикатора: Max Bars - глубина истории расчета (кол-во баров на графике для которых произведён расчет) Data from Timeframe - исполь

Stairway to heaven It is an advanced trading system. This is a fully automatic Expert Advisor. ONLY TWO INPUT TO SELECT FOR THE TRADER 20 YEARS BT IN DIFERENT PAIRS Stairway to heaven . It is a 100% automatic system, the system controls both the inputs and the batches, the operator just has to place the robot on the graph and let it act It is an ideal system for people who do not want complications or strange configurations. The system is self-sufficient, performing all the work.
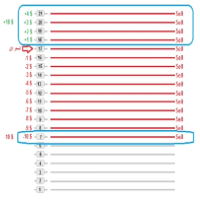
Советник написан по стратегии из видео.
Советник можно поставить на два графика одной валютной пары назначив им разные Magic number и указав разные направления торговли параметром Direction of trade. Стратегия была незначительно изменена. В видео показано, что закрываются сделки без прибыли, так сказать в ноль. Этот советник каждый раз закрывает прибыль не меньше стоимости шага сетки. Ещё добавлена возможность установить размер прибыли при достижении которой советник закроет все позиции своего

Automated trading system it's a professional instrument which allows you to achieve results without the negative influence of a human factor. Effectiveness is confirmed by trading on a real account since 2017. Perform all the tests with the modelling type RealTicks or EveryTick. LINKS Signal trading monitoring ( WeTrade + BOA System ); Telegram community; Video tutorial installation; Video tutorial optimization; Presets for popular symbols. TRADING STRATEGY DESCRIPTION The trading strategy
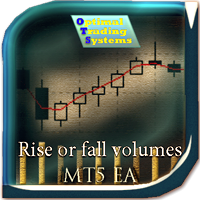
A trader cannot always discover what the last closed bar is by volume. This EA, analyzing all volumes inside this bar, can more accurately predict the behavior of large players in the market. In the settings, you can make different ways to determine the volume for growth, or for falling. This adviser can not only trade, but also visually display what volumes were inside the bar (for buying or selling). In addition, it has enough settings so that you can optimize the parameters for almost any ac

Super Zone For several years of observing the principles of the market, Super Zone worked, both then and now, because the indicator allows you to see the trading range of the week and even the month that major market participants use. It’s very easy to use, we work on H4 in the weekly range ( in the tester it doesn’t work in the demo mode ) - we sell from the upper zones, we buy from the lower ones. It marks the zones from the beginning of the week (month) that are not redrawn , works on

Горячие клавиши плюс клик левой кнопки мыши на графике. Советник открывает сделки, выставляет лимитные и стоповые ордера, удаляет ордера и закрывает позиции, также делает реверс открытых позиций, выставляет прописанные в настройках стоп лосс и тейк профит. (реверс только на неттинговых счетах) При запуске советника можно посмотреть подсказку как действует советник при нажатии клавиши + клик на графике.
Правее последнего бара, ниже цены Ctrl+ЛКМ - OpenSell Правее последнего бара, выше цены
Channelizer is able to trade all kind of markets (Stocks, Forex, Commodities, Futures, Cryptos). It makes trading decisions by analyzing Price Actions on the Regression Channel Lines. Product Home Page: https://www.mql5.com/en/market/product/49892
ADVANTAGES: Works on any market and any time frame Multiple Trading Strategies in three categories: Reversal, Breakout, Trend Follow Trades simultaneously on any number of markets under the same account Display Regression Channel while trading Can d
The strateggy: This EA has built-in CCI and MA indicators to determine the assets prices trend directions. The Commodity Channel Index (CCI) determines the trend directions by measuring the prices oscilations as the two Moving Averages (MAs) conffirm the trends as they cross each other; The EA has different inputs for long and short positions because tests show it is more efficient; It works with Trailing Stop Loss technique to protect the profiting positions. The Short Positions Inputs: Take p

Stochastic Reversal allows you to recognize reversals professionally. Stochastic Indicator: This technical indicator was developed by George Lane more than 50 years ago. The reason why this indicator survived for so many years is because it continues to show consistent signals even in these current times. The Stochastic indicator is a momentum indicator that shows you how strong or weak the current trend is. It helps you identify overbought and oversold market conditions within a trend. Rules
Fx Pulsar for the Meta Trader 5 platform is a professional expert who allows you to earn ≈ 100% profit per year! Great results for a long time!
MAIN CHARACTERISTICS: The Expert Advisor is ideally suited for EUR / USD (other correlated pairs are possible) Expert works fully automatically (we recommend using VPS) The expert has built-in functions for calculating signals by the Stochastic oscillator (no indicators are required) The expert uses Martingale in his work (can be disabled, se

Open time indicator 4 Major sessions. 1. Sydney is open 0h - 9h (GMT + 3) 4h - 13h (VN - GMT + 7) 2. Tokyo is open 3h - 12h (GMT + 3) 7h - 16h (VN - GMT + 7) 3. Lodon is open 10h - 19h (GMT + 3) 14h - 23h (VN - GMT + 7) 4. Newyork is open 15h - 24h (GMT + 3) 19h - 4h (VN - GMT + 7) Link download indicator KIDsEA Session Please come to my youtube for free download, please feel free for like and subscribe for my channel.
トレーダーのためにプロのトレーダーによって開発された穏やかなグリッドアドバイザー。それは成行注文で機能し、最初の取引は急激な動きで開始されます。最小ポジション保持時間と最小注文開始間隔(秒単位)の機能があります。これは、FIFO要件のあるアメリカのブローカーを含むすべてのブローカーと連携して、最初に、以前に開かれた取引を成立させることができます。注文は、一方向の注文バスケットによってクローズされます。ポジションをクローズするには、ストップロス、テイクプロフィット、損益分岐点、トレーリングストップ機能を使用できます。貿易統計がチャートに表示されます。
MT4バージョン-https:// www.mql5.com/en/market/product/49569
オプション: 言語-情報を表示するための言語を選択します。 MAGIC_NUMBER-マジックナンバー; ORDERS_COMMENT-注文のアドバイザーコメント。 MAX_SLIPPAGE-最大スリップ; MAX_SPREAD-取引を開始するときの最大スプレッド。 COMMISSION_CONTROL-ブローカーが取引ご

MoneyMaker stableATM Lite is an automatic intelligent trading system for foreign exchange! Lite edition just support MetaTrader 5! The purpose of MoneyMaker stableATM Lite is to stabilize profits, not to give you the ability to get rich overnight! MoneyMaker stableATM Lite is only applicable to EUR / USD currency trading, and cannot be used for other currency exchange trading, other CFD product trading, and commodity tradingor futures commodity trading! MoneyMaker stableATM Lite is only suitabl

***** IMPORTANT NOTE: DO NOT FORGET TO DETERMINE THE MAIN TREND DURING THE TEST. FOR AN UPWARD TREND MAKE "TRADE LONG: TRUE" AND "TRADE SHORT: FALSE" FOR A DOWNWARD TREND MAKE "TRADE LONG: FALSE" AND "TRADE SHORT: TRUE" AND FOR A HORIZONTAL BAND MAKE "TRADE LONG: TRUE" AND "TRADE SHORT: TRUE" IN THE SETTINGS. YOU CAN ALSO CHOOSE THE LONG TRADE, SHORT TRADE OR BOTH WAY IN REAL ACCOUNT BY THE HELP OF THE BUTTONS ON YOUR GRAPH IN ANY TIME. ***** "Statistics are like mini-skirts. They give yo

I present to you an indicator for manual trading on DeMark's trend lines. All significant levels, as well as the indicator signals are stored in the buffers of the indicator, which opens the possibility for full automation of the system. Bars for calculate (0 = unlimited) - Number of bars to search for points DeMark range (bars) - Shoulder size to determine point
Get all the moving averages in one indicator. Simple moving average, Exponential moving average, Smoothed moving average, Linear weighted moving average, Double Exponential Moving Average, Triple Exponential Moving Average, T3 Moving Average and MORE. Find in the comments a Free Expert Advisor that uses the XPMA . It will show you how easy to make an EA based on the XPMA (XP MOVING AVERAGE). Settings: Moving Average Type: The Moving Average Type. It can be one of these types: SMA (Simple Moving
Elite SR - Advanced Level Indicator for automatic detection of support and resistance levels with different degree of credibility should become a part of your trading arsenal. This indicator is accessible via iCustom function and provides level values as well as their degree of credibility. Elite SR is fully adjustable and can work on any time-frame with any trading instrument!
Important information For all detailed information about this indicator you can visit 747Developments website.
Feat

Are you accidently making mistakes with your stoplosses, you thought you were risking 5% but you actually risked 15%? Are you causing yourself unncessary drawdowns by moving the sl too many times? Don't worry this ea has your back, it lies in the background and always watches your risk. No matter how many orders you have open in both directions it will make sure you stop out at your set risk percent. It also removes all stoplosses and targets in the case of a full hedge situation.
The same as R
The EA uses 3 strategies: 1 - a strategy for breaking through important levels, 2-a strategy for reversing, and 3 - trading on a trend. To open a position, the expert Advisor evaluates the situation on the charts using 5 custom indicators. The EA also uses averaging elements in the form of several additional orders ( the EA does not increase the lot for averaging orders). The EA uses 8 adaptive functions for modifying and partially closing orders. Hidden Stop loss, Take Profit, Break Even and Tr

注意:外国為替トレーダー 「市場で取引するときにあなたにもっとお金を稼ぐチャートインディケーターを取得してください ... 」 はい!私はより多くのお金を稼ぎ、取引をシンプルにし、市場がリアルタイムで何をしているのかを簡単に理解する準備ができています! それに直面しよう、外国為替取引所での取引は複雑でストレスが多く、当惑しているように見えるかもしれません!チャートは、適切なシステムとインジケーターのガイドがなければ、圧倒的で混乱する可能性があります。チャートを正しく分析していないために再び市場に焦げてしまうのではないかと思うので、胃の結び目の感触を取り除きます。 「トレーダーのブロック」はどうですか?すべてのトレーダーが簡単に陥る 1 つの落とし穴は、大きな勝利または大きな損失の後の恐ろしい「トレーダーのブロック」です。あなたは大きな勝利の後に同じ成功を再現することができますか、または大きな損失の後に別の財政的な落とし穴に落ちることができますか?優れた釣り指標ガイドは、この問題を回避し、ストレスと不安を和らげるのに役立ちます。 " 究極の外国為替直感的なテクニカル指

Trend indicator, draws 2 bars of different colors on the chart. A change of one lane to another signals a market reversal in the opposite direction. The indicator also places on the chart 3 parallel dashed lines High, Middle, Low line which show respectively the top, middle, bottom of the forming reversal.
Parameters
Depth - Depth of indicator calculation, the higher the parameter, the longer-term signals; Deviation - Deviation of the indicator during drawing; Backstep - The intensity of th

With it, you leave pre-configured two expansion settings and one fibo retraction configuration to use via keyboard shortcut and mouse click.
That is, the Fibo_Z utility facilitates the use of MT5's native functions.
The shortcut keys are:
"Z" configuration 1 of the expansion.
"X" expansion setting 2
"Z" retraction configuration.
"V" clears objects from the screen.
It is.
Success and good trades!

このロボットは、RPTradeProSolutionsシステムの一部です。 Netting Scalperは、ティックダイナミクスとネッティングシステムを使用した高速取引ロボットです。
誰でも使用できるように設計されており、トレーディングの初心者でも使用できます。 M1専用に設計 テイクプロフィット、ストップロス、トレーリングストップを使用します。 SL/TPなしでスイッチとしても機能します 任意のペアで動作します どのように機能しますか NettingScalperは高速のM1スカルパーです。 インジケーターを使用していません。 それはブローカーのダニの分布に従います。 トレードは、TP / SL/TSまたは次の反対のトレードによって停止されます。 ヘッジも平均化もありません。 取引は次の取引を開始する前に終了する必要がありますが、いくつかの取引を実行できます。 Netting Scalperは各ティックを制御しますが、実際のティックでのみ最適化する必要があります。
ネッティングスカルパーは機能します FXペア、インデックス、金属、先物などのあらゆる商品を使用します。 さま

The WT Vwap Bands indicator is an indicator that combines price and volume, helping to show whether the price is within the "fair price", overbought or oversold.
The indicator code was designed for performance and has already been tested in a real trading account.
In addition to the visual inputs (color, thickness and line style), the user can define a% value that depends on the price.
The default values work with the most distant band at 1% of the price and then dividing this distan

On Control EA MT5 V2 Game-Changing Software For The Forex Market On Control EA was created to help traders like you maximize their income. How would you like to gain access to a world-class proprietary piece of software designed for one purpose, to improve your Forex strategy? Let’s be honest, it can be hard to understand which technical analysis & trading signals you should follow. With On Control EA, you now have a powerful tool that will enhance your Forex trading strategy & elevate your in

The Stepper indicator generates Signals in strong Trend zones. Even when the Trend is set, we must filter when to ENTER or HOLD the trigger. The Trend is represented by two lines: Trend UP and Trend DOWN. W e are in a Bullish trend when the Trend UP (Green line) is above. And in a Bearish trend when the Trend DOWN (Pink line) is above.
When the momentum is aligned with the Trend , this indicator generates: BUY signals (LIME line) SELL signals (RED line) The user is alerted of the scenario, at

Hi Friends! this is countdown candles with 4 functions. 1. Countdown current Candles 2. Countdown H1 timeframe. 3. Countdown H4 timeframe. 4. show the spread index and the lowest spread value within 5 minutes. Instructions for installing and downloading this indicator in the link below. https://www.youtube.com/watch?v=fi8N84epuDw
Wish you have a happy and successful day.

私は連星の利用に対するその商用戦略をMT5で自動化しました、そして、我々のMt5BridgeBinaryで、私はそのBinary口座に命令を送りました、そして、私は以下をリストします:簡単なもののこの方法を操作し始めてください!
専門家のアドバイザーは、頑健さテストを最適化して、認識するために、作るのが簡単です;また、テストでは、その長期の収益性(我々がその最高の戦略をBinaryに接続するためにMt5BridgeBinaryをつくった理由です)を、我々は推定することができます。
特徴: - それは、私が望んだくらい多くの戦略を使用することができます。(専門家のアドバイザー)。 - 彼は、更なるプログラムを必要としません。 - 時間枠を輸入することなく、我々のEAを囲んでください。 - それは、すべての開いた活動を視覚化することができます。 - 彼だけは、すべての命令を受けるために1つのグラフだけの中で我々のEAを実行する必要があります。 - 我々のEAが働くように、それは複雑な構成を必要としません。
入場パラメータ: - メール:電子メールは、Binaryのその報告に関
MetaTraderマーケットが取引戦略とテクニカル指標を販売するための最適な場所である理由をご存じですか?宣伝もソフトウェア保護も必要なく、支払いのトラブルもないことです。これらはすべて、MetaTraderマーケットで提供されます。
取引の機会を逃しています。
- 無料取引アプリ
- 8千を超えるシグナルをコピー
- 金融ニュースで金融マーケットを探索
新規登録
ログイン