YouTubeにあるマーケットチュートリアルビデオをご覧ください
ロボットや指標を購入する
仮想ホスティングで
EAを実行
EAを実行
ロボットや指標を購入前にテストする
マーケットで収入を得る
販売のためにプロダクトをプレゼンテーションする方法
MetaTrader 5のためのエキスパートアドバイザーとインディケータ - 171

LinLit mq5 EURAUD is fully automated EA. The input parameters are optimized for EURAUD - M15 time frame We use, Envelopes, Volumes and Money Flow Index indicators EA NOT use Martingale, GRID, Averaging and other dangerous strategies! Full compliance with the FIFO method! Recommendations EA Settings : Use default settings. Symbol : EURAUD. Time Frame : M15. Brokers : ECN brokers, low spread/commission, 1:400 leverage Minimum Deposit : $200 USD.
Parameters Entry lot size : Initial lot siz

LinLit mq5 AUDCAD is fully automated EA. The input parameters are optimized for AUDCAD - M15 time frame, But can also work on other pairs, and CFD's and time frames We use, Directional Indicators and Bollinger Bands indicators EA NOT use Martingale, GRID, Averaging and other dangerous strategies! Full compliance with the FIFO method! Recommendations EA Settings : Use default settings. Symbol : AUDCAD. Time Frame : M15. Brokers : ECN brokers, low spread/commission, 1:400 leverage Minimum

LinLit mq5 GBPUSD is fully automated EA. The input parameters are optimized for GBPUSD - M15 time frame, But can also work on other pairs, and CFD's and time frames We use, Bollinger Bands and Stochastic indicators EA NOT use Martingale, GRID, Averaging and other dangerous strategies! Full compliance with the FIFO method! Recommendations EA Settings : Use default settings. Symbol : GBPUSD. Time Frame : M15. Brokers : ECN brokers, low spread/commission, 1:400 leverage Minimum Deposit : $2

LinLit mq5 EURUSD is fully automated EA. The input parameters are optimized for EURUSD - M15 time frame, But can also work on other pairs, and CFD's and time frames We use, Commodity Channel Index, Force Index and Standard Deviation indicators EA NOT use Martingale, GRID, Averaging and other dangerous strategies! Full compliance with the FIFO method! Recommendations EA Settings : Use default settings. Symbol : EURUSD. Time Frame : M15. Brokers : ECN brokers, low spread/commission, 1:400 leverag
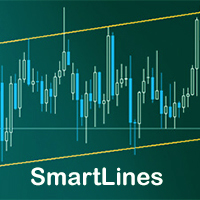
SmartLines allows you to open orders using trend lines. SmartLines for MT4 https://www.mql5.com/ru/market/product/25875
Now you have the opportunity to control breakthroughs of the trend corridor automatically and without delay. As soon as the price crosses your trend line with your settings, the order is automatically opened. You will not miss the moment of the trend change. The principle of working with SmartLines is similar to placement of pending orders. However, pending orders only have t

This Expert Adviser is based on the crossover of moving averages. The user can select to employ up to 10 moving averages which crossover each other to execute market orders (open and close trades). The selected number of moving averages to crossover each other for opening trades and their individual configurations are independent of the selected number of moving averages to crossover each other for closing trades and their individual configurations. The user can also choose to configure up to 5

Warning! The default input values are already optimized for EURUSD at time frame M1, spread at 14 and hedged account mode with leverage 1:100 and initial deposit of US$ 10,000, if you don't have this balance, I suggest you to use a CENT account. Always use the strategy tester optimization to set the best values for your assets, time frame, spread and account mode. It is very important and strongly recommended for successful trading. Optimize the input values as your needs.The EA's Strategy: This

This indicator uses volume and volatility information to indicate the trend or to indicate the market reversion/correction. There are 2 indicators in one. The indicator works in two styles: values per candle and accumulated values. Using the volume and volatility information, when well adjusted, this indicator has a good probability to indicate the right direction, both in lower (M1, M2, M5) and higher (M15, M30) timeframes.
Strategy 1: Trend indicator Indicates the operation direction. To u

Average True Range. Fully automatic. Calculates last candle high and low for finding trends. Strong results with british pound in daily charts. Uses Atr modificable periods, trailing stop and take profit. Tested in real accounts. Is a great expert advisor with great results. You can choose the risk you want to take. Can calculate automaticaly the total amount of risk for new trades. Tested with 10 years data. Best inputs 1 atr for open, 2 for close. Atr settings to 200.

Description
The base of this indicator is an ZigZag algorithm based on ATR and Fibo retracement. The ZigZag can be drawn like a classic ZigZag or like Arrows or needn't be drawn at all. This indicator is not redrawing in sense that the ZigZag's last shoulder is formed right after the appropriate conditions occur on the market. The shoulder doesn't change its direction afterwards (can only continue). There are some other possibilities to show advanced information in this indicator: Auto Fibo on
Automatic stops monitors your account and automatically sets the values you enter in the EA for stop loss, take profit and also trailing stop. As long as the EA is attached on a chart it will set stops and offer automatic trailing to any new trades for that currency pair so you wont have to manually enter them every time you open a trade. Features include: Ability to select which trades should be monitored via magic number. You can leave the value to 0 to only monitor manual trades or to any one
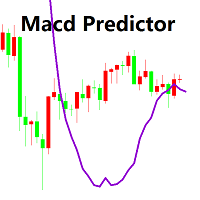
Macdのメインチャートインジケータ
1. MACDが買いから売りに変わる価格を決定することができます。逆も同様です。 これはオシレータの予測子のいとこです。 当時のポジションを知っていれば、正確な価格、現在および次の(将来の)列はMACDクロスオーバに到達する必要があります。 あなたは、現在のポジションが次のMACDクロスオーバーフォースによって助けられたりブロックされたりする前に、市場がどのくらい離れていなければならないかを見ることもできます。 プレディクタはリアルタイムで更新されるため、すべての時間枠でこれを行うことができます。
2. MACD予測変数の履歴を使って価格行動を明確に観察し、棒グラフに直接重ねることで、市場の「動圧」を決定できます。 ダイナミックな圧力とは、信号を売買する市場の反応を指します。 MACDで30分間販売していて、市場が平坦であれば、次の購入信号が簡単に大きな勝者になることがわかります! これは私がよく標準MACDで行うことですが、今は見やすいです! input: Fast EMA - period of the fast Moving Av
The expert allows you to build a trading system based on an arbitrary set of technical indicators MT5. The EA uses the following signals: - OpenBuy / OpenSell - opening positions;
- StopBuy / StopSell - closing positions;
- TakeProfitBuy / TakeProfitSell - get TP levels;
- StopLossBuy / StopLossSell - getting SL levels;
- NoLossBuy / NoLossSell - transfer to the breakeven state;
- MinProfitBuy / MinProfitSell - closing part of a position;
- CancelBuy / CancelSell - allow a repeated signal
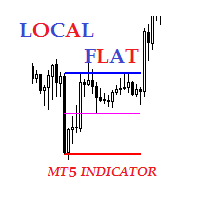
Description The indicator of local flat. The indicator allows to find local flats in the following options: Width of channels that is not more than certain number of points Width of channels that is not less than certain number of points Width of channels that is not more and not less than certain number of points The indicator displays the middle and boundaries of the channel. Attaching multiple instances of the indicator to the chart with different ranges leads to displaying a system of chann
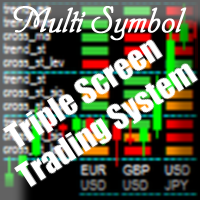
Purpose The indicator is intended for manual multi-currency trading based on the Triple Screen Strategy. It works with any symbols located in the Market Watch window of the MT5: currencies, metals, indexes, etc. The number of instruments can be limited by capacity of the МТ5's parameters. But if desired, you can create several windows with various set of instruments and parameters.
Operation Principle The indicator uses the modified Triple Screen Strategy for determining trend direction in the

The Expert Advisor is a great tool that allows you to control your trade with ease and precision. The tool can be moved in the graphs and offers the following characteristics:
Instant order entry with a single click. Entry of pending orders using price tags and trend lines. Instant order closure with a single click. Instant order closure using trend lines as output levels that the broker can not see. We can modify the way to enter and exit the market, allowing us to choose the way to do it. Fo

Average True Range. Calculates last candle high and low for finding trends. Strong results with british pound in daily charts. Uses Atr modificable periods, trailing stop and take profit. Tested in real accounts. Is a great expert advisor with great results. You can choose the risk you want to take. Can calculate automaticaly the total amount of risk for new trades.

The EA uses economic news trading using low, medium and high news. The EA is set for each piece of news separately. Trading is conducted on 26 currency pairs and 3 timeframes from M5-M30. The EA uses trading on such indicators as CCI, Standard Deviation, Moving Average, Relative Strength Index, Momentum and MACD . The EA looks for small price deviations by indicators and uses 3 types of economic news to confirm the position opening. Adaptive breakeven, trailing stop , and partial position clo

Warning! The default input values are already optimized for EURUSD at time frame M1, spread at 16 and hedged account mode with leverage 1:100 and initial deposit of US$ 500. Always use the strategy tester optimization to set the best values for your assets, time frame, spread and account mode. It is very important and strongly recommended for successful trading. Optimize the input values as your needs. The EA's Strategy: This expert advisor uses 2 built in indicators (Zig Zag and CCI) in order t
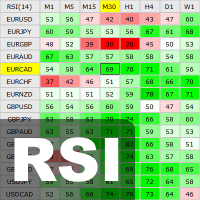
This indicator shows the current RSI values for multiple symbols and multiple timeframes and allows you to switch between timeframes and symbols with one click directly from the matrix. With this indicator, you can analyze large number of symbols across multiple timeframes and detect the strongest trends in just a few seconds.
Features Shows RSI values for multiple symbols and timeframes simultaneously. Colored cells with progressive color intensity depending on the RSI values. Ability to chan

The utility refers to probabilistic analysis tools, in particular the Monte Carlo method. The Monte Carlo method is defined as the simulation of processes in purpose to evaluate their probabilistic characteristics and apply them to the solvable task.
Operation features The simulation uses a tick model with the subsequent transformation to the candles form, as a model as close as possible to the real market process. The utility generates a stream of a random tick sequence until a result with t

This indicator shows the remaining time for the candle to close, even if the price does not change in value, the clock keeps counting backward. You can also program price alert levels using trend lines.
It can be used together with Expert Advisors and other panels, such as Controller without limit MT5
MT4 version
Instructions To set a price alert level, you must draw a trend line. Once the object has been drawn, it must be named so that the indicator recognizes the object. In the

This is a complete and customizable Trading HUD (Head-Up Display) combining all important tools and information for professional trading in one window. Features:
1. Display key indicators that most professionals consider for their trading decisions Current daily, weekly and/or monthly Pivot Points with 7 Levels (PP, S1, S2, S3, R1, R2, R3) Complete history of daily, weekly and/or monthly Pivot Points Current level of exponential moving averages (EMAs) from different timeframes. The User can de
The Expert Advisor allows you to build a trading system based on a custom indicator. It performs automated opening/closing of trades based on the signals of arrow indicators (which buffer values other than 0 and EMPTY_VALUE) or color lines. The EA polls the values of the specified indicator buffers, opens/closes and accompanies trades according to the specified parameters.
The Expert Advisor implements the following trade support functions:
-installation of SL and TP; -calculation of th

Market profile was developed by Peter Steidlmayer in the second half of last century. This is a very effective tool if you understand the nature and usage. It's not like common tools like EMA, RSI, MACD or Bollinger Bands. It operates independently of price, not based on price but its core is volume. The volume is normal, as the instrument is sung everywhere. But the special thing here is that the Market Profile represents the volume at each price level.
1. Price Histogram
The Price Histogram

Price action is among the most popular trading concepts. A trader who knows how to use price action the right way can often improve his performance and his way of looking at charts significantly. However, there are still a lot of misunderstandings and half-truths circulating that confuse traders and set them up for failure. Using PA Trend Reversal will be possible to identify high probability exhaustion moves of a trend. Features The indicator gives alerts in real-time when the conditions are me

Renko Graph 練行足グラフ 現在の価格の場所にあるメインチャートウィンドウの練行足インジケーター。 インディケータは、通常の相場チャートの背景に対して、長方形(「ブリック」)の形で価格変動を表示します。設定で指定されたポイント数による価格の上昇は、前の次の長方形の上に追加することによってマークされ、下向きの動きは前の長方形の下に追加されます。 インジケーターは、主なトレンドを視覚的に識別するように設計されています。根底にあるトレンドを平均化する際に、主要なサポートとレジスタンスのレベルを特定するために使用されます。このビューでは、小さな価格変動(「ノイズ」)は考慮されていないため、非常に重要な動きに集中できます。 価格変動が指定されたしきい値レベルを超えた場合にのみ、上または下の新しい指標値がプロットされます。サイズは設定で設定され、常に同じです。たとえば、基本サイズが10ポイントで、価格が20上昇した場合、2つのインジケーター値が作成されます。 インジケーターの利点は、どのレンガでもその形成時間の長さを示すことができることです。価格が範囲内で変動し、成長せず、しきい値の

The Expert Advisor CoreX works with ticks on both netting and hedging account types. The internal algorithm uses a tick (not a bar) as a unit for analysis. The product works with 5-digit quotes. Requotes are critical. A broker with the minimum execution delay is required. The Expert Advisor does not use history stored in the database. It downloads history data online creating its own database stored in the internal memory. After the restart, the database is deleted and should be downloaded ag
マスターキットは、既製のEAであなたの戦略が含まれてい
スキャルピング/トレンド/カウンタートレンド/フラット=一つにすべて、唯一の気分!
フォーツと外国為替
EAの可能性は巨大です。 設定の組み合わ
簡単なセットアップでボリュームを増やす複雑で信頼性の高いメインシステムを使用
可能な設定:
方向-購入のみ、販売のみ、またはRSIインジケータによる自動選択の方向 最初の巻 最大取引ロット ボリューム多重度-取引を失うのシリーズの後にボリュームを増加させる回数。 ストップロス Profit factor-数値として設定します。 それが4の場合、SL=100、TP=400です。 増加する取引を失う-SLによって行のどのように多くの取引 損失なしで取引をスキップ-"はい"または"いいえ"の選択。 "はい"オプションが有効になっている場合、トレーリングストップが取引を損益分岐に移動した場合、取引はSLシリーズでは考慮されず、ボリュームを増加 "いいえ"が選択されている場合、いずれの場合でも、SL取引はシリーズでカウントされ、ボリュームが増加します 末

The script opens a separate window and displays information about the current open positions in it.
The informer will be useful to those who operate with a large number of positions open on different instruments in different directions.
It allows you to quickly decompose the loading of the deposit by instruments, visually identify the most tense places in the aggregate position. For the exposed stop orders, it calculates the total risks and goals.

MMM Zig Zag Strategy: The Expert Advisors uses its built-in Zig Zag indicator to determine the prices trends and calculates the signal to decide to open buy or sell positions. It sends an order, closes or moves the Trailing Stop loss position as the indicator works. With this indicator, the EA opens new orders and closes them at the right time You can define the time period of each day of the week the EA should not trade (the bad time to trade). Usually the period of day when the impact news ar

Slick 指標は、取引決定を行うためのアラート信号を備えた二重アイロン相対力指数(RSI)です。インジケーターは価格に従い、その値は0〜100の範囲です。インジケーターの範囲は通常のRSIインジケーターの範囲と同じです。 インジケーター設定の説明: Period_1-インデックスを計算するための期間 Period_2-インジケーターの平滑化の主要な期間 Period_3-インジケータースムージングの2次期間 MAMethod-アンチエイリアシングメソッド AppliedPrice-価格定数 MAX_bound-上位信号ゾーンのレベル MIN_bound-下位信号ゾーンのレベル アラート-カスタムデータを含むダイアログボックスを有効にします Text_BUY-買いシグナルのカスタムテキスト Text_SELL-売りシグナルのカスタムテキスト Send_Mail- [メール]タブの設定ウィンドウで指定されたアドレスにメールを送信します 件名-メールヘッダー Send_Notification- [通知]タブの設定ウィンドウでMetaQuotesIDが指定されているモバイル端末に通知を

WavesTrends このオシレーターは、価格が一定の範囲内で変動する場合に使用される市場指標の1つです。オシレーターには独自の境界(上限と下限)があり、近づくと、市場参加者は売られ過ぎまたは買われ過ぎの市場に関する情報を受け取ります。インディケータは、特定のボラティリティの範囲内で価格変動を登録します。 オシレーターシグナルが価格チャートで確認されると、取引の可能性が高まります。この方向は、オシレーターのいわゆる上部ゾーンと下部ゾーンに反映されます。楽器は買われ過ぎと売られ過ぎの状態に基づいています。これらのパラメータを決定するために、特別なレベルが設定されます。 発振器は本質的に二次的です。これは、主要なツールとしてではなく、分析のための補助的なツールと見なす必要があります。主なパラメータは常に実際の価格変動です。 インジケーター設定の説明: Waves_Period-インジケーターを計算するための主要な期間 Trends_Period-インジケーターを計算するための2次期間 Width_Period-線の間の幅を計算するための期間 ARROW_SHIFT-信号ポイントの垂直

This is Gekko's customizable version of the famous Heiken Ashi indicator. It extends the use of the famous Heiken Ashi and calculates strong entry and exit signals. Inputs Number of Bars to Plot Indicator: number of historical bars to plot the indicator, keep it low for better performance; Produce Arrow Signals: determine if the indicator will plot arrow signal for long/short; Produces Signal Only When a Bar Closes: wait for a bar to close to produce a signal (more accurate, by delayed entry

What is The Waiter ?
It is an automated system to always be ready to catch the big movements of the market
How does it work?
Set the mode (stop or limit) Set the pending orders distance Set Take Profit / Stop Loss Wait for the big candle
settings:
entry : 0.OFF (the expert advisor won't operate. only for chart info purposes.) 1.New candle, new STOP orders (each new candle two stop orders are placed. If they are not activated by the end of the candle, they will be cancelled) 2.New candle

BinaryPinMt5 is an indicator developed and adapted specifically for trading short-term binary options. The indicator's algorithm, before issuing the signal, analyzes many factors, such as market volatility, searches for the PinBar pattern, calculates the probability of success when making a deal. The indicator is set in the usual way. The indicator itself consists of an information window where the name of the trading instrument is displayed, the probability of making a successful transaction,

is a fully automatic Forex trading Expert Advisor. The robot can run on any instrument, but the results are better with EURUSD on the H1 timeframe. If you are a long-term investor looking at yearly profits with high Sharpe-ratio then Money magnet is a good option. Please check the comment part to share your settings with others and enjoy the latest optimal settings uploaded by other users.
Expert Advisor Advantages High Sharpe-ratio The EA does not use such systems as martingale, hedging, g

The EA uses two strategies, the first trend strategy the second reverse strategy can be enabled or disabled through the settings. The EA has been optimized for the last 10 years. The adviser uses a variety of indicators such as Bollinger Bands , Moving Average , Momentum with different settings for the most accurate signals. To close positions, stop loss and take profit are used, as well as additional methods of order modifications. Very easy to set up, does not require special knowledge. You c

Delta EMA is a momentum indicator based on the changes of closing price from one bar to the next. It displays a histogram of the exponential moving average of those changes, showing magnitude and direction of trend. Positive delta values are displayed as green bars, and negative delta values are displayed as red bars. The transition from negative to positive delta, or from positive to negative delta, indicates trend reversal. Transition bars that exceed a user specified value are displayed in br

Tarzan この指標は、相対力指数の読み取りに基づいています。
速い線は、シニア期間からのインデックスの読み取り値です。たとえば、H4期間からのインジケーターの読み取り値が設定され、インジケーターがM15に設定されている場合、シニア期間の1つのバーに収まるバーの数だけ再描画されます。 、再描画はM15期間で16小節になります。
スローラインは、平滑化された移動平均インデックスです。
インディケータは、設定に応じて、さまざまなタイプのシグナルを使用して取引の決定を行います。 インジケーター設定の説明: TimeFrame-インジケーターが計算されるチャート期間。 RSI_period-インデックスを計算するための平均期間。 RSI_applied-中古価格。 MA_period-インデックス平滑化期間。 iMA_method-アンチエイリアシングメソッド アラート-カスタムデータを含むダイアログボックスを有効にします Text_BUY-買いシグナルのカスタムテキスト Text_SELL-売りシグナルのカスタムテキスト Send_Mail- [メール]タブの設定ウィンドウで指定

Панель предназначена для быстрого визуального нахождения и отображения внутренних баров по всем периодам и на любых выбранных валютных парах одновременно. Цвет сигнальных кнопок, указывает на направление паттерна. По клику на сигнальную кнопку, осуществляется открытие графика с данным паттерном. Отключить не используемые периоды, можно кликом по его заголовку. Имеется поиск в истории (по предыдущим барам). Прокрутка (scrolling) панели, осуществляется клавишами "UP" "DOWN" на клавиатуре. Имеется

This expert advisor trades a breakout strategy without using pending orders. It is a fully automated trading robot, which looking a turnover candle formations PivotPointHigh and PivotPointLow in the market. From these formations selects the strongest and these then form the supports and resistances, which are traded. The best results are achieved at higher TF from M30.
Continuous operation and quality ECN broker is recommended. A small StopLoss is set for each trade The default setting is for

Rush Point System
It is a detector indicator of breakage of support and resistance with continuity force.
Operation:
The Rush Point System detects in real time when a buying or buying force exceeds the spread limits in order to consume large quantities of lots placed in the book, which made price barriers - also called support / resistance.
At the very moment of the break, the indicator will show in the current candle which force is acting, plotting in the green color to signal purchasin

Rush Point Histogram Continuity force indicator. Operation: After a breach of support or resistance of an asset, the trader can understand by reading the histogram if such a move tends to continue, thus filtering false breaks or short breaks without trend formation. Through a simple, level-based reading, the trader can make a decision based on the histogram, where: Below 21: No trend formation 21 to 34: Weak trend 34 to 55: Strong Trend 55 to 89: Strong tendency Suggested Reading: Observed disru

IndCorrelationTable Ind Correlation Table - 通貨ペアの相関関係に基づく方法を使用して、Forex市場でトレーダー取引を支援するように設計されています。 2つの計測器間の相関依存性は、K. PearsonとC. Spearmanの係数によって計算されます。この表の主な機能は、事前設定されたパラメータ、および戦略に従ってトランザクションの方向に従ってトランザクションの「バスケット」を開く可能性についての形式化された信号を出力することである。他のデバイスに通知する必要がある場合、プッシュ通知と電子メールを介して信号を複製することができます。 アプリケーション: 相関係数の計算(変換はキャンドルの終了時に実行されます)。 インジケータの入力パラメータで作業するには、推奨されたしきい値がすでに設定されています。 信号数を増やすには、複数の時間枠に同時にテーブルを適用することができます(M15からH1の推奨時間枠)。
指標パラメータ シンボル(1,2,3) - 通貨ペアのバスケットのリスト(1つのリスト17に入力されたバスケットの数の制限)。 Tim

—— 进入本指标前,请谨记:『 不易,变易 』。拔开数理统计的枝叶,变化是不变的定理才是本指标的由来和内涵思想。本指标只应指明变化到不变之间的契机。 本指标——阴阳线指标(YiiYnn)由一条粗蓝色实线和一条细烟绿色虚线构成,粗实线叫阳线(Ynn),作为主线,细虚线叫阴线(Yii),作为辅线。本指标不同DeMarks去搜索哪个周期的最高最低,也不同Stoch那样告诉你超买超卖超过后缩小再等超买超卖直至资金的尽头。本指标是分析价格减速动态均值线的(偏)相关性及自相关性,并采用标准差的方法进行滤波以求趋势示意更明朗。所以,本指标有以下特性: 指标依据波浪理论,有二阶线性插值模拟组合多条均线(开收高低)构建波浪动力并分析它们各自相关性,所以将对趋势有很好的 预测性 ——与MACD、ATR等相比。它并非只让我们看到趋势的尾巴,请参考最后一张示例图; 指标采用简单的方差进行差相过滤,在兼顾计算性能的同时让盘整阶段的指示更明朗; 阳线与阴线之间是偏相关差相,具有阴消阳长相互激励、抵消的特点,因此命名; 本指标中判定的趋势与常人所称『趋势』不同,本指标中的趋势包括: 上涨、下跌和横盘 。不要忽略横盘

Мультитаймфреймовый индикатор показывает спрос и предложение, вырожденный через тиковый объем. Индикатор разделен на 3 зоны. Зона снизу показывает спрос и предложение текущего временного периода. Выше нее располагается значения показывающий таймфрейм старшего периода. В верхней зоне располагается отображение таймфрейма на 2 больше текущего. Пример: основной временной период 1 минута - будет отображаться в нижней зоне индикатора. Выше нее расположится 5 минутный период. В 3 зоне расположится 1

MMM Commodity Channel Index Mapped Timeframe Strategy: The Expert Advisors uses its two built-in CCI indicators in 12 different timeframes to determine the prices trends and calculates the signal to decide to open buy or sell positions; You can define the time period of each day of the week the EA should not trade (the bad time to trade). Usually the period of day when the impact news are published. This way the EA will trade only on good hours. General Inputs Closes orders with any profit of va
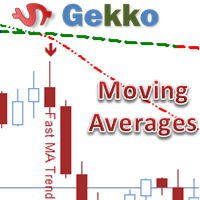
his is Gekko's Moving Averages indicator. It extends the use of the famous moving averages and calculates strong entry and exit signals using Price versus a Fast Moving Average versus a Slow Moving Average. You can set it up in many different ways, eg: price crossing, moving averages crossing, moving averages trend, among others.
Inputs Number of Bars to Plot Indicator: number of historical bars to plot the indicator, keep it low for better performance; FAST Moving Average Details: settings f

The indicator Universal Separate Window MT5 works according to your rules. It is sufficient to introduce a formula, along which the line of the indicator will be drawn.
This indicator is intended for use in the separate chart window.
All indicators of the series Universal :
Main window Separate window Free MT4 Universal Main Window Free MT5 Universal Main Window Free MT5 MT4 Universal Separate Window Free MT5 Universal Separate Window Free MT5 Full MT4 Universal Main Window MT5 Universal Ma

The indicator Universal Main Window MT5 works according to your rules. It is sufficient to introduce a formula, along which the line of the indicator will be drawn.
This indicator is intended for use in the main chart window.
All indicators of the series Universal :
Main window Separate window Free MT4 Universal Main Window Free MT5 Universal Main Window Free MT5 MT4 Universal Separate Window Free MT5 Universal Separate Window Free MT5 Full MT4 Universal Main Window MT5 Universal Main Windo

Советник FX Ilan Plus -это аналог советника, с добавлением множества дополнительных логик и возможностей для торговли, с оставленными настройками советника . Советник торгует по системе Мартингейл с увеличением последующих лотов в серии ордеров, с целью их усреднения. Первый ордер робот выставляет по сигналам встроенного индикатора. Так же советник имеет возможность прекращать торговлю в зависимости от новостей. FX Ilan Plus можно использовать либо на одном графике, либо на двух графиках в проти

The indicator identifies divergences between chart and RSI, with the possibility of confirmation by stochastics or MACD. A divergence line with an arrow appears on the chart when divergence is detected after the current candle has expired. There are various filter parameters that increase the accuracy of the signals. To identify a divergence, point A must be set in the RSI, then point B Value must be edited, which sets the difference between point A and point B. The indicator can be used for tim

This is a multi-currency paired trading system.I won't go into the details of how it works, but what the user needs to care about is how it actually works. It is highly recommended that you download the product and test it thoroughly, including back testing with the historical data and foward testing in the simulated account. As this EA trades multiple currency pairs, relevant historical data will be automatically downloaded at the first time of its historical review, with data volume around 6GB

Telegram ChartSnap MT5 is an utility tool to bridge your MetaTrader 5 activities to your Telegram chat/group/channel. It will screen shot your MetaTrader 5 chart and send it to your dedicated Telegram chat/group/channel through a Telegram bot. The whole process will keep repeating based on a time cycle that predetermined by the user. It is a convenient tool for those who like to get access to their favorite system/dashboard that only available at MetaTrader Desktop. Beside that, trader can eas

"Just copier" is designed to copy trading without any complicated settings. The copy can be done in one PC. One EA can be set as master (provider) or slave (receiver). The receiver lot can be set to multiple providers lots. Please also check this product at fxina.hostingerapp.com. Any type of copy is available. MT4 -> MT5 MT4 -> MT4 MT5 -> MT5 MT5 -> MT4 If you want to copy MT4 -> MT5 or MT5 -> MT4, please purchase "Just copier" for MT4 and "Just copier" for MT5 separately. Just Copier can copy

This QuickClose help you to close all orders having profit immediately with only ONE CLICK, its work is very fast. You can choose which symbol you want or close all symbols so it will helpful for you in your trading to manage trading faster. This EA can quick close all Buy and Sell Orders by a selected symbol or total, And delete all pending orders. This SymbolButton is designed for closing orders. There is available Manual and Automatic closing functions. Automatic closing function will close t

Exit based Indicator - What is it? Exit your open positions based on up to 10 indicators. Even those you buy in Market !!! Use any indicator that provides buffer values (most of them output buffers). You can use any available buffers and even compare various indicator values. Selectors for exiting Buy Positions and Sell Positions are separate. The EA works in AND or OR mode. You can combine multiple instances to create elaborate rules. NO BROKER SIDE STOP LOSS IS USED.
Usage Ideas / Examples -

Telegram Notify MT5
Telegram Notify MT5 is an utility tool to bridge your MetaTrader 5 activities to your Telegram chat/channel. It is useful for monitoring your MetaTrader 5 account by sending a notification to your particular Telegram chat/channel when someone/EA is placing trades, modifying order's TP/SL, closing trades and etc. This EA does not place any trade for your account. This EA also could be a convenient tool for monitoring other's EA trading activities or a tool for publishing you

This version of the AshiMomentum multicurrency Expert Advisor works based on short-term changes in the trend, creating the price "corridor" set in the parameters. Trading is carried out at the external borders of this corridor by opening positions in different directions with different lot sizes. This achieves a very high probability of closing positions in profit.
AshiMomentum is intended for trading any currency pair on the M1 timeframe or higher.
No martingale, no arbitrage.

The indicator shows supply and demand degenerated through tick volume.
The red line is the supply line.
The blue line is the demand line.
The green line is the total volume line.
Typical situations of indicator readings:
red is higher than blue - supply is higher than demand - the price is falling. blue is higher than red - demand is higher than supply - the price is growing. the red and blue lines tend to go down, but the blue is above the red - demand prevails, the price rises, but
Probability Indicator displays volatility bands on the price chart and calculates probabilities of price exceeding specified levels for the next bar, taking trend into account. It does that by performing a statistical analysis of the completed bars in the chart's history, which may include years of data. The volatility bands differ from Bollinger bands in the calculation of standard deviation from the simple moving average, resulting in bands that envelop the range of price swings in a channel t

Follow the STOCKS SQUEEER Signal: https://www.mql5.com/en/signals/503024
STOCKS SQUEEZER is trading system that simultaneously operates on several stocks trying to take advantage of their volatility. The EA opens a position on each stocks specified investing the initial amount of money you have set. The single position is closes it when the calculated take profit is hit. Instead, if the market goes against, the position is increased and the take profit moved properly. This goes on for a str
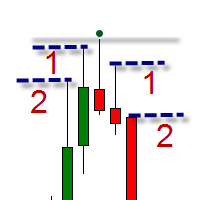
The indicator is intended for swing trading. The indicator is able to determine the trend and important trend peaks (swing), which will be important support / resistance levels. Features Simple visual displaying of 3 types of swings: Minor swings - do not affect the trend, but only on the movement within the trend Normal swings - can change the direction of the trend Strong swings - have a double confirmation of the importance of the level Visual displaying of the trend reversal Minimum of se

Trading robot X Forts
The scalper Forts EA is designed for futures trading on the Russian futures futures market (RTS, Sberbank, Gazprom, Ruble, etc.).
The main instruments are futures on the RTS, SBRF index. Recommended timeframes M1-M6.
The EA does not use averaging. Each trade has its own stop loss.
The size of the required GO for tests and trading on the selected instrument is taken from the instrument code.
Trading robot settings SL - stop loss Lots - lot for trading Pos_Market -

Панель предназначена для быстрого визуального нахождения и отображения пин-баров по всем периодам и на любых выбранных валютных парах одновременно. Цвет сигнальных кнопок, указывает на направление пин-бара. По клику на сигнальную кнопку, осуществляется открытие графика с данным паттерном. Отключить не используемые периоды, можно кликом по его заголовку. Имеется поиск в истории (по предыдущим барам). Прокрутка (scrolling) панели, осуществляется клавишами "UP" "DOWN" на клавиатуре. Имеется Push-ув
Main: Not martingale, not a grid, working on all symbols; a good rational algorithm; Work of two indicators: RSI (from older timeframe - it works as a signal filter) and RSI (from junior timeframe - it works as a signal) ; There is a good money management system (there are several type for trailing stop loss); EA can work on closed candles, and on current candles; Quickly optimized (the work is maximally accelerated). Current sets after optimization are in comments.
If you want to do optimizat

Advanced MA Crossover Alert System The FX AlgoTrader Advanced Moving Average Crossover Alert System is a highly configurable MT5 indicator which incorporates a fully automated alert system for monitoring two trader defined moving averages. The indicator is designed to alert traders when two moving averages crossover. The trader has a wide range of control over how the MA Crossover alerts are generated which is detailed below. Key Features Automatic display of trader defined fast and slow movin

Velox indicator
Velox is a indicator that shows the tendency, force and direction of price based on the fractal 5-3.
Negotiation strategy Composed of 6 lines that oscillate above and below axis 0. Each line represents a fractal that is calibrated by Phi³. To identify a bullish trend, all rows must be above zero. Already a downtrend, all rows should be below zero.
Indicator Parameters: Period - Number of bars for indicator calculations. The user can select the shortest, medium and longest p

MathScalperPro FORTS
MathScalperPro FORTS this is an automatic trend trading system based on unique mathematical calculations. The Advisor calculates the trading levels of price corrections and enters the transaction in the direction of the trend. Inputs on levels are possible in two ways. The first way is to enter the candlestick pattern 1-2-3, and the second way is to enter the change of direction of trade in the younger period.
Terms for trade: Does not use hedging, martingale, grid or o
MetaTraderマーケットは、履歴データを使ったテストと最適化のための無料のデモ自動売買ロボットをダウンロードできる唯一のストアです。
アプリ概要と他のカスタマーからのレビューをご覧になり、ターミナルにダウンロードし、購入する前に自動売買ロボットをテストしてください。完全に無料でアプリをテストできるのはMetaTraderマーケットだけです。
取引の機会を逃しています。
- 無料取引アプリ
- 8千を超えるシグナルをコピー
- 金融ニュースで金融マーケットを探索
新規登録
ログイン