YouTubeにあるマーケットチュートリアルビデオをご覧ください
ロボットや指標を購入する
仮想ホスティングで
EAを実行
EAを実行
ロボットや指標を購入前にテストする
マーケットで収入を得る
販売のためにプロダクトをプレゼンテーションする方法
MetaTrader 5のための新しいエキスパートアドバイザーとインディケータ - 168

İlk süreç, pazarın yorgunluk semptomlarını bolinger bandı ve hareketli ortalama göstergeleri ile tespit etmekle başlar. İşlem beklendiği gibi gitmezse, ikinci işlem başlar. İşlemi Avrupa ve ABD oturumları için makul bir kar veya zararla kapatır. eurusd 1 saat kullanılır. Ayda 3 veya 4
Sihirli numara = sihirli sayı inp1_TimeStart = Zaman Başlangıcı inp1_TimeEnd = Zaman Sonu inp5_VolumePercent = Birim Yüzde Satın Al inp11_mmMgInitialLots = mm MgInitia lLots satın al inp11_mmMgMultiplyOnLoss

Using the basic principles that allow scientists to report a tsunami a few minutes before it happens (tested during a period of almost 10 years), we have designed an algorithm able to perceive its wave length, amplitude, height, rate, period and acceleration.
This allows our Expert Advisor (EA) to make transactions or to send automatic signals for up to 5 currency pairs (EUR/USD, USD/CHF, AUD/USD, USD/CAD, USD/MXN). In other words, our algorithm identifies the main trend through the result

Indicador multi-nivel y multi-timeframe que permite seguir la tendencia del precio de cualquier par de divisas, metales, acciones, CFD's, etc. Intuitivo y fácil de aplicar sobre cualquier gráfico.
Parámetros: Timeframe : Marco de tiempo que se le aplicará al nivel Period : Periodo que se aplicará Applied Price : Precio a aplicar
Aplicaciones: Se puede usar aplicando diferentes niveles sobre el mismo gráfico, por ejemplo, in nivel de 8, 14, 20, etc.

このスクリプトは、乱数ジェネレータを使用した貿易取引のシミュレーションに基づいています。これにより、同じ入力パラメータでもまったく異なる結果を得ることができます。スクリプトを実行すると、ダイアログボックスが開き、そこで外部変数に必要な値を設定できます。 ブロックでは、TradingOptionsは取引のシミュレーションに必要な基本パラメータを定義します。 StartBalance - トレードバランスの初期サイズを設定します。 NumberTrade - スクリプトの実行時にモデル化される取引トランザクションの数を設定します。多かれ少なかれ有意な結果を得るためには、このパラメータが30より大きいことが必要です。 ProbilityWinning - 勝ち取引の確率。パーセンテージで示され、1から99までの有効値。 Min.StopLoss - StopLossの最小値をポイントで示します。これは、取引操作をモデル化するときに使用されます。 Max.StopLoss - StopLossの最大値をポイント単位で設定します。 PositiveWin - この変数
FREE
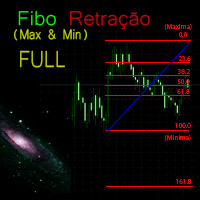
Functional in the Forex market. Functional in the B3 market - Bolsa Brasil Balcão.
Motivation The technical indicator of Fibonacci retraction for many is essential and the basis for all forecasts of market movements. The name of the tool comes from the Italian mathematician Leonardo de Pisa (13th century). This FULL version will work in Meta Trader 5 on any type of account.
This FULL version will work in Meta Trader 5 on any type of account.
To test on the DEMO account, download the free

Functional in the Forex market. Functional in the B3 market - Bolsa Brasil Balcão.
Motivation The technical Fibonacci retraction indicator for many is essential and the basis for all market movement forecasts. The name of the tool comes from the Italian mathematician Leonardo de Pisa (13th century).
This DEMO version will work in Meta Trader with Demo and Strategy Tester.
To purchase the Full version that works on a Real account, click on: https://www.mql5.com/en/market/product/38089
FREE

New Candle Alert is a simple indicator that notify you when a new candle is formed. Func tions : Alert type - option to choose between message with sound or only sound. Message - alert message. Push notifications - enable push notifications. Show timeframe - show the symbol timeframe. Show hour - show the alarm time. Test message - if you don't want to wait a new candle formed to see the message. MT4 version: https://www.mql5.com/pt/market/product/37988 Hope you enjoy it. Any doubt or su
FREE
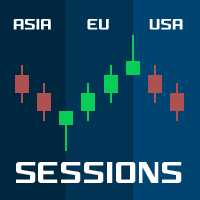
Sessions PRO is a perfect tool which divide your chart screen by 3 main market sessions: 1> asian 2> european (with division for Frankfurt and London start) 3> american
Sessions PRO is perfect especially for trading indices, where main pivot points often occurs along with new market center enters the market. With Sessions PRO you see what events happened at their exact corresponding time - European and American moves and pivot points are much more important than asian. Stop analyzing your

this indicator very simple and easy if you understand and agree with setup and rule basic teknical sba you can cek in link : please cek my youtube channel for detail chanel :
an for detail info contact me basicly setup buy (long) for this indicator is Magenta- blue and green candle or magenta - green and green candlestik and for setup sell (short) is Black - yellow - and red candle or black - red and red candlestik

頭と肩のパターンは、3つのピークを持つベースラインに似たチャート構成であり、外側の2つは高さが近く、中央は最高です。強気から弱気のトレンド反転を予測し、最も信頼性の高いトレンド反転パターンの1つと考えられています。これは、トレンドが終わりに近づいていることをさまざまな精度で知らせるいくつかのトップパターンの1つです。 [ インストールガイド | 更新ガイド | トラブルシューティング | よくある質問 | すべての製品 ] クリアな取引シグナル カスタマイズ可能な色とサイズ パフォーマンス統計を実装します カスタマイズ可能なフィボナッチリトレースメントレベル 適切なストップロスおよび利益レベルを表示します
インジケーターを使用して、継続パターンまたは反転パターンを見つけることができます 再描画および非再描画ではありません 電子メール/音声/視覚アラートを実装します
設定 チャートにインジケーターをロードすると、入力パラメーターとして一連のオプションが表示されます。パラメーターが自明のブロックにグループ化されているため、それらが多すぎると思う場合でも、絶望しないでください。これは

The Levels indicator has been created to simplify the process of plotting support and resistance levels and zones on selected timeframes. The indicator plots the nearest levels of the selected timeframes, which are highlighted in different colors. It significantly reduces the time needed to plot them on the chart and simplifies the market analysis process. Horizontal support and resistance levels are used to identify price zones where the market movement can slow down or a price reversal is like

The EA uses a reverse strategy. To detect trading signals, the following indicators are used: Moving Average, Relative Vigor Index, Average True Range, Alligator and other custom indicators . Each pair has a stop loss, take profit, breakeven and trailing stop. The EA trades on many major currency pairs and timeframes. The EA uses timeframes: MetaTrader 4 MetaTrader 5 M1, M5, M15, M30, H1 M1, M2, M3, M4, M5, M10, M12 , M15, M20, M30, H1 , H2 Real monitoring 1 : https://www

Candle cross MA is an indicator that works "silently", that is, drawing only a moving average on the chart.
It alerts you when the last candle cross with a moving average that you set. Alert is given only when the candle closes.
The moving average settings are fully customizable.
The indicator sends popup, and push notifications. You can also deactivate alerts when the chart is inactive. Are you the trend type? Do not miss another opportunity!
FREE

Trend Scanner is a trend indicator that helps to determine the current and forecast market direction using an advanced algorithm. Thanks to flexible alert settings, the indicator will promptly warn you about a trend reversal. The indicator is intuitive and easy to use, and will be an excellent filter in your trending trading strategies. The lines of this indicator are also an excellent dynamic level for stop loss, and is used as one of the types of trailing stop in Trading Panel . To fine-tune t

iVolX indicator horizontal volumes for all time periods
Main settings of the indicator: VolumeSource - select data for volumes (tick or real) PeriodMinutes - selection period for rendering of volumes PeriodsNumber - number of periods to show on the chart StartDate - the start date of the calculations ClusterPoints - cluster width Color - color MaxVolColor - maximum volume color ValueArea - the value of the zone of balance ValueAreaColor - color of the balance zone MaxVolFontSize - font size Ma

This Utility tells you the volatility of any symbol for any of the major time frames. As trades occur, the volume increases for each period. When each period ends, the bucket is reset to 0. Volumes are sorted from largest to smallest within each shown period. Click any symbol to highlight that symbol in all period columns. Volume information is specific to transactions placed at your broker. To test in the Tester, set the following:
EURUSD,M1,1 minute OHLC 2018.01.01 to 2018.01.02 (a day’s wort
FREE

Индикатор, показывающий момент преодоления нулевой отметки индикатора MACD. Подходит для бинарной торговли, т.к. имеется возможность посчитать точность сигналов, в зависимости от времени экспирации.
Входные параметры Period of SMA1 - Период 1 скользящей средней Period of SMA2 - Период 2 скользящей средней Period of SMA3 - Период 3 скользящей средней Price Type - Тип цены, используемый индикатором MACD Invert signals - Возможность давать инвертированные сигналы (для работы по тренду) Infor
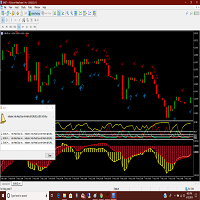
Adx and Macd are powerful indicators which can warn you of a change of direction. Put them together with this great indicator that will warn you of impending changes long before any ma lines cross. More screen shots on the MT4 version. Arrow indicates a solid macd cross and the check marks show the adx movements. You can trade the long term with the macd crosse and scalp the adx changes while you hold the main trend. Thanks for checking out my indicators.
This indicator implements the High Low Volatility Estimator based on Advances in Financial Machine Learning 2018 - Marcos Lopez de Prado, page 284. It's a robust estimator using High/Low values from past bars (configurable). It's robusto to Gaps (open/close of days to stock markets) since it's using high/low ration and not the close price. It's interesting when you need to avoid trading at a specific level of volatility
This indicator implements the Rool Model Estimator based on Advances in Financial Machine Learning 2018 - Marcos Lopez de Prado, page 283. It's a spread estimator using trade by trade (copytick) values from last trades (configurable). It works with low liquidity markets as a robust estimator considering the covariance between price diferences. It's interesting when you need to track spread changes
This indicator implements the Corwin and Schultz Estimator based on Advances in Financial Machine Learning 2018 - Marcos Lopez de Prado, page 284. It's a spread estimator using high/low and a rolling window (configurable). It works with low liquidity markets as a robust estimator. It's interesting when you need to track spread changes, more information can be found at Marcos book.

In Kyle’s model, the variable captures price impact. Illiquidity increases with uncertainty about v and decreases with the amount of noise Kyle argues that the market maker must find an equilibrium between profit maximization and market efficiency. This indicator is based on Advances in Financial Machine Learning 2018 - Marcos Lopez de Prado book, Page 288.
Amihud studies the positive relationship between absolute returns and illiquidity. In particular, he computes the daily price response associated with one dollar of trading volume, and argues its value is a proxy of price impact. Despite its apparent simplicity, Hasbrouck [2009] found that daily Amihud’s lambda estimates exhibit a high rank correlation to intraday estimates of effective spread. This indicator is based on Advances in Financial Machine Learning 2018 - Marcos Lopez de Prado book,

Hasbrouck follows up on Kyle’s and Amihud’s ideas, and applies them to estimating the price impact coefficient based on trade-and-quote (TAQ) data. Consistent with most of the literature, Hasbrouck recommends 5-minute time-bars for sampling ticks. This indicator is based on Advances in Financial Machine Learning 2018 - Marcos Lopez de Prado book, Page 289. --- This code can run slow when using big timeframes, it use copytick to get dollar volume, in a next version I will implement a temporary i
Easley et al. [2011] proposed a high-frequency estimate of PIN, which they named volume-synchronized probability of informed trading (VPIN). This procedure adopts a volume clock, which synchronizes the data sampling with market activity. For additional details and case studies of VPIN, see Easley et al. [2013]. A number of studies have found that VPIN indeed has predictive power: Abad and Yague [2012], Bethel et al. [2012], Cheung et al. [2015], Kim et al. [2014], Song et al. [2014], Van Ness et
Easley et al. study the frequency of trades per trade size, and find that trades with round sizes are abnormally frequent. For example, the frequency rates quickly decay as a function of trade size, with the exception of round trade sizes {5, 10, 20, 25, 50, 100, 200,…}.
These authors attribute this phenomenon to socalled “mouse” or “GUI” traders, that is, human traders who send orders by clicking buttons on a GUI (Graphical User Interface).
In the case of the E-mini S&P 500, for example, si

A useful feature may be to determine the normal frequency of round-sized trades, and monitor deviations from that expected value. The ML algorithm could, for example, determine if a larger-than-usual proportion of round-sized trades is associated with trends, as human traders tend to bet with a fundamental view, belief, or conviction. Conversely, a lower-than-usual proportion of round-sized trades may increase the likelihood that prices will move sideways, as silicon traders do not typically hol

Over 100,000 users on MT4 and MT5 Blahtech Candle Timer displays the remaining time before the current bar closes and a new bar forms. It can be used for time management Links [ Install | Update | Training ] Feature Highlights
The only candle timer on MT5 with no stutter and no lag S electable Location Tracks server time not local time Multiple colour Schemes Configurable Text Customisable alerts and messages Optimised to reduce CPU usage Input Parameters Text Location - Beside / Upper L
FREE

プレミアムレベルは、正しい予測の精度が80%を超える独自の指標です。
この指標は、最高のトレーディングスペシャリストによって2か月以上テストされています。
あなたが他のどこにも見つけられない作者の指標!
スクリーンショットから、このツールの正確さを自分で確認できます。
1は、1キャンドルの有効期限を持つバイナリーオプションの取引に最適です。
2はすべての通貨ペア、株式、商品、暗号通貨で機能します
手順:
赤い矢印が表示されたらすぐにダウントレードを開き、青い矢印が表示されたら閉じます。青い矢印の後に開くこともできます。
試してテストしてください!推奨設定はデフォルトです!
日足チャートで最高の精度を示します!
インディケータは、2600 Pipsの収益性に対して、約10Pipsという非常に小さなマージンを使用します。

ZhiBiSmartは、あらゆる市場のあらゆるチャートサイクルに適しています。トレンドバックコールを使用してバウンスバンドを作成します。これにより、バンドとトレンドの予測が向上します。 注文を購入する:緑色の上向き矢印の付いたマーク。 閉じるを購入する:緑色の十字マークが表示されます。 注文を売る:黄色い下向き矢印のついた印。 クローズを売る:黄色の十字マーク。 パラメータ設定: [TrendPeriod]:トレンドラインの期間。 [SignalPeriod]:信号線の周期。 [TrendSpread]:最終的に決定されたトレンドラインの広がり。 [Alert_No_Off]:ポップアップメッセージを開くか閉じる。 true =オン、false =オフ。 [SendMail_No_Off]:メールを送信するかどうか。 true =オン、false =オフ。 [SendNotification_No_Off]:メッセージは携帯端末にオンまたはオフにプッシュされる。 true =オン、false =オフ。 [UpArrowMessage]:上向き矢印が表示されたときに送信されるメッセージの

ZigZag with backlight Fibonacci levels. The indicator has the ability to set any number of levels, the signals of the intersection of which can be sent to your mobile device email, as well as viewed via alerts. The indicator is designed to perform wave analysis, search for harmonic petterns, as well as search for other technical analysis figures. This Zigzag uses the principle of constructing extrema in which any trader will understand very easily. First, the indicator finds the upper and lower

MeetAlgo Gold Albatross EA MT4 is a pure mathematical scalper that trades tick data aggressively. It implements a simple and universal trading strategy which can be applied to any instrument.
Key Advantages Fully automated trading 24/5. No need in a large initial deposit. Always uses Stop Loss to protect capital. Position trailing stop is used. Both a fixed lot and a free margin percentage are used. Ability to set time limitations for the EA operation.
Trading Requirements
Caution is advis
FREE

Revolution Martingale is an indicator designed for trading binary options on the M5 timeframe. Features: M5 Timeframe: It is recommended to use the indicator on the M5 timeframe for optimal trading. Trade Opening: Trades should only be opened when a signal appears on the 1st candle after opening and signal appearance. Signals: A blue rhombus indicates a potential upward purchase opportunity, while a red rhombus indicates a potential downward option purchase opportunity. Configured for Effective
FREE

Wyckoff fans, enjoy!
Ideally to be used with the Weis Waves indicator, but it can be easily used alone, the Waves Sizer puts the range (in resulting Price movement) done by the Price on its market swings. You can control how accurate or loose will be the swings. This tool is very helpful for visually know how much the Price has traveled in your Timeframe. This way you can confront this level of effort with the resulting Volume, etc... Weis Waves indicator:
https://www.mql5.com/en/market/pro
FREE

Crypto Trend Finder follow trend. Color change trend changed. Works in BTCUSD/BABUSD/BSVUSD/ETHUSD/ETCUSD/BTGUSD/DSHUSD/ZECUSD/IOTUSD/XRPUSD and all crypto pairs
Best timeframes 15M/30M/1H/4H/DAILY Note : Not use 1M/5M
Signal on close of a bar. DOES NOT repaint. DOES NOT repaint. DOES NOT repaint. DOES NOT repaint.
DOES NOT recalculate. DOES NOT recalculate. DOES NOT recalculate. DOES NOT recalculate Settings : No Settings, change color

Hunter Trend: Arrow Indicator for Binary Options Trading Hunter Trend is an arrow indicator designed for trading binary options (turbo options) on the M1 timeframe, allowing for short-term trading opportunities. How to Trade with this Tool: Signals may appear when a candlestick forms. Once such a signal appears, wait for the closure of that candlestick. Upon the opening of a new candlestick, open a trade for 1-2 candlesticks in the indicated direction. In this case, for 1-2 minutes. A blue dot

The indicator compares quotes of a given symbol and a synthetic quote calculated from two specified referential symbols. The indicator is useful for checking Forex symbol behavior via corresponding stock indices and detecting their convergence/divergence which can forecast future price movements. The main idea is that all stock indices are quoted in particular currencies and therefore demonstrate correlation with Forex pairs where these currencies are used. When market makers decide to "buy" one

Sensey Candlestick Pattern Recognition Indicator Sensey is an advanced tool capable of accurately identifying candlestick patterns. Not only does it recognize patterns, but it also detects price highs and lows within a specified time frame. Sensey operates seamlessly across multiple timeframes and is compatible with all currency pairs, futures, and commodities. Unlike some indicators, Sensey does not repaint historical data, ensuring reliable analysis even in cryptocurrency markets. You can wit

Sniper Trend Finder follow trend. Color change trend changed.
Works in EURUSD/GBPUSD/XAUUSD/USOIL/US500/USDJPY/USDCAD/JP225/USDTRY/USDMXN and all pairs
Best timeframes 5M/15M/1H/4H/DAILY
Signal on close of a bar.
DOES NOT repaint. DOES NOT repaint. DOES NOT repaint. DOES NOT repaint.
DOES NOT recalculate. DOES NOT recalculate. DOES NOT recalculate. DOES NOT recalculate Settings No Settings, change color

[ZhiBiDW Trend]は、トレンドとショックのシンプルで直感的で効果的な指標です。 これは、15分以上4時間未満のチャート期間に適しており、すべての市場の種類に適しています。
買いシグナル:青い上向き矢印が表示され、その矢印にストップロスとテイクプロフィットのプリセット価格が表示されます。
売りシグナル:赤の下向き矢印が表示され、矢印がストップロスとテイクプロフィットのプリセット価格と共に表示されます。
パラメータ設定の説明
[Send_Alert]:これはアラームスイッチで、trueに設定されていて、矢印が表示されていれば自動的にプロンプトに警告し、falseに設定されていれば警告しません。 [Send_Email]:これはメールを送信するためのスイッチで、trueに設定します。矢印が表示されればMT4で設定したメールボックスにメールを送信し、falseに設定されたらメールを送信しません。 [Send_Notification]:インスタントメッセージを送信するためのスイッチで、trueに設定します矢印が表示されている場合はモバイルデバイスにメッセージを送信し
FREE

The initial price is 89 USD, the future price is 200 USD
Trading is carried out by market orders from important price levels, which are determined by an advanced adaptive algorithm EA . the Algorithm allows you to determine the dynamic levels of price changes, which gives the EA the ability to quickly find entry points. The EA determines the short-term trend and opens a position with a subsequent partial closure, the average position is open for several hours. The EA trades many major curre

Description: The Volume Profile displays detailed informations of historical trading activities at certain price levels (Market Profile). Locate the areas with the best prices in the market and get an advantage over other market participants.
Features: Customizable Market Profile Shows the "fair" Value Area with 70% of all Volume
Shows critical low volume zones
Shows VPOC, VAL and VAH Points integrated resource management to reduce the load while working with multiple charts Works on all tim

This EA has built-in trend acceleration indicator to check the trends before performing any trading action. It's engine is provided with: trailing Stop Loss; bad time to trade filter for each day of the week; enable and disable martingale mode; define the maximum spread value to trade; define the minimum equity percentage to allow trading; the input values are already optimized for EURUSD at timeframe M1. The Strategy This Expert Advisor uses built-in trend acceleration indicator where you can s

Robonacci Universal is designed to trade any markets (Stocks, Forex, Commodities, Futures, Cryptos). The strategies are developed based on various Price Actions that will be observed on different Fibonacci Retracement levels. Product Home Page: https://www.mql5.com/en/market/product/36095
ADVANTAGES:
Works on any market and time frames Multiple Strategies in 4 categories: Retracement, Breakout, Trend Follow, Reversal Trades simultaneously on any number of markets under the same account Di

This is a cluster expert adviser. It allows for trading an arbitrary set of instruments, which may include Forex currencies, indices, goods, stocks, etc. It's based on algorithm used by SuperIndices indicator (the indicator itself is not required, but can be useful for visual analysis). The trading strategy is to buy assets in upper part of the indicator and sell assets in lower part. You can choose the signal strength for entering and exiting the market. If the signal becomes stronger by predef

AutoBuy - is a script place pending buy stop orders with automatic calculation of the volume (number of shares) depending on the risk of money on the deal. Inputs: Risk - number in USD of money put on the trade.
BuyHighStep - the number of USD, a step up from the rates High of the current candle (bar) stock up to buy. Minimum value is 0.01
StopLossStep - the number in USD, the step from the price of the buy stop order down to close the deal at a loss. The minimum value of 0.10
TakeProfitStep

Индикатор, показывающий момент преодоления нулевой отметки индикатора MACD. Индикатор стрелочный и может быть использован для торговли бинарными опционами.
Входные параметры Period of SMA1 - Период 1 скользящей средней Period of SMA2 - Период 2 скользящей средней Period of SMA3 - Период 3 скользящей средней Inform about finding the signal - подавать уведомление, при нахождении сигнала
FREE

This indicator would help you I DENTIFY different HORIZONTAL SUPPORT / RESISTANCE LEVELS AND TRENDLINES.
ADVANTAGES: Use up till 5 different levels of Support and Resistance Use up till 5 different trend lines Use true/false options to display for Support/Resistance or Trend line Image
PARAMETERS: nPeriod: the time period to decide
Limits: the candles limit to look back
UseHorizontalLines: true/false option to display Horizontal Support and Resistance Lines UseTrendline: true/false opti

The Quantum GBPX is the latest addition to our suite of currency indices, and one which we have been asked for many times, and even more so since Brexit. It is an index which has taken us some time to develop, and through a series of complex calculations draws its primary data from a basket of currencies based on the old style dollar index, the Dixie. This is converted to a chart for the British pound. The result is an accurate index which describes strength and weakness for the GBP currency in
このEAは、市場が秩序正しく予測可能な方法で動作している場合に、変動期間のテストされていないブレークアウトを取引します。これは短期取引に向けられており、市場が以前にテストされていない価格レベルに達するとボラティリティが桁違いに増加するという事実に依存しており、時間切れに基づいて迅速な利益またはわずかな損失を可能にします。 EAは整然とした市場でうまく機能し、非常に短い時間枠またはわずかに取引された商品で苦しみます。 [ インストールガイド | 更新ガイド | トラブルシューティング | よくある質問 | すべての製品 ] ストップロスとテイクプロフィットのレベルは自動的に設定されます
平均化、グリッド、ヘッジ、マーチンゲールなし 注文は金曜日の夜に閉じられます
NFA-FIFO準拠
セットファイル EURUSD( D1 / H12 / H8 / H6 / H4 / H3 / H2 / H1 ) GBPUSD( D1 / H12 / H8 / H6 / H4 / H3 / H2 )
USDJPY( D1 / H12 / H8 / H6 / H4 / H3 / H2 ) X

エグジットエリアアルティメットは、 チャート上に毎日の 平均トゥルーレンジ(ATR) と 平均日次レート(ADR) のレベルを示すことにより、取引の意思決定を強化するように設計されたテクニカル指標です。これらのレベルを理解することで、トレーダーは 1 日を通しての資産の平均的な動きを簡単に評価できます。この多用途のインジケーターは、デイトレーダーにとってさまざまな目的に役立ち、注文の発注を支援し、日中の傾向を特定し、トレーリングストップロスレベルを設定し、毎日のテイクプロフィットレベルを確立します。 この指標の重要な特徴の 1 つは、市場のボラティリティと価格帯に関する貴重な洞察を提供する ATR 指標と ADR 指標への依存です。トレーダーはこの情報を使用して適切なテイクプロフィットとストップロスのレベルを決定し、リスク管理戦略を最適化できます。このインジケーターは、表示されたレベルに基づいて残りのピップも計算するため、潜在的な利益または損失を迅速に評価できます。 Exit Area Ultimate はあらゆるシンボルと互換性があり、トレーダーは幅広い資産に適用できます。さらに、各

Highly configurable Bollinger Bands indicator. Features: Highly customizable alert functions (at levels, crosses, direction changes via email, push, sound, popup) Multi timeframe ability Color customization (at levels, crosses, direction changes) Linear interpolation option Works on strategy tester in multi timeframe mode (at weekend without ticks also) Parameters:
Bollinger Bands Timeframe: You can set the lower/higher timeframes for Bollinger Bands. Bollinger Bands Bar Shift: Y ou can set t
FREE

Cointegration Pair Trading Indicator
Indicator for statistical and quantitative pair trading strategies. You can perform Long&Short or Long&Long/Short&Short between two different assets.
The indicator performs a series of statistical tests between the assets and shows whether the pair is cointegrated or not.
Suggested Usage Strategies
(a) Verify if that the pair is cointegrated by the ADF test (Augmented Dickey-Fuller Test). 0% means the pair is not cointegrated; 90% 95% 97.5% and 99% means

I present to your attention experimentally, a new EA that forms the trading range of the time interval. The EA has built-in proprietary algorithms for transaction support.
The emerging range is set manually by the EA settings, such ranges can be set up to two pieces. After a specified time and capture the trading range, the EA starts its work. When the price goes beyond the limits of this range, the EA opens an order with market execution, accompanying the transaction, placing Take profit and

Forex Relative Performance indicator This indicator calculates the relative strength of major currencies against the US dollar. The basic idea behind this indicator is "to buy strong currency and to sell weak currency". This indicator allows you to quickly identify the best forex pair to trade according to your trading style (Intraday, Scalping, Swing, or Long Term)

This indicator get all events/countries/values from metatrader terminal calendar and print veritical lines at chart, you can configure anything with inputs (string to filter names/url/code/countries/currencies), select period to filter, nws interval before and after current time (every information about time is seconds based), you can filter importance, type, sector, unit, multiplier, impact, timemode, frequency, forecast/previous % increase/decrease interval, actual/previous % increase/decrease
FREE
The Profit30 for MT5 platform( Also Available for MT4 in Mql5 Market Place) Expert Adviser, uses 7 different 'price action style' system on the EURUSD pair, on the M5, M15, M30, H1 timeframes.Best optimized perform in H1 chart
The EURUSD pair offers in general the best performance in the major part of the Profit30 EAs. In this EA, a selection of Profit30 systems has been rewritten and configured explicitly for get the best performance in the EURUSD pair. The EURUSD pair offers in general the

The latest most requested Binary Options arrow indicator in the Garuda Signals product line is now on MT5! Binary options signal based on multiple time frame cross over analysis. Gets confirmation from the most consistent signals known to man; Ichimoku, SMA, Bollinger Bands; and also uses the 1 Hour time frame as trend confirmation , so you don't have to open up multiple chart and waste time. - Can be used for all time frames up to 1 hour, but is most POWERFUL for 1 and 5 min options. - Place yo

これはMetaTrader 5のためのあなたの取引口座の分析を提供する統計パネルです。 分析結果はリアルタイムでチャートに表示されます。 多通貨取引は非常に人気があります。 MT4のバージョン
完全な説明 購入する方法
インストールする方法
ログファイルの取得方法 テストと最適化の方法 Expforex のすべての製品 しかし、取引量が多ければ多いほど、それぞれの取引の収益性を分析するのは難しくなる。 月ごとに取引を分析し、各取引ごとに統計を計算することは、さらに困難な作業です。 取引システムのパフォーマンスを包括的に理解したい場合、この目標を達成するのに役立つツールが複数あります。 これらのツールには、レポート、統計、myfxbook、取引ジャーナル、口座分析、パフォーマンス統計、分析、革新的なダッシュボードなどがあります。 これらのツールを活用することで、取引システムのパフォーマンスを詳細に分析し、得意分野や潜在的な弱点に関する貴重な洞察を得ることができます。 パフォーマンス向上を目指す新規トレーダーであれ、取引戦略の最適化を目指す経験豊富なト
FREE

Nightsnipermt5は、ナイトスキャルピングのための完全自動マルチ通貨取引システムです。 特徴 EAは28の主要なメジャーと十字架、金、銀で取引します。 顧問は危険な技術を使用しません Expert Advisorは、理解のために利用可能な入力パラメータの最小数を使用します アドバイザーは、ブローカーからのすべての注文に対して、固定および非表示のストップロスとテイク利益を設定します EAは、その注文を識別するために魔法の数の魔法を使用しています 推奨事項 狭いスプレッドと注文の迅速な実行を持つ任意のブローカーは、取引に適しています 最低推奨預金は1 100です チャートにExpert Advisorをインストールするだけで十分です パラメータ Magic-マジックナンバー ロット-注文数量 TradeMode-現在のチャート上のみ、またはすべてのシンボルの単一のチャートからの取引モード Symbols-このリストからのすべてのシンボルのシングルチャートモードでの取引のためのシンボルのリスト
Expert Advisorはスプレッドと実行速度に敏感であるため、エキスパート
EAは急激な価格変動に対応しており、オープンポジションのロックとピラミッドを使用できます。仮想ストップが使用され(利益を得る、トレーリングストップ)、注文ロックと残高の%でのストップロスが損失を制限するために使用されます。同時に数十の注文を開くことができ、アドバイザーはロックから抜け出し、総利益に基づいてすべてのポジションを閉じるために無料の資金を必要とします。これは取引する商品の数を選択するときに考慮に入れる必要があります。
Expert Advisorは、設定された時間枠に依存しません。計算には価格と時間のみが使用されます(ただし、テストと最適化にはM1を使用することをお勧めします)。実際の口座で作業するには、スプレッドが最小でボラティリティが高い通貨ペアが推奨されます:EURUSD、GBPUSD、AUDUSD、USDCAD、USDCHF、USDJPY、NZDUSD。 Expert Advisorは通貨ペアでの取引用に開発されており、金属、契約、株式などではテストされていません。実際の口座にインストールする前に、少なくとも過去3か月間は実際のティックでExpertAd

価格範囲計算機 私の価格を信じて、信じて、信仰! Lekimdikator LiveでYouTubeのビデオを毎日フォローしてください! Lekimdikatorは、市場に出入りするための最高の価格を計算します お気に入りのインジケーターと組み合わせて使用! 証券取引所、外国為替、株式、ストックオプション、外国為替、投資ファンド、不動産ファンド、またはLekimdikatorでMetaTrader 5にアクセスできる市場で取引する方法を学ぶ それは初心者または経験豊富なトレーダーのためのツールであり、誰もが自分のアカウントを保護し、取引により多くの規律を得るためにそれを使用する必要があります Kakaku han'i keisanki watashi no kakaku o shinjite, shinjite, shinkō! Lekimdikator raibu de yūchūbu no bideo o mainichi forō shite kudasai! Lekimdikator wa, ichiba ni deiri suru tame no saikō no ka

I recommend you to read the product's blog (manual) from start to end so that it is clear from the beginning what the indicactor offers. This multi time frame and multi symbol divergence dashboard indicator sends an alert when one or two different divergences have been identified. It can be used with all time frames from M1 to MN. Maximum 9 time frames can be shown in the dashboard at the same time. It is possible to enable moving average, RSI or Bollinger bands trend filter to filter out on
EA STFX BINARY TECHNOLOGIES EA STFX Binary Technologies is specifically designed for Binary MT5 products Volatility Index 75 and 100 The Expert Advisor can be used for Full Automatic and Semi Automated trading. EA STFX has various strategies such as: Day Trade, Averagging , Martingale, Anti Martingale and or combine the two Trading positions can be closed easily using panels such as close profit only, close buy, close sell, close all transactions The choice of indicators for position entries us
The algorithm of the adviser calculates zones of consolidation of the price and the most tentative variants of price movements.
Due to the unique method of determining candlestick patterns in the near past, a trade expert adapts to changing market conditions with minimal delay. This allows you to trust the adviser to work offline for quite a long time without the need for frequent monitoring.
The Expert Advisor was developed in the conditions of "floating" delay in the execution of trade ord

This long-term trading system works on 20 pairs and 1 timeframes. The Expert Advisor uses various trading systems, such as trend trading, countertrend trading and others. This increases the chances of sustained growth and reduces exposure to a single pair or individual operations. The risk is tightly controlled.
The EA has the built-in smart adaptive profit fixing filter. The robot has been optimized for each currency and timeframe simultaneously. It does not need arrival of every tick and h
Стрелочный индикатор, выдающий сигнал при пересечении 2 SMA. Сигналы выдаются в виде стрелок и подходят для торговли бинарными опционами.
Это демо версия индикатора, в не нельзя изменять параметры. Полная версия .
Входные параметры First period- период 1 MA Second period - период 2 MA Invert signals - Возможность давать инвертированные сигналы (для работы по тренду) Candles to count - количество свечей для подсчета статистики Expiration - время экспирации сигнала Length - расстояние
FREE

For those who use the Trading Arrows on the chart for later study, but use the Triple Screen approach and got all those arrows everywhere on all additional charts, here it is: Arrows Cleaner! Just drop it on the chart and leave it there. When needed, just with 1-click you get rid of all those annoying arrows...
SETTINGS You can position the little Button on any corner of the chart. Additionally you can displace it with the Offset settings. You can enlarge or shrink its size, as well as the tex
FREE
Стрелочный индикатор, выдающий сигнал при пересечении 2 SMA. Сигналы выдаются в виде стрелок и подходят для торговли бинарными опционами.
Входные параметры First period- период 1 MA Second period - период 2 MA Invert signals - Возможность давать инвертированные сигналы (для работы по тренду) Candles to count - количество свечей для подсчета статистики Expiration - время экспирации сигнала Length - расстояние для сигналов Особенности :
Возможность использовать инверсию сигналов Возможн

Oscillator trading signals - это динамический индикатор, определяющий состояние к продолжению тенденции роста или падению цены торгового инструмента и отсечению зон с нежелательной торговлей. Индикатор состоит из 2 линий осцилляторов. Медленная и быстрая сигнальная линия. Шкала отображения перевернутая. Зоны вблизи 0 свидетельствуют о тенденции роста цены валютной пары. Зоны -100 свидетельствуют о падении цены валютной пары. На основном графике в виде стрелок отображается потенциально выгодные
MetaTraderマーケットは、履歴データを使ったテストと最適化のための無料のデモ自動売買ロボットをダウンロードできる唯一のストアです。
アプリ概要と他のカスタマーからのレビューをご覧になり、ターミナルにダウンロードし、購入する前に自動売買ロボットをテストしてください。完全に無料でアプリをテストできるのはMetaTraderマーケットだけです。
取引の機会を逃しています。
- 無料取引アプリ
- 8千を超えるシグナルをコピー
- 金融ニュースで金融マーケットを探索
新規登録
ログイン