YouTubeにあるマーケットチュートリアルビデオをご覧ください
ロボットや指標を購入する
仮想ホスティングで
EAを実行
EAを実行
ロボットや指標を購入前にテストする
マーケットで収入を得る
販売のためにプロダクトをプレゼンテーションする方法
MetaTrader 5のための無料のテクニカル指標 - 11

Highly configurable Macd indicator.
Features: Highly customizable alert functions (at levels, crosses, direction changes via email, push, sound, popup) Multi timeframe ability Color customization (at levels, crosses, direction changes) Linear interpolation and histogram mode options Works on strategy tester in multi timeframe mode (at weekend without ticks also) Adjustable Levels Parameters:
Macd Timeframe: You can set the lower/higher timeframes for Macd. Macd Bar Shift: you can set the o
FREE

A professional tool for trading - the divergence indicator between the AO and the price, which allows you to receive a signal about a trend reversal in a timely manner or catch price pullback movements (depending on the settings). The indicator settings allow you to adjust the strength of the divergence due to the angle of the AO peaks and the percentage change in price, which makes it possible to fine-tune the signal strength. The indicator code is optimized and is tested very quickly as part
FREE

ПОСМОТРИТЕ НАШ НОВЫЙ СОВЕТНИК : : https://www.mql5.com/ru/market/product/95095?source=Unknown#description
Индикатор показывает время до закрытия свечи, а также время сервера на текущем графике. Очень прост в использовании, всего четыре настройки:
Lable Location- расположение таймера на графике; Display server time- показывать время сервера или нет; Sound alert when the candle is closed- использовать звуковой сигнал при закрытии свечи или нет; Colour -цвет цифр таймера. Другие полезные беспла
FREE

Key Price Levels Indicator Indicator that shows the highs and lows for the significant price levels for past periods that could be potentially considered as reaction levels. The indicator displays the following price levels: Yesterday high and low The day before yesterday high and low Two days back high and low Last week high and low Last month high and low Last three month high and low (Quarter) Last year high and low
FREE

A new generation progressive indicator from INFINITY. Predictor PRO uses its own entry and exit calculation strategy. Indicator without redrawing signals! This is very important for real trading.
The indicator can be used for any currency pairs, metals, cryptocurrencies or indices. The best time of the H1 chart.
Unlike other indicators, Predictor PRO shows shows the Buy/Sell entry point and the Close exit point. Calculating the profit of all signals in points on the panel helps to choose the
FREE
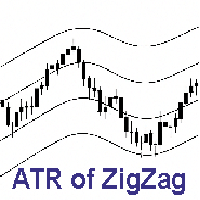
ZigZag Channel Indicator – A Simple Way to Read Market Structure! This indicator automatically calculates the average distance of ZigZag waves and draws a visual channel:
The upper line reflects the average distance of upward waves.
The lower line reflects the average distance of downward waves. Instantly understand market rhythm and price swings.
Use it to identify targets, exits, reversals, and false breakouts.
Perfect for trend analysis, pattern recognition, and measuring move str
FREE

Automatic Fibonacci Levels Indicator The Automatic Fibonacci Levels Indicator is an essential tool for traders seeking to incorporate Fibonacci retracement and extension levels into their technical analysis seamlessly. This innovative indicator automatically identifies significant price movements and calculates key Fibonacci levels, providing traders with valuable insights into potential support and resistance areas. Key features: Automatic Calculation : Effortlessly plots Fibonacci levels base
FREE

Do you want to see the most relevant supports and resistances at a glance? Tired of tracing the levels by hand? Multi Levels Detector is an indicator for MetaTrader that will draw supports and resistances according to the parameters entered, and also offers the possibility of executing an alert every time the price reaches any of its levels.
SETTINGS UsePercentage: Allows you to configure whether the distances between levels will be measured in points, or by a percentage of the asset.
TimeFram
FREE
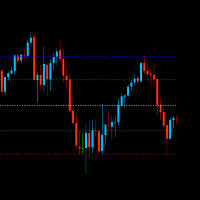
Top and bottom indicator, with the freedom to choose the initial bar and graphic time to be used for calculation regardless of the time frame of the current chart. It also plots mid-range and 23% retracement lines. Good indicator of market strength and current direction of price movement. Also with total freedom of configuration of line types and colors for each line of the indicator. It also has an indicator of the time to bar and open balance in the asset.
FREE

TG Ponto de Cobertura (Coverage Trade)
This Indicator checks your trading results on the day relative to the asset on the chart and adds a line at the price corresponding to the coverage point for the open position, considering the entry price and lot size. The coverage point will be recalculated after new entries, based on the average price of the open operation and the lot size.
If the result for the day is zero, a line will be displayed at the price of the current trade.
If the day's result
FREE

Please Good Review on this indicator, and i will maybe produce more indicators, Coming soon, EA base on this indicators
Linear Weighted Moving Average with HLCC applied price, and Bollinger bands with LWMA as applied price. Interesing Buy and Sell arrow based on this indicator , non Lag indicator as arrow will appear 1 candle after crossed...............
FREE

Clock GMT Live には、ブローカーについて詳しく知るために必要なすべての情報が含まれています。私が何の gmt を使用しているのか、または私のブローカーがどの gmt を使用しているのか疑問に思ったことは何度もありますが、このツールを使用すると、両方の GMT をリアルタイムで知ることができます。 ブローカーと現地時間の時間オフセット、ブローカーのpingも常に知ることができます 時間帯に置くだけで情報が得られる
買収ごとに価格が上昇します。これにより、独自の戦略を持つ人がほとんどいないように保護します 私の他の開発はここで見ることができます
正確なタイミングは、取引において重要な要素になる可能性があります。 現時点で、ロンドン証券取引所またはニューヨーク証券取引所はすでに開いていますか、それともまだ閉じていますか? FX取引の営業時間の開始時間と終了時間はいつですか? 手動でライブで取引するトレーダーにとって、これは大きな問題ではありません。 さまざまなインターネット ツール、金融商品の仕様、および時間自体を使用して、自分の戦略で取引する適切な時期をすばやく確認でき
FREE

Descubre el poderoso aliado que te guiará en el laberinto de los mercados financieros. Este indicador revolucionario te llevará de la incertidumbre a la claridad, permitiéndote identificar con precisión los puntos de inflexión del mercado. Mejora tus decisiones de entrada y salida, optimiza tus operaciones y ¡multiplica tus ganancias con confianza.
Ahora con alertas en tu pc o móvil
¡Para más información, te invitamos a unirte a nuestro canal de Telegram en https://t.me/Profit_Evolution ¡Al
FREE

White label available. contact us for more info. dushshantharajkumar@gmail.com
Chart Walker Smart Lines (CWSL) by Chart Walker Smart Lines is a MetaTrader 5 (MT5) indicator that revolutionizes technical analysis by offering a suite of powerful features to enhance your trading experience. This intelligent tool is designed to automate various aspects of chart analysis, providing traders with valuable insights and saving time on manual tasks. Key Features Automatic Channel Drawing: Smart Lines
FREE
Daily Volatility Tracker is a practical and lightweight indicator designed to help traders monitor and analyze market volatility based on historical daily price movements. Whether you're a day trader, swing trader, or scalper, understanding how much a market moves per day is critical for: Choosing the right pairs to trade Setting accurate stop-loss and take-profit levels Adapting to changing market conditions MT4 Version - https://www.mql5.com/en/market/product/134958/ Join To Learn Market De
FREE
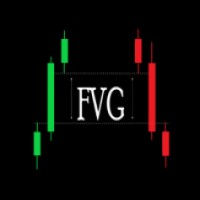
Introducing the Fair Value Gap Indicator : A Simple and Effective Trading Tool The Fair Value Gap Indicator is designed to help traders easily identify and utilize Fair Value Gaps (FVGs) in their trading strategies. FVGs highlight price imbalances that the market often revisits, offering potential trade entry or exit opportunities. Whether you're a beginner or an experienced trader, this indicator simplifies the process of spotting these valuable zones, allowing you to trade with clarity and co
FREE

The indicator shows the current timeframe and symbol name. It is also possible to turn on the indication of time until the end of the current bar. In the settings, you can specify: - the location of the indicator in relation to the terminal window, top left, top right, bottom left and bottom right - a row of text display arrangements so that the inscriptions do not overlap each other - color - font - font size.
FREE
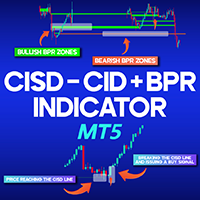
CISD-CSD & BPR Combined Indicator MT5
The CISD-CSD + BPR Combined Indicator is an advanced tool based on the ICT (Inner Circle Trader) trading style in MetaTrader 5. This indicator utilizes the three concepts of "CSD," "CISD," and "BPR" to identify specific zones on the chart and issue trading signals under appropriate conditions. The "CISD" concept comprises four elements: consolidation , impulse , fluctuation , and divergence . Typically, the price exits these zones with a rapid movement ( I
FREE

Вилка Нео v5, разрабатывалась для торговой системы "Оракул", но постепенно дополнялась, например - углами Ганна и другими опциями... Можно создавать графические объекты с заданным цветом, стилем и толщиной, такие как: прямоугольники с заливкой и без, отрезки трендлиний и нестандартный инструмент - "вилка Нео" в виде трезубца, так же есть возможность интерактивно настраивать цветовую палитру прямо с графика, настраивать видимость объектов для разных ТФ, толщину и стили...
Панель переключается кл
FREE

El indicador técnico Trend Magic es una herramienta de análisis de tendencias que combina el Índice de Canal de Mercancía (CCI) y el Rango Verdadero Medio (ATR) para identificar la dirección de la tendencia del mercado. Aquí tienes un resumen de sus pros y contras, así como las mejores condiciones del mercado para su uso:
Pros: - Identificación clara de la tendencia: Cambia de color para indicar tendencias alcistas (azul) y bajistas (rojo), lo que facilita la visualización de la dirección del
FREE

This indicator identifies and highlights market inefficiencies, known as Fair Value Gaps (FVG), on price charts. Using a custom algorithm, the indicator detects these areas of imbalance where the price moves sharply, creating potential trading opportunities. Indicator Parameters: Bullish FVG Color (clrBlue) : Color used to highlight bullish inefficiencies. The default value is blue. Bearish FVG Color (clrRed) : Color used to highlight bearish inefficiencies. The default value is red. Bullish FVG
FREE

Opening Range Indicator
Idea Toby Crabel introduced this way of trading in the ealy ninties in his book "Day Trading with Short Term Price Patterns and Opening Range Breakout". In simple terms this means to trade the brekouts from the limits of the first trading hour with the stop loss at the opposite side. I.e. if the first hourly candle meausres 40 points (Crabel calls this the "stretch") you set the stop loss at breakout level minus 40 points and the take profit at the breakout level plus 4
FREE

Blahtech Moving Average indicator is a multitimeframe version of the standard Moving Average indicator. It is also enhanced with customisable alerts, period breaks and other configuration options. The 50 day and 200 day moving averages are widely followed by investors and traders, with breaks above and below the MA lines considered to be signals of interest. Links [ Install | Update | Training | All Products ]
Feature Highlights Up to three timeframes Configurable calculation variabl
FREE
Zero Lag SMA for MT5 The Zero Lag SMA (ZLSMA) indicator for MT5 provides a variation of the Simple Moving Average (SMA) designed to minimize lag, offering traders a more responsive moving average that adjusts more quickly to price changes. This makes it useful for identifying potential trend reversals and key price levels in a timely manner. Key Features: Zero Lag Calculation : The core of this indicator uses a double smoothing technique to reduce lag, providing faster responses to price movemen
FREE

Free version of the TickScalper indicator. The Tick Scalp indicator is a trading assistant for a scalping trader. Works in a separate window. Tracks the momentary activity of the market, shows the graph of the movement of ticks and the strength of bulls or bears. Sometimes it can anticipate the beginning of a strong movement before any other indicators. Helps the trader to make a decision to open the desired order. Designed to work on any instrument. Used timeframes from M1 to M15. Has simple a
FREE
Moving Average Crossover Alerts by Chart Walker
The Moving Average Crossover Alerts Indicator is designed to help traders identify potential trend reversals and entry/exit points in the market. By tracking two moving averages—typically a faster (short-term) and a slower (long-term) one—the indicator generates alerts whenever these moving averages cross. Key Features: Customizable Moving Averages: Choose from various types of moving averages (SMA, EMA, WMA, etc.) and set your desired periods for
FREE

Hunt markets with Hunttern ZigZag . Easy to use with one parameter
You can use it for the following: -Classic patterns -Heads and shoulders -Harmonic patterns -Elliott Wave -Support and resistance -Supply and Demand
Single parameter: -Period (1-120)
Features: -Candle time -Single parameter -Light mode template
This is version 1 of Hunttern ZigZag. We are very happy to receive feedback from you.
FREE
Simple indicator to show Breakeven line for all orders on attached chart pair. This indicator also comes with additional information such as Total Lot Size, Floating Drawdown in account's currency and Number of open positions and Difference from current price in Points. Do you use DCA (dollar cost average) or Hedging approach on your trading? Then this indicator you MUST have. Really useful, when you have multiple orders (hedging), this can help you quickly identify breakeven point without calc
FREE

Developed by Jack Hutson in the 80's, the Triple Exponential Moving Average (a.k.a. TRIX ) is a Momentum technical indicator that shows the percentage of change in a moving average that has been smoothed exponentially 3 times. The smoothing process was put in place in order to filter out price movements that are considered insignificant for the analysis period chosen. We at Minions Labs found hard to follow the smoothness of the original TRIX line, so we colored the TRIX line with BUY and SELL t
FREE

All traders should know the trend before making their decision when placing the buy or sell orders. The first step always starts with supply and demand , rising and falling channels , trend lines, engulfing candles etc. All the above contribute to what is called “Price Action” and that is the best and most reliable way in trading and catching the trend and making profits, without stress. The Investment Castle Trend Line Indicator will automatically draw the trend lines on the MT5 for you.
FREE
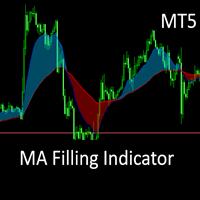
This is the MT5 converted Version of the The MA Filling Indicator, developed by Scriptong, is an advanced technical analysis tool designed for MetaTrader 4 (MT4) that enhances the traditional Moving Average (MA) indicator by incorporating a visually intuitive filling feature. The MA Filling Indicator is a versatile tool suitable for both novice and experienced traders seeking to enhance their trend-following strategies with a clear, color-coded representation of market dynamics Settings: Upward
FREE

Support Resistance Indicator The "Support Resistance" indicator is a versatile tool designed to help traders identify key support and resistance levels based on an underlying algorithm. These levels indicate price points where an asset historically experiences buying (support) or selling (resistance) pressure. The indicator allows traders to visualize these levels on their charts, making it easier to make informed decisions. All Products | Contact PARAMETERS: Timeframe :
Users can select the
FREE

Automatic Trendline Indicator The Automatic Trendline Indicator is a powerful tool designed to simplify technical analysis by automatically identifying and drawing trendlines on a price chart. It analyzes price movements to detect key support and resistance levels, plotting ascending and descending trendlines based on historical price action. This indicator helps traders identify market trends, potential breakout points, and reversal areas with minimal effort. Key features: Automatic Detection
FREE

Mostra a média móvel quando ADX > 20 e pinta de verde ou vermelho quando os valores de ADX estão subindo indicando tendência. Quando o ADX é menor que 20 indica movimento lateral consolidado. O indicador não define pontos de entrada, somente mostra a média colorida quando a tendência está se fortalecendo. Faz parte do grupo de indicadores do Indicador Tavim.
FREE

The indicator displays divergence for any custom indicator. You only need to specify the indicator name; DeMarker is used by default. Additionally, you can opt for smoothing of values of the selected indicator and set levels whose crossing will trigger an alert. The custom indicator must be compiled (a file with ex5 extension) and located under MQL5/Indicators of the client terminal or in one of the subdirectories. It uses zero bar of the selected indicator with default parameters.
Input parame
FREE

The Color Candles Indicator uses custom colors to highlight candles that follow the main market trend, based on the Moving Average. This simplifies the analysis of price movements, making it clearer and more direct. When the price is above the rising Moving Average, candles are highlighted indicating a BUY opportunity. When the price is below the declining Moving Average, candles are highlighted indicating a SELL opportunity.
Input Parameters : Period Method Applied Price
The moving averages
FREE

MultiVision Dashboard – Monitor Multiple Markets at a Glance.
The MultiVision Dashboard is an advanced, user-friendly MQL5 indicator that allows traders to monitor multiple symbols and timeframes simultaneously in a single, intuitive dashboard. It's designed to simplify market analysis by presenting essential data clearly, helping traders quickly identify opportunities and make better trading decisions.
Key Features
Flexible Symbol & Timeframe Selection
Customize the dashboard with your prefe
FREE

The Supertrend etradro indicator is volatility based and is more of a trend following indicator in function. The ATR indicator, which is integrated into the calculation of the super trend, also calculates course gaps (gaps) and does not overlook them. This allows more accurate values to be calculated. When measuring volatility, the mean value of the current price serves as the basis. Since the Supertrend indicator features sliding stop and reversal lines, it is quite similar in function to the P
FREE

BEHOLD!!!
One of the best Breakout Indicator of all time is here. Multi Breakout Pattern looks at the preceding candles and timeframes to help you recognize the breakouts in real time.
The In-built function of supply and demand can help you evaluate your take profits and Stop losses
SEE THE SCREENSHOTS TO WITNESS SOME OF THE BEST BREAKOUTS
INPUTS
MaxBarsback: The max bars to look back
Slow length 1: Period lookback
Slow length 2: Period lookback
Slow length 3: Period lookback
Slow
FREE

FREE

Indicator Name: DualClockWithSignalTime.mq5 Description: The DualClockWithSignalTime is a custom MetaTrader 5 (MT5) indicator designed to display three pieces of real-time information directly on the chart: Broker Server Time Local Computer Time Last Signal Time (BUY/SELL) This indicator is helpful for traders who need to monitor both the broker's time and their own local time, ensuring better synchronization of trading actions. Additionally, it automatically detects and displays the latest BUY
FREE

Cybertrade ATR Trend Zone - MT5 The indicator shows, by calculating the ATR (Average True Range), the zone of probable price resistance. Indicated to be used as a probable exit point of an operation.
It works on periods longer than the period visible on the chart. All values are available in the form of buffers to simplify possible automations. This indicator is the same one we use in our EA. Also check out our other products.
FREE

One of the good and important features in MT4 is the availability of the iExposure indicator. With the iExposure indicator, traders can see a comparison of ongoing open positions and how much funds have been used, and more importantly what is the average value of these open positions.
Unfortunately this indicator is not available on MT5.
This indicator is iExposure MT4 which I rewrote using the MT5 programming language. This indicator can be used like iExposure on MT4 with the same functions.
FREE

The Fair Value Gap Detector is a MetaTrader 5 indicator designed to identify and draw rectangles on the chart wherever fair value gaps (FVGs) are detected. Fair value gaps occur when there is a significant disparity between the current price and the fair value of an asset. These gaps can provide valuable insights into potential trading opportunities, as they often indicate overbought or oversold conditions in the market. Key Features: FVG Detection: The indicator utilizes a proprietary algorith
FREE

説明 :
外国為替市場(PSAR)で専門的で人気のあるインジケーターの1つに基づいた新しい無料インジケーターをご紹介します。このインジケーターは元のパラボリックSARインジケーターの新しい変更です。プロSARインジケーターでは、ドットと価格チャートのクロスオーバーを見ることができます。クロスオーバーはシグナルではありませんが、動きの終わりの可能性について話します。新しい青いドットで購入を開始し、最初の青いドットの1 atr前にストップロスを配置し、最後にドットが価格チャートを横切るとすぐに終了できます。
売買シグナルを開く方法は? 最初の青い点によるオープンバイトレードと最初の赤いドットによるオープンセルトレード
正しいストップロスはどこにありますか? 安全なストップロスは最初のドットにある可能性があります(最初の青いドットの買いの場合と最初の赤い点の売りの場合)
正しいテイクプロフィットはどこにありますか? テイクプロフィットはストップロス距離とRRに基づいて調整できるので、私の提案は2 RRで、ストップロスの2倍です。
利益を上げているのにtpを達成できなかった場合
FREE

Overview Inspired by Tradingview’s falconCoin, The Market Cipher indicator is a momentum oscillator used to detect overbought/oversold conditions and potential trend reversals. Traders can also use it to spot divergences between price action and momentum for early entry or exit signals. Configuration Guide Core Indicator Settings The indicator calculates momentum using a short-term and a longer-term average. Momentum is plotted as a wave oscillating between overbought and oversold thresholds. Ov
FREE
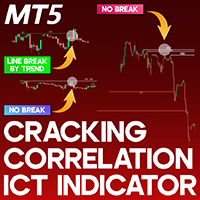
Cracking Correlation ICT Indicator for MetaTrader 5 The Cracking Correlation Indicator is a specialized ICT-style tool designed to track shifts in correlation among three financial assets. Typically, indices such as DJI, ND100, and SP500 move in tandem due to strong market correlation. However, there are instances when this synchronization breaks. The indicator identifies these moments, visually representing them through color-coded lines that change based on correlation shifts. «Indicator Insta
FREE

The TMA Centered Bands Indicator for MT5 draws bands on the chart and shows the overall price trend. It displays three bands - the lower and upper boundaries of the channel and the median. The bands are made up of moving averages, and each of them has an MA period. The name TMA comes from triangular moving averages, as the indicator draws triangular bands. The price will fluctuate between these ranges whenever the trend changes direction, thus creating entry and exit points. How to trade
FREE

The SMTrendLine indicator is based on the principles of graphical construction of Bollinger bands.
Graphically, the Bollinger is two lines that limit the price dynamics from above and from below, respectively. These are a kind of support and resistance lines, which most of the time are located at levels far from the price.
As we know, the Bollinger bands are similar to the envelopes of moving averages. The difference between them is that the envelope boundaries are located above and below the
FREE

Price Sessions is an exclusive MetaTrader 5 indicator that integrates symbol information and trading sessions into your chart. It does not link to any account information or external sources, ensuring user safety. Main Features: 1. Symbol Information Current Symbol Live Price Live Spread 2. Trading Sessions (Time zone UTC/GMT+0) Tokyo session London session New York session If you find this utility helpful, please rate it. If you encounter any issues or have suggestions, pleas
FREE

Channels indicator does not repaint as its based on projecting the falling and raising channels. As a trader you need a path to be able to place your buy and sell trades such as: Supply and Demand , Falling & raising channels. Falling and raising channels can be in any time frame and also can be in all time frames at the same time and the price always flows within these channels. Experienced trades will draw the key levels and channels around the time frames. But, they will not be able to draw
FREE

Previous Candle Levels MT5 shows the previous candle levels, it shows the previous candle Open High Low Close levels (OHLC Levels) in different time frame. It's designed to help the trader to analyse the market and pay attention to the previous candle levels in different time frame. We all know that the OHLC Levels in Monthly, Weekly and Daily are really strong and must of the time, the price strongly reacts at those levels. In the technical analysis, the user can use them as a support and res
FREE

Andrew Pitch fork is one of the most interesting string trend & Channel & Fibo technical analysis , it's like ALL in ONE tool would be very enough for you.
Using 2 Andrew pitch Forks with 2 different time frames on same chart is really very hard working and might be impossible , but with this indicator is possible now , moreover , using this method as Candle Volume based analysis give strong trust for your trade.
I assume if you are having 1 daily pith fork lets say with 22 Candle value , and
FREE

Smart Grid MT5 automatically recognizes any symbol, period and scale of the chart and marks it up accordingly. It is possible to mark up the chart by trading sessions. The grid consists of the two main line types.
Vertical lines There are two visualization methods: Standard - the lines are divided into three types, separating: Small time period. Medium time period. Large time period. Trading Session - the lines are divided into groups (a total of ten). Each group has two lines: the first is res
FREE

The Fisher Transform is a technical indicator created by John F. Ehlers that converts prices into a Gaussian normal distribution. The indicator highlights when prices have moved to an extreme, based on recent prices. This may help in spotting turning points in the price of an asset. It also helps show the trend and isolate the price waves within a trend. The Fisher Transform is a technical indicator that normalizes asset prices, thus making turning points in price clearer. Takeaways Turning poi
FREE
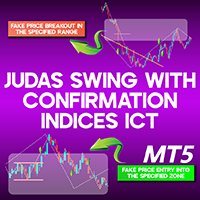
Judas ICT Indicator Indices with Confirmation MT5 The Judas Indicator with Confirmation (Judas Indices ICT with Confirmation) is an advanced tool for MetaTrader 5 that specializes in detecting deceptive price movements. This indicator helps traders spot false breakouts (fake outs) and identify the dominant market trend more accurately. To enhance precision, it integrates a confirmation system within the 1-minute timeframe , reducing the likelihood of incorrect signals. «Indicator Installation &
FREE
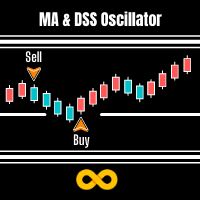
MA & DSS Oscillator is a simple system that overcomes all the market confusion by looking at the Moving Average and Double Smoothed Stochastic Oscillator. A Signal is made when the Oscillator is under 50 (A default value) and heading in same direction as the Moving Average.
The moving average is arguably the simplest but most effective tool when trading larger timeframes. We use this and the Double Smoothed Stochastic Oscillator to time our market entry.
Double Smoothed Stochastic is similar
FREE

「NakaTrend」をご紹介します:MetaTrader 5向けの究極のトレンド検出器!
取引体験を革命化する準備はできていますか?NakaTrendは、トレンドの変化を精密かつ簡単に特定するための頼りになるインジケーターです。
NakaTrendを使用すると、市場の変化を見逃すことはありません。上昇トレンドが発生すると、NakaTrendは緑のドル記号でそれを示し、買い注文を入れるタイミングを示します。そして、トレンドが下降に転じると、赤いドル記号が現れ、売り注文を入れる絶好のタイミングを示します。
しかし、それだけではありません:NakaTrendは、手動で注文を入力できるようにすることで、取引をコントロールする力を与えます。あなたの直感とNakaTrendの洞察力が、利益をもたらす結果に導くでしょう。
推測や時代遅れの指標に依存する日々は過ぎ去りました。NakaTrendは、信頼できる明確で実行可能なシグナルを提供するために高度なアルゴリズムを活用しています。
そして、NakaTrendはMetaTrader 5内で直接動作するため、取引ルーティンに統合することは簡
FREE

The Martinware Volume indicator plots a colored moving average over volume bars. The coloring uses three colors and can be done in different ways choosable by the user and is applied both to the average as to the volume bars.
Three types of coloring are possible: None: no coloring is done Increasing or decreasing: changes the color depending on the current value being bigger or lesser than the previous one Volume relative to average: colors vary if the current volume is bigger or lesser then
FREE

すべてのストラテジーをスキャンし、選択したアクティブのすべてのタイムフレームでの買いポイントと売りポイントを表示するスキャナーをお持ちになったことはありますか? それがまさにこのスキャナーが行うことです。このスキャナーは、 Rule Plotter: プログラミング不要のストラテジー作成ツール で作成した買いシグナルと売りシグナルを表示し、さまざまなアクティブとタイムフレームで実行するために設計されています。 Rule Plotterのデフォルトストラテジーは陽線と陰線だけです。つまり、Rule Plotter内に何のストラテジーも描かない場合、このスキャナーは選択したアクティブのすべてのタイムフレームでのキャンドルの色を表示します。キャンドルが陰線の場合は赤で、陽線の場合は緑です。 好きなだけストラテジーを作成 標準のストラテジーに制限されることはありません。Metatraderで利用可能なすべての指標を使用して従来のストラテジーを構築するか、お好きな指標を使用してカスタムストラテジーを構築できます。 このスキャナーはRule Plotterが提供するもののほんの一部であり、Rule
FREE

Tyr Bands Indicator (IC MARKETS GOLD). Just drag and drop. This indicators gets you entry points for the market. it is for gold, but you can configure for any other currency. Tyr Band works with BB and 3 different deviations, plus the Stochastic confirmation. So when the price closes below/above the BB Reversal Band (Red) and the Stochcastic is in the confirmation zone, then the arrow (buy/sell) appears. This arrow indicates that we can entry to the market up/down on the next opening. Since it i
FREE

これは、異なるブローカーやアカウントの異なるタイプが異なるスプレッド値(ビッドとアスク価格の差)を持つことができることは秘密ではありません。 このような状況では、同じExpert Advisorが完全に異なる結果で取引されます。 シンボルの広がりが大きいほど、あなたが得る利益は少なく、ブローカーがあなたから得る利益は多くなります。 したがって、スプレッドを測定することは、特にスキャルピング、真夜中と日中の戦略のために、ブローカーと口座の種類を選択するために非常に重要
無限大からシンプルだが信頼性の高い指標は、あなたが任意のブローカーで任意のシンボルの広がりを追跡するのに役立ちます!
ちょうどあらゆる図表に散布図の表示器を取付けて下さい(M1-H1は推薦されます)。 スプレッドメーターは、最大の最小スプレッドと平均スプレッドの変更を追跡し、記憶します。
チャートの下部にある散布計インジケーターのヒストグラムは、リアルタイムで履歴を蓄積します。 したがって、インジケータを常に使用することが重要です。 VPSまたは永続的なインターネット接続を持つコンピュータをお勧めします。
FREE

It makes it easier to see where there have been consolidation zones for previous prices and allows you to highlight the histogram where there is the biggest consolidation zone.
Input parameters Intervalo de preço Is the price between the histograms
Periodo Number of candle sticks to be analyzed
Porcentagem Highlights the histogram where there is minimal consolidation in relation to the analyzed period
FREE

The HighsAndLowsPro indicator for MetaTrader 5 marks local highs and lows in the chart. It distinguishes between weak and strong highs and lows. The line thicknesses and colours can be individually adjusted. In the default setting, the weak highs and lows are displayed thinner, the strong ones thicker. Weak highs and lows have 3 candles in front of and behind them whose highs are lower and lows are higher. The strong highs and lows have 5 candles each.
FREE

For MT4 version please click here . Introduction Most traders use candle patterns as a confirmation tool before entering a trade. As you know there are lots of candle patterns out there. However I realized most of them can be generalized in simple rules. So I developed my own candle pattern(Although I cannot say for sure this is mine). pattern description The pattern consists of three consecutive candles. This is true for most of the patterns out there (considering there is a confirmation neces
FREE

Trendy Stock is a price following indicator that uses Stochastic to show when the price is out of the oversold or overbought areas. The algorithm allows you to stay longer in a trend where the bulls or bears are in control. The indicator changes color immediately the price exits oversold/overbought state. In short, the downtrend [red] bars start to paint when the buying pressure decreases while the uptrend [green] bars form as the buy pressure kicks in. For MT4 version, follow :: https://www
FREE

Alert Indicator for exponential moving average cross blue arrow for buy alert , fast ema 14 crosses above 50 pink arrow for sell alert , fast ema 14 crosses below 50 Default 14 ema fast & 50 ema slow add these indicators to chart Full Alerts , push, email, phone inputs for moving average lengths and alarm on off settings Please contact for help of an indicator alert suggestion
FREE

CTJM Candle Timer Countdown displays the remaining time. It can be used for time management. Feature Highlights Tracks server time not local time Configurable Text Color and Font Size Optional Visualization of the Symbol Daily Variation Optimized to reduce CPU usage
Input Parameters Show Daily Variation: true/false Text Font Size Text Color
Feel free to use
FREE

Highly configurable Moving average indicator.
Features: Highly customizable alert functions (at levels, crosses, direction changes via email, push, sound, popup) Multi timeframe ability Color customization (at levels, crosses, direction changes) Linear interpolation option Works on strategy tester in multi timeframe mode (at weekend without ticks also) Parameters:
MA Timeframe: You can set the lower/higher timeframes for Ma. MA Bar Shift: Y ou can set the offset of the line drawing. MA Period,
FREE
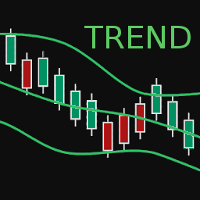
BBTrend is a relatively new indicator developed by John Bollinger to work with Bollinger Bands. It is one of only a few indicators that can signal both strength and direction making it a very valuable tool for traders.
Calculations The calculations are fairly simple. The default periods of 20 and 50 are shown, but these can be changed through the parameters. Lower = MathAbs(lowerBB(20) - lowerBB(50)) Upper = MathAbs(upperBB(20) - upperBB(50)) BBTrend = (lower - upper) / middleBB(20)
Interpret
FREE
MetaTraderマーケットはトレーダーのための自動売買ロボットやテクニカル指標を備えており、 ターミナルから直接利用することができます。
MQL5.community支払いシステムはMetaTraderサービス上のトランザクションのためにMQL5.comサイトに登録したすべてのユーザーに利用可能です。WebMoney、PayPal または銀行カードを使っての入金や出金が可能です。
取引の機会を逃しています。
- 無料取引アプリ
- 8千を超えるシグナルをコピー
- 金融ニュースで金融マーケットを探索
新規登録
ログイン