YouTubeにあるマーケットチュートリアルビデオをご覧ください
ロボットや指標を購入する
仮想ホスティングで
EAを実行
EAを実行
ロボットや指標を購入前にテストする
マーケットで収入を得る
販売のためにプロダクトをプレゼンテーションする方法
MetaTrader 5のための無料のエキスパートアドバイザーとインディケータ - 32

Description of ADTGroup_Oscillator.mq5 Indicator
The ADTGroup_Oscillator.mq5 indicator is a custom technical analysis tool created by avydel. It is designed to provide insights into market trends and potential trading opportunities. Here is an overview of its key features and functionality:
- **Indicator Type:** This oscillator is designed to be displayed in a separate window on the trading platform. - **Indicator Plots:** It utilizes one buffer for plotting data. - **Plot Style:** The indi
FREE

Please, if you like this AE, I would appreciate it if you could rate it with 5 stars ️ ️ ️ ️ ️ THANK YOU!!
Expert advisor based on 3 trend indicators and a signal filter to limit market entries when there are false signals. It is recommended to test and update this signal filter once a year to adapt to changing market conditions. The Expert Advisor includes the following parameters: Magic number: Maximum slippage: Stop loss (pips): Fixed lot or Risk: Filter signal: Info pane
FREE

The spread in trading is the difference between the purchase price and the sale price of a financial instrument on the market. The spread is a commission fee that traders pay brokers for the opportunity to trade.
It's no secret that each broker offers its own terms for trading. The size of the spread is important. There are a lot of advisors (especially scalpers) who show different results at different brokers. We have repeatedly encountered this. Therefore, using this utility, find out what
FREE

Funciona como bandas de bollinger normais. Criado por Joe Ross, é um setup de maior risco por ser contra-tendência. Pode ser usado para Day Trade, Swing Trade e Position. Para identificar, é necessário inserir no gráfico as Bandas de Bollinger, com uma Média Móvel Simples de 20 períodos e largura (desvio) 2. Verifica-se um fechamento de determinado candle abaixo da banda inferior de Bollinger. Se o próximo candle fechar dentro das Bandas, marca-se a máxima dele. O rompimento dessa máxima será o
FREE
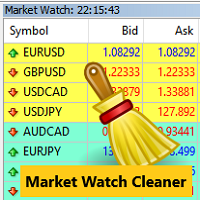
Clean up Market Watch from unused symbols.
If you use multiple advisors and terminals on the same account your Market Watch windows may get filled with unused symbols from orders and positions opened on other terminals. Every symbol in the Market Watch consumes cpu power and bandwidth to get constantly updated and if you are on a vps you want to minimize resources consumption. Market Watch Cleaner helps you with that by periodically cleaning your Market Watch window from unused symbols.
Par
FREE

This is a utility for storing the data on open interest (OI), ratio of buyer/seller orders' number and the ratio of buyer/seller orders' volumes on the Russian FORTS futures market. This is the first product of the series. Now, you can trace history of the specified data in real time in МТ5 terminal. This allows you to develop brand new trading strategies or considerably improve the existing ones. The data received from FORTS market is stored as a database (text CSV or binary one at user's discr
FREE

Close Manager EA for MetaTrader 5 Introduction: Welcome to the Close Manager EA, an essential tool designed exclusively for MetaTrader 5. This expert advisor has been meticulously crafted to streamline and enhance the trade closure process. Whether trades are initiated manually or by other EAs, this tool offers a diverse range of customizable criteria, empowering traders with enhanced control over their trade exits. You can find the MT4 version here Key Features: Logs Capture (SHOW_LOGS): Enable
FREE
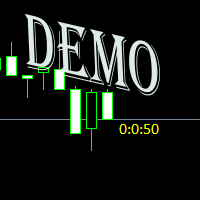
Простая утилита показывающая время до формирования свечи. Может быть очень полезна, если вход в сделку завязан на начале/завершении свечи. Демо версия работает на валюте EURUSD Входные параметры FontColor - Цвет текста. FontSize - Размер текста. FontName - Шрифт текста. TimeOnly - Указывать только время, без дополнительного текста. TypeOfDrawing - Тип отображения информации Важно : возможна задержка в 1 сек.
FREE

The Equity Curve indicator is a simple and helpful tool that shows the development of the equity curve in real time. For precision measurement, it should be used in a separate window with a period of M1.
Main features The indicator shows the development of the equity curve in real time. High precision on the minute chart. High-speed calculation. Available for MT4 and MT5. Please visit the Equity Curve indicator product page for the input and output parameters settings.
FREE

This EA created for GBPUSD on H1. The strategy is a martingale. It has been back tested since 2015-01-01 till now on ICMarkets raw account. The minimum deposit is $1,000 and maximum should not be over $10,000 because its a Martingale. Recommended account is ECN or Raw. its a scalp EA so for sure the spread would be matter. Lot Size built up with percentage (%) that means it calculated according Stop Los and percent of deposit.
FREE

This is a Price Projection for Current Candle from Time Frame M15 To Weekly, It's shows Market Trends Teji (Bullish) Or Mandi (Berries). It's Show Teji High & Low for Bullish Market and Mandi High & Low for Berries Market. We can Plan Our Trade in Well Advance for our Current Open Trade. It's Generate New Data for Every New Candle. You are requested to Please Test it with demo Ac before Use in Real Trade. Please Save it to your Mql\Indicator folder and attache to your chart. if any quay Please
FREE

Slides by Chart Walker "Slides" is a MetaTrader 5 (MT5) utility designed to streamline chart navigation by facilitating automatic chart switching. With "Slides," users can preset specific time intervals for chart rotation, enabling automatic transitions between different financial instruments or timeframes. This utility proves invaluable for traders who monitor multiple charts simultaneously, as it optimizes workflow efficiency and ensures that relevant data is consistently accessible.
FREE

This is an arbitrage indicator. The indicator displays the chart of an arbitrary combination of trading instruments, described by the entered arithmetic formula. Using the indicator. Add an indicator to any chart. Enter the formula as a string in the indicator's parameters. All symbols used in the formula must exactly match the names in the table "Market Overview" of the terminal. Example of the formula: (SIBN + SNGS) / 'RTS-3.19' + 2.5 * GAZP / LKOH Start the indicator The formula must meet the
FREE

This indicator will mirror the assets in use in another metatrader, being able to choose the timeframe and a template. This is the Metatrader 5 Client, it needs the Metatrader 4 or 5 Server versions: Metatrader 4 Mirror Chart Server: https://www.mql5.com/en/market/product/88644
Metatrader 5 Mirror Chart Server: https://www.mql5.com/en/market/product/88652 Details of how it works in the video.
FREE

It is Test product Lorem ipsum dolor sit amet, consectetur adipiscing elit, sed do eiusmod tempor incididunt ut labore et dolore magna aliqua. Ut enim ad minim veniam, quis nostrud exercitation ullamco laboris nisi ut aliquip ex ea commodo consequat. Duis aute irure dolor in reprehenderit in voluptate velit esse cillum dolore eu fugiat nulla pariatur. Excepteur sint occaecat cupidatat non proident, sunt in culpa qui officia deserunt mollit anim id est laborum. Faucibus scelerisque eleifend donec
FREE
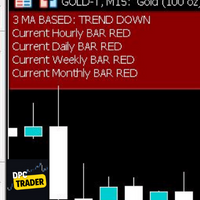
This Utility Bot is for New Traders, that struggle to spot the Trend direction. It also make you conscious about different Timeframes Bar Status. Utility have 3 Moving Averages totally configurable by input parameters. 3MA Based Trend is shown for the current Timeframe selected on the chart. (Line 1) 3MA Based Trend for Daily Timeframe. (Line 2nd) Also provide quick information about the currently Hourly Daily and Weekly Candle Status. Utility work on 1 Min Bar control, so comment section info
FREE

Apenas Cancela Ordens Exceução de cancelamento de ordens de modo rápido, para todos os ciclos de mercado Necessita do Indicador ( https://www.mql5.com/pt/market/product/79691 ) Para mais detalhes de configurações e input de variáveis entre em nossa comunidade no guilded ( https://www.guilded.gg/i/E9m8bYLE ) Inclui Rompimentos, Canais Estreitos, Canais Amplos e Lateralidades, ou seja para todos os ciclos
FREE

Pivot points have been a trading strategy for a long time, originally used by floor traders. Using this method, you can understand where the market is going in a day through a few simple calculations.
The pivot point in the pivot point method is the turning point of the market direction during the day. A series of points can be obtained by simply calculating the high, low and closing price of the previous day. These points may form key support and resistance lines. The pivot point, support an
FREE

The indicator shows the current spread of the symbol, the minimum, average and maximum values for the current bar in the form of digital, analog and graphic indicators. Has two modes of operation: fixing the system spread, or calculating the spread as the difference between the "Bid" and "Ask" prices on each incoming tick. Parameters The indicator has a single input parameter: Type of calculation - type of spread calculation. It can take the following values: System spread - the spread value
FREE

This is an alert based on a moving average convergence / divergence (MACD) and additional moving average indicator (for trend confirmation) similar to my other product where you find detailed description of how it works. You get a colored table where colors are related to trading conditions (see below) with possibility to customize all indicator parameters, including Heikin Ashi calculations. Meaning of cell COLORS (can be redefined by user): GREEN - buy signal, PINK - sell signal, YELLOW - pay
FREE

Draws trend lines from the high and / or low values of the week. The color and thickness of the levels are customizable. All trend lines can be edited. Suitable levels of the past can be renamed and other properties changed. Levels are re-read only on the H1 timeframe once an hour.
...
FREE

Account Info EA It is a tool that presents on the graph all the positions of the account, and specific information concerning the positions, but also the account. It enables the user to have an image of his account at a glance. Use like any expert advisor. You can't attach it in the same chart with other expert advisor. It does not have the ability to open or manage positions. You can attach it on any chart and any timeframe.
FREE

TTraderAssistant was developed to help ordinary traders in there journey to becoming successful and profitable traders. TTraderAssistant will/does not open trades on it's own, it's sole purpose is to work along the trader. TTraderAssistant will help you manage your trading risk with a variety of lot-sizing profiles available to open trades by your command and risk appetite. Various Trailing-Stop Features were built in such as Trailing-Start and Trailing-Step to help judge your exiting strateg
FREE

FXRog = Forex Running On Growth
Expert Advisor description ShortTerm : Yes MidTerm : Yes LongTerm : Yes TargetProfit : By Money, value can be changed in the parameter StopLoss : By Maximum Open Position, all position will closed when maxtrade is reach, value can be changed in the parameter
Parameter description StartTrade : begining time to start trading EndTrade : last time ea to open a position MoneyManagement : 1 = FixLot, 2 = VolumeLot FixLot : lot of transactions with a fixed amoun
FREE

This EA automatically closes all Open Trades and Pending Orders at your specified time, before weekend close. It is always a wise approach to close all your open trades and pending orders, before weekend close on Friday, due to following two reasons: There may be unfavorable big price gap on market open. There may be wide spreads , starting almost 30 minutes before market close & almost 30 minutes after market open. A pair that usually has a 3 pip spread may widen to 50 pips, which may eas
FREE
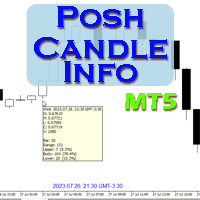
Show candle info with: Time in selected timezone Bar number Candle range points Upper wick points and percentage Body points and percentage Lower wick points and percentage Mark large/small candle body with customizable line. Settings group: Broker and local timezone. Lookback bars for candle marking. Large candle body Small candle body Date and time info with auto position or custom the x and y coordinate.
FREE

Free version. Only works on EURUSD. Would you like to have statistics about your trades displayed while you operate? Have you a solid understanding of the symbol you are trading? Do you really know everything you need to about your trading account? Do you need to keep an eye on the local times around the world? Advanced Info Displayer answers to all that. It helps you to know many hidden or hard to find data. Also, it is very convenient if you value statistics and maths. Just to exemplify, in mo
FREE

An Adaptive Moving Average (AMA) is one more moving average overlay, just like EMA. It changes its sensitivity to price fluctuations . The Adaptive Moving Average becomes more sensitive during periods when price is moving in a certain direction and becomes less sensitive to price movement when price is volatile. For more information, welcome to our Telegram Group. https://t.me/InfinXx
FREE

This EA provides functions: Start Trading, End Trading, Сlose Order(Time), Pending Order Placement (Time), Tralling stop (automatically according to strategy), trading can be switched off, daily range (strategy), stop loss per day (risk management), Stop loss (risk management), take profit (money management), tracking stop and tracking step (strategy), Risk per order (risk management) and much more!
Customizable settings: At your own risk!! Use preset files from the seller!
EA settings
1:
FREE
Expert Advisor that tracks assets listed in the Market Watch window by checking which assets are needled (crossing the 3, 8, and 20 moving averages) or are close to crossing. It does not track when there is no crossing of the averages. The EA allows you to choose the timeframe for analyzing the crossings. There is no maximum limit for assets or EAs running simultaneously, but a very large number can lead to system slowdown and freezing. Users should be mindful of their device's capabilities. T
FREE
Мультивалютный индикатор в отдельном окне отображает движение валютных пар в пунктах с расхождением от начала дня. Во время работы, динамически возможно включать и отключать различные пары прямо на графике. При первом запуске, возможно, потребуется продолжительное время, пока загрузиться история для основных валютных пар. Для валют CAD, CHF, JPY - график перевернут.
При повторном открытии, все настройки индикатора восстанавливаются автоматически.
FREE

you can close all your positions in profit or lost when you use this robot. 1.you set your max profit and max lost for all your positions. 2.the robot show you in a window beside your chart. 3.when your equity reach your target close all your positions. 4.you can use one of them or both (profit or lost)togather. 5.this robot close all your positions. ((if you have any idea or want somthing i can help you)) i hope you win in all your times of life. best regard
FREE

The indicator converts two moving averages into histograms and paints their intersection area.
There is a shift trick setting, it is used to smooth the result of calculations. You can see the changes if you reduce this parameter to 1 (minimum value).
Available averages:
MA Simple MA Exponential MA LinearWeighted MA Smoothed DEMA TEMA and
RSI - as a bonus By default, the fast MA is displayed at the top of the histogram, and the slow one at the bottom. You can swap them if you like.
shi
FREE

TRAILINATOR is a unique Solution to use different Trailing-Stop Variants and change your settings via Remotecontrol. You configure your Trailing-Stop for a specified Symbol only once. This setting will be used for all your Positions of the same Symbol. Currently we support these different Trailing-Stops: Standard : works like you use in Metatrader Terminal, starts trailing if your profit is greater than trailing stop Start after points : trailing stop will start after your defined points in p
FREE

This EA is designed to monitor the slippage of opening and closing orders, and save the records in csv file. It is useful to record the slippage and evaluate brokers. The record files are saved in the folder MT5_Data_Folder\MQL5\Files. Go to "File " --> "Open Data Folder" . Warning : Do NOT open the files directly, otherwise it will affect the exectution of EA, just copy them to another folder and open them.
Usage: Open a chart and load the EA on it, just need only one EA to run, it m
FREE

Calm kangaroo The Expert Advisor tool has been developed for AUDCAD 1H based on BollingerBands indicator, SMA and pending orders. It has been backtested on more than 18-year long tick data with 99% quality of modeling. The enclosed screenshots demonstrate the complexity and coverage of the test by Monte Carlo analysis with 200 simulation. A broker with a small spread and slippage is recommended for better performance. There is no need to set up any parameters, except Magic number and Friday ex
FREE
Background This product is a practical tool to check the market based on the cycle theory. When you analyze multiple cycles of a symbol and add multiple charts on the secondary screen, when you need to view the multi cycle charts of other symbols, you cannot switch quickly, which will increase a lot of time cost. This product can quickly switch the symbol displayed in the chart in the sub screen, and the application template remains unchanged, and the placement position will not change, which g
FREE
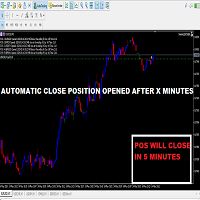
この小さなツールを使用すると、時間カウンターを分単位で定義できます
あなたが設定した分数に応じてポジションをクローズするため。
たとえば、30分に設定した場合、ツールはオープンから30分後に各オープンポジションを閉じます。
設定
アクティブ:ツールをアクティブにして、定義された分数後にポジションを閉じるために使用します。
管理:ツールで管理されるシンボルで選択します。
アカウントのすべてのオープンポジションにシステムを適用する場合は、[ALL CURENCY]を選択します
「この通貨のみ」を選択すると、現在の通貨のみで一時的にポジションがクローズされます。
MINUTE DURATION TRADES:取引期間の分数を選択します。
タイムゾーン:
タイムゾーンを定義します。
もしあなたが
FREE

White Crow Indicator
by VArmadA A simple yet powerful candle analysis based indicator using the White Soldiers & Crow patterns.
Works with timeframes 1H and higher and tested on all major pairs. Pay attention to the signal: An arrow indicating a long or short entry.
How It Works:
Arrows indicate a ongoing trend. After multiple bullish or bearish candles in a row the chances for another candle towards that trend is higher.
Instructions: - Crow Count: Set the number of candles that ne
FREE

The indicator draws actual Fibonacci levels for your trading activity.
The levels are redrawn every time after the price touches the low (0%) or the 100% fibonacci level.
In the parameters, select the trading activity: Long term investor Medium term investor Medium-term investor active Short term investor Short-term investor active Speculator Speculator active Scalper Scalper active Try this indicator in action, and you will no longer have to look for coordinates for drawing fibonacci level
FREE

Order Book, known also as Market Book, market depth, Level 2, - is a dynamically updated table with current volumes of orders to buy and to sell specific financial instument at price levels near Bid and Ask. MetaTrader 5 provides the means for receiving market book from your broker in real time. The expert OrderBook Recorder records market book changes and stores them in local files for further usage in indicators and expert adviser, including testing in the tester. The expert stores market book
FREE

Este indicador apresenta 7 médias configuráveis, que podem facilmente ser utilizadas em robôs ou em operações manuais.
Facilita a identificação de tendências e reversões. Seus buffers estão ordenados e são facilmente identificáveis para utilizar em robôs. Liberado para uso em operações manuais ou automatizadas.
Em breve vamos postar um robô que utiliza estas médias como parâmetro de negociação.
FREE

Version for MT5. Add to the 'Scripts' folder The script for calculating the lotage to comply with the pre-set risk. It can be used on any assets. Parameters: Risk - the amount of risk per transaction
Execution mode :
Limit (BuyLimit - Bid, SellLimit - Ask) - limit orders at the best prices
Market (Buy - Ask, Sell - Bid) - market orders at the best prices.
Magic - the individual number with which orders will be placed
When the script is running on the chart, it is not recommended to switch
FREE

Dynamic Theoretical Stop
Histogram indicator that dynamically analyzes the theoretical Stop levels in real time.
Operation :
The DTS - Dynamic Theoretical Stop does a mapping of fractals in previous candles and suggests two levels of Stop: For purchase and for sale.
Suggested reading :
It is necessary to make the definition of Maximum Stop in points in the Trading Plan. In this way, the trader can decide the best entry point by analyzing the theoretical stop levels:
Stop for sales: S
FREE

Что такое MACD? Обычный MACD – это осциллятор хотя его часто называют трендовым индикатором, или даже «трендовым осциллятором». Происходит это потому, что MACD строится на основе показаний двух скользящих средних. Чем отличается MACD DA?
В MACD DA используется специальный ценовой фильтр. Только после фильтрации строится индикатор. Гистограмма отображает степень расхождения двух скользящих средних: если одна удаляется от другой, то растут и столбики гистограммы, если сближаются, тогда столбц
FREE
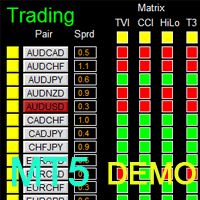
如果产品有任何问题或者您需要在此产品上添加功能,请联系我 Contact/message me if you encounter any issue using the product or need extra feature to add on the base version.
Dashboard Genesis Matrix Trading MT5 Demo is the demo version of Dashboard Genesis Matrix Trading MT5 , which has full functionalities of the paid version, except EMA5_HA is not available Stochastic 2 is not available Stochastic 1 time-frame is fixed at M5 TVI is not available DB_timeframe is fixed at M5 Send alert function is not available Sent notific
FREE

Tick imbalance bars (TIB), described in the book Advances in Financial Machine Learning (2018) by Marcos López de Prado. Indicator that show candlestick bars with an different sampling method than time fixed. Real time data is sourced to the indicator and it may be used as substitute of the default graph. Each bar is formed when a predefined tick balance is exceeded, showing in the graph the OHLC of this cluster of ticks. The input variable is the amount of ticks of each bar. The indicator may
FREE

Dear friends, I present to you my TradeFields EA adapted for Forex , modeling is based on machine learning using averaging and grid trading. The EA is a fully automatic light version and it is intended for trading in a single currency mode with a fixed micro lot and has only trading session intervals for all days of the week as external settings. You can find professional versions of advisors with many settings and many additional functions at the following links: https://www.mql5.com/r
FREE

FOREXBOB AUTO CLOSER is a very handsome tool for :- Scalping Correlation Hedging Those who use averaging methods As this utility tool will help you by closing all your running trades when the universal floating P/L reaches a certain value that you will put in inputs. This tool consider all the trades that running on the your account either opened MANUALLY or with help of an EA.
Inputs USD - Put numeric value for required profit Group Mode - False Magic No. - Zero (0) to consider manually open
FREE

The custom Bollinger Bands Height indicator measures and displays the current state of the Bollinger Bands indicator, showing whether the bands are widening (moving away from each other) or narrowing (starting to converge). Contraction, indicated by the narrowing of the bands, suggests that the current market movement is losing momentum and hints at the potential start of a new strong movement. This can be a signal to look for an opportune moment to enter a position, as a sharp price change ma
FREE

FRB Trader - Time Indicator that shows the server's time of operation.
You can edit the font color and size of the timetable.
Settings
Font color
Font size
Background color
To move the Timetable, just click on it and move the mouse to where you want to leave it. After placing the Time where you want it, click again or press "ESC" and the time will stay where you left it.
FREE
アップデート版の無料公開中です。 140ダウンロードありがとうございます。 動画は Ver. 034.30 原資1, 000ドル/レバレッジ25倍 テストの一例です。 Ver. 034.33 リリース致しました。 継続して内部で調整していますが、 枚数の設定は外してエントリーできる維持率の限度を調整することで資金管理します。 以前に比較してエントリー数が増加すると共に一時的なドローダウンは増加することがあります。余剰資金を多めにするか、レバレッジを高く設定する必要があります。
エントリーできない不具合について このページの最後に まとめています。改善の都度アップデートします。
基本事項 プラットフォーム:MetaTrader 5 通貨ペア:EUR-USD チャート:5分足 EUR-USD の5分足のチャートを表示して、セットします。 1分足と同等という認識になりましたので5分足とします。
ブローカーによって調整が必要な場合がございます。
MT5に慣れていらっしゃらない方向け MT4メインでお使いのために慣れていらっしゃらない方もおられるかと存じます。 最もメ
FREE

Highly configurable Accumulation and Distribution (AD) indicator. Features: Highly customizable alert functions (at levels, crosses, direction changes via email, push, sound, popup) Multi timeframe ability Color customization (at levels, crosses, direction changes) Linear interpolation and histogram mode options Works on strategy tester in multi timeframe mode (at weekend without ticks also) Adjustable Levels Parameters:
Ad Timeframe: You can set the lower/higher timeframes for Ad. Ad Bar Shi
FREE

Trend indicator based on the ADX / ADXWilder indicator
The indicator shows trend areas using ADX or ADXWilder indicator data.
How the indicator works: if PDI is greater than NDI, then it`s bullish movement; if PDI is less than NDI, then it`s bearish movement; if ADX is less than or equal to the filter value specified in the parameters, then there is no movement state.
Input parameters of the indicator: Calculate Timeframe - timeframe for calculation; ADX Type - type of ADX calculation
FREE

RSI magic kjuta trial is the demo version of RSI magic kjuta.
Custom Indicator (RSI magic kjuta) based on the standard (Relative Strength Index, RSI) with additional settings and functions. The maximum and minimum RSI lines on the chart have been added to the standard RSI line. Now you can visually observe the past highs and lows of RSI, and not only the values of the closing bars, which avoids confusion in the analysis of trades. For example, the EA opened or closed an order, but the RSI l
FREE

Save time placing orders This is a tool for manual trading. It has an intuitive, and straightforward interface without any useless extras. Allows you to automatically calculate the order volume size, open both market and pending order. Works on any symbol/instrument, account type or broker. Input fields: Order Size - as percentage of account free margin Take Profit - as percentage of account balance Stop Loss - as percentage of account balance Symbol Contract Size - needs to be manually entered
FREE

EA to prevent inactivity violations on prop firms.
This EA will scout for your most recent trade and if it is older than the number of days defined, will enter a micro lot position size 0.01 on the pair defined. It is recommended to use a tight spread pair like EURUSD. This EA will not act as long as you have at least one trade in the last X days (defined on config).
This EA will not place other trades or modify existing position.
FREE

Displays previous months Highs & Lows. You can set the number of months to display levels for, also the line style, color and width. This is very useful for traders using the BTMM and other methods like ICT. I'll be creating more indicators for MT5 for the BTMM. Send me your suggestions to my Telegram: https://t.me/JDelgadoCR Take a look at my other products at: https://www.mql5.com/en/users/jdelgadocr/seller
FREE
製品概要 本製品はMT5のユーティリティツールであり、裁量取引に役立ついくつかの情報をチャートに表示します。 MT5により標準搭載されているインジケータを使ったり、手動計算によって得られる情報の一部を、最初からチャート上に表示します。
This Is Something Useful MT5の利点 裁量取引で確認が必要な必要最低限の情報をいつでもチャートに表示 本ツールを用いることで、必要な情報にいつでも素早くアクセスすることができ、トレードに集中することができます。
設定項目 ・Time Information 自身が設定したMT5サーバとローカルPCの時差から、ローカル時間を表示 夏時間・冬時間の考慮の有無 (ニューヨークサマータイムルールを採用) 各時間にグリッド線を表示 テキストおよびグリッドの色設定
・Count Down Timer 表示中の時間足チャートのロウソク足の確定までの時間を表示 カウントダウンタイマーの表示位置 カウントダウンタイマーの文字色
・ATR 表示中の時間足チャートのATRの表示 ATRの計算期間 ATRの表示位置 ATRの文字色
FREE

The MAtrio indicator displays three moving averages on any timeframe at once with a period of 50-day, 100-day, 200-day. After attaching to the chart, it immediately displays three moving averages with the parameters of simple (SMA) moving average MAmethod50 , simple (SMA) moving average MAmethod100 , simple (SMA) moving average MAmethod200 . Accordingly, with the price type MAPrice50 , MAPrice100 , MAPrice200 , by default, the price is Close price everywhere. All parameters (MA calc
FREE

This script allows selecting the TakeProfit and StopLoss levels. It analyzes the history data, and then calculates the probability of reaching a given price level.
How the script works Suppose you have a trading strategy and you want to select the TakeProfit and StopLoss levels. Run the script and set the parameter: Number of Bars - the average position holding time in bars. Once the script operation is complete, the AIS-PPL.csv file will be created in the Files folder in the terminal data cat
FREE

Multi-timeframe trend indicator, based on the ADX / ADXWilder indicator The indicator shows trend areas using ADX or ADXWilder indicator data from multiple timeframes. The impulse mode of the indicator allows you to catch the beginning of a trend, and several "Screens" with different timeframes allow you to filter out market noise.
How the indicator works: if PDI is greater than NDI, then it`s bullish movement; if PDI is less than NDI, then it`s bearish movement; to determine any trend, it
FREE

Indicador Volatilidade Histórica Indicador é um oscilador que faz o plot da volatilidade histórica de um ativo, representado pelas fórmulas: Volatilidade Histórica = Raiz quadrada da média das diferenças ao quadrado * Fator de anualização. Média das diferenças ao quadrado = soma de todas as diferenças de retorno diário / número total das diferenças. Retorno diário = (preço atual - preço anterior) / preço anterior. Nesse indicador estamos utilizando os preços de fechamento de cada barra e fazemos
FREE

Simple countdown indicator for the next candle. Only claim is to be light! The indicator inserts a text object to the right of the current price and calculates how much time is left for the new bar, showing this to the trader. Leave your comment if the indicator helped you in any way! If you have any suggestions, let me know to evaluate the improvements. Success and Good Trades!
FREE

EA交易演示 :VPS IP:117.50.106.17 登陆帐户:Taolishen 密码:qq2356692354 关于作者 没有EA参与的交易,都存在着巨大的风险。因为恐惧或贪婪,会让我们失去最佳的交易位置。但是,假如EA没有判断能力,这个EA将可能会让我们面临着更大的风险。 我们需要一个拥有判断能力的EA来配合我们的交易。 关于EA Taolishen 是一个拥有多种交易策略的EA,同时也是资深的交易员的忠实交易伴侣。 1 EA拥有一系列的交易策略和思路,完全可以满足无人工参与的全部交易。 2 EA具备一系列的交易参数设定,我们通过修改,就可以实现自定义的交易策略和思路,所有的交易策略和方式方法我们都可以清楚明白了。 3 EA的可变性:EA在交易过程中,我们可以随时通过修改参数数值,改变EA的交易方式方法,使由EA改变成为交易伴侣。 制定策略 1 可以自定义策略:如趋势,网格,趋势马丁,趋势网格等等。 2 可以设定各种指标如:MA,MACD,KDJ,Bolling等等一种或多种指标组合,作为EA的交易参照。 3 可以自定义划趋势线,平衡线等等作为EA的交易参照。 4 可以设定交
FREE

An EA to export trading history for FXer - Journaling and Analytics. Register Create an API token Put EA on any chart (any TF is fine) Fill in the API token Follow analytics for better trading !!! Currently in beta-testing !!! At FXer, our mission is clear: to empower traders like you with the tools needed to excel in the ever-changing world of trading. We are committed to providing top-tier, data-driven market analysis and trading intelligence, ensuring you can make well-informed decisions, man
FREE

这款专为MetaTrader 5设计的EA(Expert Advisor),能够在加载后自动关闭所有图表,并立即从当前图表中自行移除。它适合那些希望快速清理所有图表,并避免手动关闭每个图表的用户。 功能特点: 一次性清理: 加载后立即关闭所有打开的图表。 自动移除: 执行完毕后,EA自动从当前图表中移除,无需手动操作。 快速高效: 适用于快速清理交易环境,特别适合在需要快速重置或结束交易日的情境。 使用说明: 只需将此EA添加到任何一个图表上,它将自动执行关闭所有图表的操作并自行移除。使用前,请确保已保存所有重要的图表数据和设置。 风险提示: 请谨慎使用此EA,以防不小心关闭重要图表。 适用于MetaTrader 5平台。 技术支持: 如有任何技术问题或需求,请联系我以获得帮助。
FREE

Indicators are professional data statistics, position orders, historical order analysis->>>>>> <This version is in Chinese -> English version please move>
Necessary for traders: tools and indicators Waves automatically calculate indicators, channel trend trading Perfect trend-wave automatic calculation channel calculation , MT4 Perfect trend-wave automatic calculation channel calculation , MT5 Local Trading copying Easy And Fast Copy , MT4 Easy And Fast Copy , MT5 Local Trading copying For DE
FREE

You may have found after a carefully planned trade something happened. An unexpected event... You forgot to look the web calender or use any kind of program. This fills this gap in its own way. Features: - show all events as vertical lines - low, medium or high events... with different colors. -name of the events and numbers associated with the event are also shown such actual value, forecast value and previous value.
The calendar information is obtained from your broker. It is a built-in ser
FREE
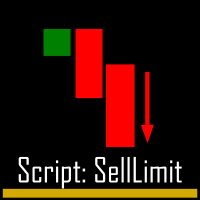
I find the lot calculation tedious so I just use this script and tell it the dollar amount to use. It then does the rest. This works for any currency.
How-To: Creates a sell limit order at chosen MA price using the desired dollar amount instead of lots. To use, just drop it onto a chart and set inputs as needed. The script will then do the necessary lot calculation and create a sell limit order.
Inputs: FIXED_DEAL_AMOUNT: Fixed amount to use for the trade e.g 100 to open a R100 deal MA_PRICE
FREE
MetaTraderマーケットは、開発者がトレーディングアプリを販売するシンプルで便利なサイトです。
プロダクトを投稿するのをお手伝いし、マーケットのためにプロダクト記載を準備する方法を説明します。マーケットのすべてのアプリは暗号化によって守られ、購入者のコンピュータでしか動作しません。違法なコピーは不可能です。
取引の機会を逃しています。
- 無料取引アプリ
- 8千を超えるシグナルをコピー
- 金融ニュースで金融マーケットを探索
新規登録
ログイン