YouTubeにあるマーケットチュートリアルビデオをご覧ください
ロボットや指標を購入する
仮想ホスティングで
EAを実行
EAを実行
ロボットや指標を購入前にテストする
マーケットで収入を得る
販売のためにプロダクトをプレゼンテーションする方法
MetaTrader 5のための無料のエキスパートアドバイザーとインディケータ - 36

To get access to MT4 version please click here . This is the exact conversion from TradingView: "Candle body size" by "Syamay". This is a light-load processing indicator. This is a non-repaint indicator. Buffers are available for processing in EAs. All input fields are available. You can message in private chat for further changes you need. Thanks for downloading
FREE
TrendFollowMT is a fully automated trading system which is using large time frame to determine the trend and use small time frame to find the entry point. Once the trend changed to opposite side, the system will wait for another entry point to recover with bigger lot size. Moreover, the target profit will be moved up when more position had been opened. The aim is to cover the cost of waiting time and risk.
Free version will only trade on buy signal and locked the initial Lot size (0.01). Paid v
FREE

OVERVIEW
The Fibonacci Moving Averages are a toolkit which allows the user to configure different types of Moving Averages based on key Fibonacci numbers.
Moving Averages are used to visualise short-term and long-term support and resistance which can be used as a signal where price might continue or retrace. Moving Averages serve as a simple yet powerful tool that can help traders in their decision-making and help foster a sense of where the price might be moving next.
The aim of this scrip
FREE

The Box Range Indicator for MT5 helps traders visualize key price zones by automatically detecting and highlighting market structures. It dynamically draws upper, lower, and middle levels based on price action, making it an effective tool for identifying support and resistance zones, breakouts, and trend reversals .
Key Features: • Automatic Box Detection – Identifies price ranges based on market movements. • Dynamic High and Low Updates – Adjusts in real time to reflect market conditions.
FREE

Indicator for fast navigation through financial instruments. When you click on the button, you go to the chart of the financial instrument, the name of which was written on the button. In other words, the indicator opens or unfolds an existing chart window. For each chart, you can customize the name of the financial instrument, text color and background color; in total, you can customize symbols buttons that you trade often. The indicator can be installed on any charts for which you need to swit
FREE

SYMPHONY 8aは、8aSistemasによって開発された高度な投機システムであり、高度なフィルタリング方法を備えたインテリジェントな入出力および管理アルゴリズムを使用します。
ここでは特別なことは何もありません。聖杯のテストはありません。厳密なルールベースの取引アプローチであり、リスクを管理しながらリターンを最大化することができます。
推奨通貨ペア:EURCAD
各ペアで最適化されている限り、どの通貨ペアでも開発できます。
SYMPHONYは、市場が範囲内にあるときに機能します
各ブローカーの時間を最適化することは非常に重要です。このバージョンは、DARWINESUKサーバーで最適化されています。
推奨用語:M5
要件:
ヘッジ口座!
EAには、良好な仲介条件が必要です。つまり、ロールオーバー時間中のマージンが低く、ずれが発生します。本当に良いECNブローカーを使うことをお勧めします。あなたにアドバイスするために私に個人的に書いてください。
EAはVPSで継続的に実行されている必要があります
環境
新しい取引の開始を許可する:Sc
FREE

Description by chatGPT:
In the dance of flames, a candle transforms,
From the close of old, a new light is born.
A derivative of candles, changing forms,
Unveiling secrets in the flickering morn.
Like indicators, patterns do precede,
On charts of price, where future paths are sown.
The candle's dance, a signal to take heed,
Foretelling tales in fiery lines shown.
I trust the candlemakers to discern,
Using indicators as their guiding light.
In every flame, a lesson to be learned,
In every shift
FREE

A classic buy low & sell high strategy. This Bot is specifically Designed to take advantage of the price movements of US30/Dow Jones on the 1 Hour Chart, as these Indices move based on supply and demand. The interaction between supply and demand in the US30 determines the price of the index. When demand for US30 is high, the price of the US30 will increase. Conversely, when the supply of shares is high and demand is low, the price of t US30 will decrease. Supply and demand analysis is used to i
FREE

This is a utility panel to assist closing of open Deals. The panel has input filters to assist one select the right trades. The tool displays the number of trades to be closed as well as profits to be realized. One click close, Filter trades to be closed by: symbol, (Filter by a particular symbol in the trade terminal). magic number (If your orders are from particular EA with unique magic numbers). whether in profit, loss or All. (P/L=all trades, profiting = trades in profit, loosing = trades
FREE

With this indicator you have displayed on the chart the optimal lot size for the forex pair. No need for manual calculations or losing time on websites where you have to input the values to get the optimal lot size. The indicator values are preset for maximum percentage risk is 2% and for maximum pips loss is 50. For a customizable version you can buy using the this LINK . ATTENTION: This only works with forex pairs and it doesn't work on account deposits in YENS!!!!!!
FREE

The Volume Heatmap indicator visually shows the INTENSITY of the volume taking into account the concept of standard deviation. Purpose of the Indicator: High volumes are common where there is a strong consensus that prices will increase. An increase in volume often occurs at the beginning of a new upward trend in the price of an asset. Some technical analysts do not rely on trend confirmations without a significant increase in volume. Low volumes usually occur when an asset is heading for a down
FREE

Price Aler t can help you send notifications to your personal Telegram when the price crosses a preset value. Additionally, you can check your MT4/5 account info anytime from your Telegram by simple command: /check. Get more free useful EAs here !
HOW TO SET UP? * Get inputs for EA: - Telegram Bot Token: Create a Telegram bot by @BotFather , and save your Bot Token. Find your bot by username & press "start". - Telegram User ID: Use your User ID by chatting with @ userinfobot * Setup
FREE

A script for closing positions If you need to quickly close several positions, this script will make all the routine for you! The script does not have any input parameters. Allow AutoTrading before running the script. Usage:
Run the script on a chart. If you need to specify the maximal deviation and the number of attempts to close positions, use the script with input parameters https://www.mql5.com/en/market/product/625 You can download MetaTrader 4 version here: https://www.mql5.com/en/market/
FREE

Tokyo Session Box Indicator : Draw a box of Tokyo session. Inputs tutorial: 1. Automatic: true/false. To calculate box automatic base GMT. 2. Broker time zone: if Automatic is False, you have to define broker time zone (ex: 2 ) 3. Button ON/OFF properties: x, y, corner, color, background fill, width, height, font name, font size. This button will toggle showing or hiding Tokyo session box.
FREE

Hey guys.
This indicator will show you, in the volume histogram, if the candle was a Doji, a bullish candle, or a bearish candle.
The construction of this indicator was requested by a trader who uses other indicators from my catalog, and I decided to release it free to help traders who think that the indicator can contribute to their operations.
The parameters are:
Volume Type: Real Volume or Tick Volume. Color if the candle is bearish: select the color. Color if the candle is high: select
FREE

Trading Signal for MetaTrader5 PC platform
The Signal is based on the Investologic EA trend strategy . Trend following indicator’s and oscillator’s, can work with any symbol or market in MT5 platform FOREX, GOLD, OIL, STOCKS, INDEXES, NASDAQ SPX500 The strategy
the strategy uses multi time frame combination of indicators and moving averages to find the best entry point wen the fast MA slow MA Crossover And Stochastic , RSI , Average Directional Movement Index ,combined together to
FREE
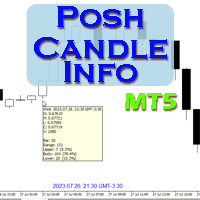
Show candle info with: Time in selected timezone Bar number Candle range points Upper wick points and percentage Body points and percentage Lower wick points and percentage Mark large/small candle body with customizable line. Settings group: Broker and local timezone. Lookback bars for candle marking. Large candle body Small candle body Date and time info with auto position or custom the x and y coordinate.
FREE

(Google 翻訳) この指標は、 ジョン ウェルズ ワイルダーの平均真範囲 (ATR) に触発されましたが、いくつかの追加情報が含まれています。 同様に、真の範囲の指数移動平均を計算しますが、 ワイルダー の代わりに標準のアルファ ウェイトを使用します。 また、範囲平均の平均偏差を計算し、オフセットとして表示します。 これにより、変更をより迅速に特定できるだけでなく、その影響も特定できます。 (Original text) This indicator was inspired by John Welles Wilder's average true range (ATR) , but with some extra information. Similarly, it calculates the exponential moving average of the true range, but using the standard alpha weight instead of Wilder's . It also calculates the average deviatio
FREE

1、このトラッキングシステムはローカルトラッキングシステムであり、つまり送信側と受信側は同じコンピュータで操作しなければならない。MT 4/5アカウントは複数のコンピュータで同時に登録できるので、読み取り専用アカウントのパスワードを顧客に送るだけでいい。ローカル荷為替は、ネットワークの荷為替速度に関係しないので、非常に安定しています。 2.現在は送信端です。グラフに読み込めば正常に動作します。また、受信側をインストールして注文書を受信し、パラメータリストに送信側のmt 5アカウントを入力してください。 3.サポートとマルチフォローをお願いします。複数のMT 4/MT 5を実行すれば、いくつのインボイスを実行できますか?同じプラットフォームはコピーしてインストールしたフォルダで同時に複数のアカウントに登録することができます。 4.mt 4受信側でmt 5送信を受信し、mt 4と単mt 5を実現し、mt 5と単mt 5もサポートする。 5.機能紹介: 同プラットフォーム/クロスプラットフォームのフォローアップをサポートします。 応援します。 順方向のトラッキングをサポートします 固定単量シ
FREE

MetaTrader 5 (MT5) 用の Wormhole 時間枠インジケーターは、ただの取引ツールではありません。それは、金融市場での競争優位性です。初心者とプロのトレーダーの両方を念頭に設計された Wormhole は、データの分析方法と意思決定を変革し、常に一歩先を行くことを保証します。 なぜ Wormhole インジケーター(無料)が必要なのか 競争に勝つ: 同じチャート上で 2 つの時間枠を同時に表示できるということは、常に一歩先を行けることを意味します。チャートを切り替える必要はなく、必要な情報はすべて目の前にあります。 隠れたチャンスを発見する: 従来の時間枠を変更し、他のトレーダーが見逃すパターンを発見します。5 分間のチャートの範囲を 00:01 から 00:06 に変更して、標準の 00:00 から 00:05 の代わりに分析することができます。これらの微細な変更は、市場の独特なダイナミクスを明らかにする可能性があります。 実行可能な洞察を得る: トレンド、反転、サポート/レジスタンスレベルを検出するための精密なツールを使用することで、Wormhole は自信を持
FREE

This EA is named Dinosaur Hunter(DH) because it can capture very large trend, such as 5000-10000 pips. DH trades infrequently as it patiently waits for the right market conditions. DH can load multiple currency pairs on a single chart to increase the number of trades. Live Signal
This is a demo version that only for fixed lot size of 0.01. To obtain the full version, please purchase Dinosaur Hunter Pro . This EA has been tested from 2015 to the present. The test used data from Dukascopy. If yo
FREE

This indicator displays breakouts on Point-And-Figure-like or Kagi-like custom symbol charts, generated by special expert advisers, such as PointFigureKagiCharts . This indicator is applicable only for custom instruments generated in appropriate way (with time-invariant bars which are multiples of a predefined box size). It makes no sense to apply it to other charts. The breakouts in up or down direction are marked by arrows. The breakout price is found at crossing of one of imaginary lines of
FREE

1. The Expert Adviser is built with a basic, simple and stable trading strategy with a touch of Price Action Principle that is highly effective and accurate for a sniper entry system. The EA have a good money management System.. 2. The expert advisor works best as from 5minutes time frame and above, The higher the time frame, the more accurate is the signal.... 3. The expert advisor work with all broker all currency pair and synthetic indices... 4. Use a reasonable lot size and correct settings
FREE

This is a versatile tool designed to help traders analyze their trading performance on a MT5 account. It provides a detailed of profit, allowing users to review their overall account performance or filter trades based on specific criteria. With this tool, traders can: Check total profit across all trades. Filter by a single Magic Number or multiple Magic Numbers (enter directly, separated by ",") Analyze individual symbols or a custom set of symbols to evaluate different market instruments (
FREE

This indicator combines RSI(14) and ADX(14) to find out the signal that price moves strongly. When it appears signal (represent by the yellow dot), and price is going down, let consider to open a SELL order. Otherwise, let consider to open a BUY order. In this case, the strength of moving is strong (normally after sideway period), so we can set TP by 3 times of SL .
FREE

FractalEfficiencyIndicator A ratio between 0 and 1 with the higher values representing a more efficient or trending market, It is used in the calculation of Perry J. Kaufman Adaptive Moving Average (KAMA), dividing the price change over a period by the absolute sum of the price movements that occurred to achieve that change. The Fractal Efficiency or also known as Efficiency Ratio was first published by Perry J. Kaufman in his book ‘Smarter Trading‘. This is mostly considered a filter for v
FREE

Background
This product is a practical tool to check the market based on the cycle theory . When you need to use multi cycle charts to analyze a symbol , manually adding charts with different cycles and applying templates is a very large cost. This product can help you quickly add multi cycle charts of one or more symbols, and uniformly apply the same template . After adding, you can drag the charts to the sub screen, which is suitable for multi screen analysis. Usage Method Apply this script to
FREE

Donchian通道(唐奇安通道指标)是用于交易突破的最古老、最简单的技术指标之一。 一般来说,唐奇安通道的宽度越宽,市场波动就越大,而唐奇安通道越窄,市场波动性也就越小 。此外,价格走势可以穿过布林带,但你看不到唐奇安通道的这种特征,因为其波段正在测量特定时期的最高价和最低价。 交易实用必备工具指标 波浪自动计算指标,通道趋势交易 完美的趋势-波浪自动计算通道计算 , MT4版本 完美的趋势-波浪自动计算通道计算 , MT5版本 本地跟单复制交易 Easy And Fast Copy , MT4版本 Easy And Fast Copy , MT5版本 本地跟单复制交易 模拟试用 Easy And Fast Copy , MT4 模拟账号运行 Easy And Fast Copy , MT5 模拟账号运行 唐奇安通道指标计算: 唐奇安上阻力线 - 由过去N天的当日最高价的最大值形成。 唐奇安下支撑线 - 由过去N天的当日最低价的最小值形成。 中心线 - (上线 + 下线)/ 2 唐奇安通道信号 唐奇安通道常用作突破指标。它提供了两种主要类型的突破信号,一个是上阻力线或下支
FREE
Easy to use EA designed to auto trade. Works in every market condition. It uses reliable levels of MACD indicator combined with unique logic to perform fully automatic trading operations. *For MT4 version please go here! *If you don't like automated system and only need an alert system to help you in trading. Please check this arrow with alert system here!
FEATURES: Dangerous methods like martingale, hedge, grid or scalping are NOT used. Each position has Stop Loss and Take Profit. Positional
FREE

Bollinger Bands % or Bollinger Bands Percentage is one of the indicators used in the Sapphire Strat Maker - EA Builder .
It is calculated using the following formula:
Perc = (CLOSE_PRICE - LOWER_BOLLINGER) / (UPPER_BOLLINGER - LOWER_BOLLINGER) * 100
Thus, by taking the difference between closing price to the lower band and dividing it by the difference of the upper and the lower price levels of a Bollinger Bands indicator, we can calculate this indicator.
It shows how far the price is from
FREE
This indicator allows to hide ZigZag indicator (on all MT4 timeframes) from a date define by the user with the vertical line. This indicator can be use with other "Hidden Indicators". Indicator Inputs: Depth Deviation Backstep Information on "ZigZag" indicator is available here: https://www.mql5.com/en/articles/1537 ************************************************************* Hey traders!! Give me your feeds! We are a community here and we have the same objective.... make some money from th
FREE

Overview The Expert Advisor sends notifications to a mobile phone, via e-mail or activates an audio alarm in case any changes are detected on the trading account: opening/closing positions, changing order parameters, balance or leverage. Also, the Expert Advisor can inform that Equity on the trading account has dropped below a specified value or Free Margin is small compared to Margin. The Expert does not trade, it only monitors your account and orders.
Launching the Expert Advisor You should a
FREE

TickChart Indicatorは、MetaTraderのメインウィンドウにティックチャートを表示します。
(無料のLite版、TickChart Indicator Liteでは、 表示するティック数を20に制限し、以下の説明にあるアラート機能を省いています。) ティックチャートは、市場の動きを最も詳細かつリアルタイムに示すティックラインを描画します。値が変わるたびに発生するティックの間隔は1分足のローソク幅より短いので、通常のチャート上には描けません。通常、数個のティック線分が、1分足のローソクが完成する間に発生しており、重要な指標の発表直後には、その数が100を超える事もあります。 このインディケーターは、ティックラインをメインウィンドウの通常のチャートの上に描きます。通常のチャートは、"時間-価格"空間に描きますが、ティックチャートは、"ティック-価格"空間に描かれます。すなわち、ティックチャートのX軸は時間ではなく、市場が活発だとX軸の進行は速く、閑散だと遅くなります。 TickChart indicatorは、いろいろな場面で役立ちます。例えば、 スキャルピングの道具
FREE

The RFOC Mini Chart was created to project a macro view of the market, which the option to select the timeframe of interest other than the main chart, it is possible to include 2 indicators:
In the full version it is possible to include 2 indicators: 1 - Moving average channel On the mini chart, the moving average will be created based on the prices of the selected time frame for the RFOC Mini Chart. The moving average period must be selected in the indicator settings pannel. 2 - Boillinger Ban
FREE

This indicator is a zero-lag indicator and displays exact trend as is. True Trend Moving Average Pro works best in combination with True Trend Oscillator Pro that displays strength of trend change.
True Trend Oscillator Pro: https://www.mql5.com/en/market/product/103589
If you set PERIOD input parameter to 1 this indicator becomes a sharpshooter for binary options.
Default input parameters: TT_Period = 10; TT_Meth = MODE_SMA; TT_Price = PRICE_MEDIAN;
Before you buy this product, please do t
FREE

1. Торговая стратегия Что делает советник: Советник следит за некотоными индикаторами и при определенном условии (или условиях) помещать торговый запрос (на продажу или покупку) в зависимости от условий. Стратегия:
Используем индикатор Moving Average (скользящие средние) с периодом 8 (вы можете выбрать любой период, но в данной стратегии мы будем использовать период 8). Советник покупает, если 8-периодная скользящая средняя (далее для удобства будем называть ее MA-8) возрастает и текущая цена за
FREE

Position Closer is advisor used to close all orders when the profit will cross specified value either above or below. You can close all orders with one button click.
On panel on chart you have options: Deactivate after close - If Deactivate after close is checked the advisor will disable Close above profit and Close below profit options after orders are closed either on crossing the profit or on hitting the CLOSE ALL button. Close above profit - If Close above profit is checked, the advisor wil
FREE

FREE

Бинарный индикатор находит свечной паттерн "Поглощение" и рисует соответствующий сигнал для входа рынок. Имеет встроенные фильтры и панель для просчета количества успешных сделок. Демо версия является ознакомительной, в ней нет возможности изменять параметры. Полная версия . Особенности Работает для всех валютных пар и любых таймфреймов. Индикатор рассматривает комбинацию из 2-х или 3-х свечей в зависимости от настроек. Имеется возможность фильтровать сигналы путем настройки количества свече
FREE
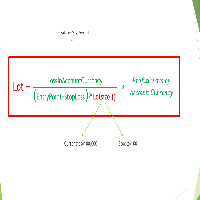
Important Note: Before using it in a real account test it in your demo account.
//+------------------------------------------------------------------+ //| Optimum_Lot_Size.mq5 | //| Copyright 2023, MetaQuotes Ltd. | //| https://www.mql5.com | //+------------------------------------------------------------------+ #property copyright "Copyright 2023, MetaQuotes Ltd." #property
FREE

自動ストップロス調整 – 正確に利益を守る! このエキスパートアドバイザー(EA)は、開かれたポジションのストップロス(SL)をユーザー定義の利益しきい値に基づいて自動的に調整し、取引戦略を効率的にし、手動操作を減らします。 仕組み: 動的ストップロス調整: 開かれたポジションに利益(青色で表示)がある場合、このEAは現在の価格を追跡し、ユーザーが設定した利益マージンに基づいてストップロスを調整します。 利益のロック: 例えば、EUR/USDの買いポジションで$15の利益を得て、5ドルのマージンを設定した場合、EAはストップロスを$10の利益に調整します。価格が有利に動けば、EAはさらにストップロスを調整します。 利益の保護: 価格が反転した場合、ストップロスが発動し、得た利益を確保します。 主な特徴: 自動ストップロス調整: 利益に基づいてストップロスを自動的に調整します。 設定可能なマージン: 利益(例:$5)のしきい値を設定し、そのマージンに達したときにストップロスを調整します。 すべてのオープンポジションに対応: EAは取引を実行せず、開かれたポジションのストップロスのみを調整
FREE

Trend View is a simple indicator that shows in a text the trend of the current currency in the timeframe you choose. Inputs are: Color: color of the text. Timeframe: timeframe for calculations. Trend can be: UP: bullish trend. DOWN: bearish trend. ---: trend not defined. You can use this indicator to show the main trend of a bigger timeframe helping you to choose your trades. Note: text is draggable.
FREE
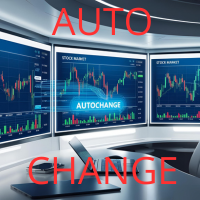
Introducing Auto Change , an Expert Advisor (EA) designed to automatically switch between charts according to the market watchlist. To use it, simply drag it onto the screen and confirm with "OK". Users can set the time interval in seconds for automatic chart switching and start the process by clicking "Start". For example, if a two-second interval is selected, the charts will switch automatically every two seconds. Additionally, the EA includes "Next" and "Back" buttons for manually advancing o
FREE
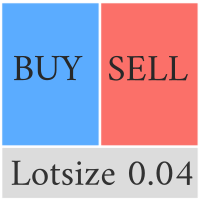
Compliement your normal MT5 Buy/Sell panel with this automatic lot size panel. This product is free without any limitations. There will be a pro verision later with additional functionality, but my motto is to always have awesome free products. It automatically places the stop and sizes the lot according to the given ATR for risk. You have to try it to experience it!
Now I can't trade manually without it.
It's turned out to be much more intuitive than I would think before creating it.
There's
FREE

This indicator get all events/countries/values from metatrader terminal calendar and print veritical lines at chart, you can configure anything with inputs (string to filter names/url/code/countries/currencies), select period to filter, nws interval before and after current time (every information about time is seconds based), you can filter importance, type, sector, unit, multiplier, impact, timemode, frequency, forecast/previous % increase/decrease interval, actual/previous % increase/decrease
FREE
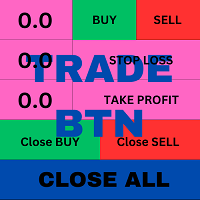
T his is an ON CHART trade management panel. In other words, ON CHART Lot Size, Buy, Sell, Stop Loss, Take Profit, Close Buy, Close Sell and Close All buttons! *IMPORTANT NOTE: Input settings are NOT usable. You can change or insert Stop Loss and Take Profit values only on the chart panel. (See the below video!) This one is MT5 version!
BUTTONS List: 1. Lot Size - (0.01) is default click on it and insert the lot size with which you want to open a trade. 2. Stop Loss - (0.0) is default click on
FREE

This indicator will show the the change of volumes via 2 lines of SMA: . Fast line (default is 5 candles) . Slow line (default is 13 candles) We can use the crossing point of fast line and slow line to know investors are interesting in current price or not. Pay attention: The crossing point is not signal for entry. Absolutely that we must use in combination with other indicators for sure. Parameters: . Fast line periods: the periods (candles) to calculate SMA of fast line . Slow line periods: th
FREE

Automatically protect you positions with Raba BreakEven and Trailing StopLoss EA. Functionalities: Automatic break even. Automatic trailing stoploss
I you have any doubt you can leave it in comments and I will anwer it asap. If you found this tool helpful for you, a comment and a good rating will be appreciated. Also any proposal will be taken into account for future versions.
FREE

This indicator displays the spread with extra options Simple and easy to use and fully customisable: View as Pips or Pipettes Chart symbol can be hidden Text display can be changed Change colour and text styles Add or hide a decimal point Spacing options between inputs Default screen positions Screen position inputs
Pro version includes: Drag and drop box on the screen Add an alert when the spread is too high Alert colours for text and text box changeable
How to use 1. Simply use the default
FREE

An indicator for analyzing different currency pairs simultaneously Forex is a complex market that requires several currency pairs to be analyzed simultaneously Determine the number of currency pairs yourself Determine the currency pair you want to analyze to analyze 4 of the most important and similar currency pairs at the same time. For direct and simple analysis, some currency pairs have changed (EURUSD>>>USDEUR) Do not doubt that to succeed in this market, you must analyze several currency pa
FREE

Live Monitoring: https://www.mql5.com/en/signals/2252642 Quant ML US30 is a bot designed for Dow Jones index-related instruments, operating on the H1 timeframe. It supports: .US30Cash CFD YMMxx, YMUxx futures Any instrument with an underlying Dow Jones Industrial Average index (exact names may vary by broker). This bot is generated and validated by machine learning algorithms, focusing on strategy stability. It: Uses only market entries with fixed ATR-based SL and TP levels. Does not use tr
FREE
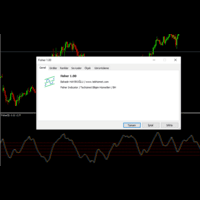
With Fisher level indicator. Many settings can be changed by the user, indicator created with original calculation. You can adjust the levels you create according to yourself and provide more stable displays. What is Fisher indicator: It transforms data that does not normally show a normal distribution, such as market prices. In essence, the transformation helps to better identify price reversals on a chart by making peak swings relatively rare events.
FREE
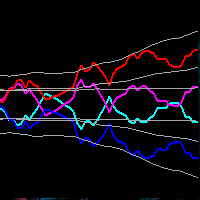
This indicator obeys the popular maxim that: "THE TREND IS YOUR FRIEND" Channel indicators incorporate volatility to capture price action. The Bollinger Bands is widely used, however, there are other options to capture swing action opportunities. Each study you will find here is unique, and reveals different types of price action.
https://www.mql5.com/en/market/product/116256
https://www.mql5.com/en/market/product/115553
FREE

All in one Multipurpose Telegram Trade Management , Manage and Copy Trades on the go From Telegram Pro Version MT5: www.mql5.com/en/market/product/95742 Pro Version MT4: www.mql5.com/en/market/product/85691
Execute Trades on mobile with fast execution When away from desktop MT5, or scalping the market with mobile device, or needed to copy trades from telegram groups while away, or doing some other activities, Telegram EA Manager is an effective tool to perform any trade operation with swift
FREE

This indicator is based on the Fractals indicator. It helps the user identifying whether to buy or sell. It comes with an alert that will sound whenever a new signal appears. It also features an email facility. Your email address and SMTP Server settings should be specified in the settings window of the "Mailbox" tab in your MetaTrader 5. Blue arrow up = Buy. Red arrow down = Sell. Line = Trailing Stop. You can use one of my Trailing Stop products that automatically move the Stop Loss and includ
FREE

Blended Candle Strength (BCS)
Any trading strategy, whether it is a continuation, trend reversal or breakout requires, in addition to analyzing the context of the price movement, confirmation signals for both trading entry and exit. And for that, it is necessary to analyze the formats of the candlesticks and fit them in known patterns to assist decision making. In addition to the context and format, two other important information to determine the strength of candlesticks are the size of the bar
FREE
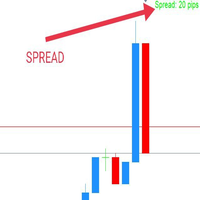
WaSpread MT5 Indicator shows the current spread in pips with color.
* Set the Spread Threshold and the color to identify when the current spread is below or above the Spread Threshold.
* Set X axis and Y axis and chose the Corner and the Anchor to position the Spread Label on the chart.
* Write the font and the font size for more confort.
* Activate alert if the current spread is above the spread threshold.
* For more precision, the user can choose to show the decimal numbers.
* The user
FREE

The indicator highlights in color the places on the chart where the price moves in one direction continuously from the selected number of candles.
You can specify the number of points from the beginning of the movement to select only movements from this amount.
It can be useful for looking for reversals or sharp impulses.
I also recommend purchasing this utility to determine local weekly / monthly trends and support and resistance lines. https://www.mql5.com/en/market/product/61401
FREE

Indicador baseado no ATR (Avarage True Range) que exibe o tamanho em pips ou pontos do ativo. O indicador ATR SIZE ALERT dispara um alerta caso o preço atinja o numero de pips pre definido pelo usuário: Input: Periodo (periodo do indicador ATR) Pips (tamanho do movimento esperado) Alert (alerta sonoro) Além do alerta sonoro, o indicador também possui alerta visual.
FREE

Price and Spread Indicator
Version: 1.0 Developer: Creative Tech Solutions Website: https://www.creativetechsolutions.co.uk
Overview The Price and Spread Indicator is a great tool for MetaTrader 5 that displays the Ask and Bid prices along with the spread directly on the chart. This indicator provides real-time updates and allows traders to make informed decisions based on accurate price information.
Features - Real-time Price Updates: Continuously updates Ask and Bid prices. - Spread Disp
FREE

The GU_H1_120114111_S_Pi_CF_0712_SQ3 is an algorithmic trading strategy for MetaTrader, tested on GBPUSD using the H1 timeframe from April 1, 2004, to April 24, 2024. There is no need to set up parameters, all settings are already optimized and fine-tuned.
Recommended broker RoboForex because of EET timezone.
You can find the strategy source code for StrategyQuant at the link: https://quantmonitor.net/gbpusd-pivots-trend-master/
Key details are:
Parameters
Main Chart: Current symbol and
FREE

Online monitoring of forex accounts fxmon.io The application helps track real-time accounts from your forex terminals Metatrader 4/5 around the clock. List of main features: The state of your accounts in the moment Profitability on each account and on all together Metrics for currency pairs Screenshots of pairs from the terminal Fine-tuning of notifications for any indicators Access to statistics via Telegram, Android app, iOS app
If you use Expert Advisors and robots, this app is for you Monit
FREE

Trader Family EA use multiple custom indicators to determine entry orders and exits. Every order uses a pending order and always uses a take profit and stop loss with a risk reward of 1:1.5, everything is calculated automatically. This EA is suitable for beginners and advanced traders, this EA can be customized according to the risk profile of the trader himself. Requirements and Recommendations Trader Family EA specifically for the USDJPY pair on the H1 timeframe. ( will be optimized for ot
FREE

https://www.sendspace.com/file/hrxcew - REPORT TEST DOWNLOAD
TESTED ON GBPUSD/ AND EURUSD
LOGIC:
Moving Averages Crossover, Macd Historigram and Adx
TRADING SIZE LOTS: (MARTINGALE)
OPENING LOTS START: 0.10
ADD/WINING POSITION: 0.05
PROTECTED ALWAYS WITH STOPLOSS, MAX STOPLOSS LIMITS AND TRAILING STOPS
TRADE WITH RIGHT RULES
/////N!%Drawdown??
///// really ?? you will want something like that for sure.... ALWAYS TRYING CHANGE THE MOTHERFUCKER GAME ...... by: WeeDFoX4_20PT fire like ALWA
FREE

Tradibox Gold is built upon a foundation that combines Bonnitta's unique trading indicator with an advanced proprietary trading algorithm. The Tradibox Gold strategy incorporates a confidential specialized indicator, trend lines, as well as support and resistance levels, all supported by the aforementioned secret trading algorithm.
To make the most of Tradibox Gold, it's crucial to utilize leverage exceeding 100. In my personal experience, I started with an initial investment of 100 USD and a
FREE

This is an EA that is suitable for those of you who want to explore the power of the Moving Average indicator. We created this application to show the advantages of the Moving Average.
MA Period and MA Shift settings are available, so the user can adjust the EA's performance by himself, to suit his needs. The recommended TFs are M1 and M5. Recommended assets are XAU (gold) and GBP.
Because MT5 no longer provides options for Buy_only or Sell_only, we provide the facility to set these trading o
FREE

Non-proprietary study of Joe Dinapoli used for trend analysis. The indicator gives trend signals when the fast line penetrates the slow line. These signals remain intact until another penetration occurs. The signal is confirmed at the close of the period. It is applicable for all timeframes. Parameters Fast EMA: period of the fast moving average. Slow EMA: period of the slow moving average. Signal EMA: period of the signal line. ************************************
FREE

El indicador técnico Non Lag MA (Non-Lagged Moving Average) es una variante de la media móvil que busca reducir el retraso inherente a las medias móviles tradicionales.
Pros: - Menos retraso: Al estar diseñado para reducir el retraso, el Non Lag MA puede proporcionar señales más rápidas que las medias móviles tradicionales. - Tendencias claras: Las líneas del Non Lag MA muestran claramente las tendencias alcistas y bajistas, lo que facilita la interpretación de la dirección del mercado. - Pers
FREE

Tired of adjusting the indicator settings losing precious time? Tired of the uncertainty regarding their efficiency? Afraid of the uncertainty in their profitability? Then the indicator ACI (automatically calibrateable indicator) is designed exactly for you. Launching it, you can easily solve these three issues just performing the simplest action: clicking a single Calibrate button. To achieve the highest efficiency, you should perform another additional action: move the power slider to the maxi
FREE
MetaTraderプラットフォームのためのアプリのストアであるMetaTraderアプリストアで自動売買ロボットを購入する方法をご覧ください。
MQL5.community支払いシステムでは、PayPalや銀行カードおよび人気の支払いシステムを通してトランザクションをすることができます。ご満足いただけるように購入前に自動売買ロボットをテストすることを強くお勧めします。
取引の機会を逃しています。
- 無料取引アプリ
- 8千を超えるシグナルをコピー
- 金融ニュースで金融マーケットを探索
新規登録
ログイン
