YouTubeにあるマーケットチュートリアルビデオをご覧ください
ロボットや指標を購入する
仮想ホスティングで
EAを実行
EAを実行
ロボットや指標を購入前にテストする
マーケットで収入を得る
販売のためにプロダクトをプレゼンテーションする方法
MetaTrader 5のための無料のエキスパートアドバイザーとインディケータ - 31

CATAPULT This is a one-of-a-kind expert based on trend. It is based on the successful grid expert, with the help of a multilayer perceptron, the entry point has been refined. Several auxiliary proprietary indicators have been added. The Expert Advisor opens trades variably. How to use the EA
The EA has been optimized for the best performance. Just attach the EA to EUR/USD chart and let it operate by itself. All the required settings have been considered after careful back testing and live t
FREE

This Price indicator aid you to read prices of a bar without using native MT5 instuments like crosshair.
The indicator gives you the OPEN HIGH LOW CLOSE and 50% bar prices of the current or one of the previous bar.
Parameter setting are: TimeShift: Used for bar selection (0 stand for current 1 for previous 2 for 2 bars ago) Other parameter are using for esthetics. Each Label can be moved away from its initial position.
FEEL FREE TO REPORT BUG AND REVIEW THIS INDICATOR. THANKS
FREE

This utility identifies certain candle open times on chart, this can help you to see your favorite candle open and use it as it fits in your strategy. This tool is very useful for intraday charting and indicating your sessions. ___________________________________________________________________________________
Disclaimer: Do NOT trade or invest based upon the analysis presented on this channel. Always do your own research and due diligence before investing or trading. I’ll never tell you what
FREE

AmA is a completely expert trader base on Starc bands trading. Since this expert is fully automatic, so it does not need to your attention. It opens and close when reach to its target (SL or TP). This expert has been specifically designed for Metatrader 5 and EUR/USD chart in variable timeframe as you wish (1H, 30M, 15M and 5M). By using this expert you can achieve to logical monthly income. You can set your Lot size according to your initial balance. The suggestion for initial balance more tha
FREE

This is a simple indicator type thing to track potential total risk if all the stop losses to be hit. It gives the some of the total stop losses for a certain currency in positions and orders. These are the functions. (I will add more functions later, eg - total profits per symbol etc.) ( Add a comment if you need any feature. I will add it ) Total risk exposure - This is the total risk that can happen if all the stop losses in positions and open orders were to hit. Total positions risk - This i
FREE

The idea behind this indicator is to find all currency pairs that are over-bought or over-sold according to the RSI indicator at one go.
The RSI uses the default period of 14 (this can be changed in the settings) and scans all symbols to find the RSI level you will have specified. Once currency pairs that meet the specification are found, the indicator will open those charts for you incase those charts aren't open and proceed to write the full list of currencies on the experts tab.
FREE

Indicador Maestro del Trader
Características Principales: Spread del Mercado en Tiempo Real : Visualiza el diferencial entre el precio de compra y venta directamente en tu gráfico. Cuenta Regresiva del Cierre de Vela : No más sorpresas al final de la vela. El indicador muestra un cronómetro que te informa cuánto tiempo queda antes de que se cierre la vela actual. ¡Actúa con precisión en los momentos cruciales! Ganancias o Pérdidas en Tiempo Real : ¿Estás en verde o en rojo? El Indicador Maes
FREE

Order Book, known also as Market Book, market depth, Level 2, - is a dynamically updated table with current volumes of orders to buy and to sell specific financial instument at price levels near Bid and Ask. MetaTrader 5 provides the means for receiving market book from your broker in real time. The expert OrderBook Recorder records market book changes and stores them in local files for further usage in indicators and expert adviser, including testing in the tester. The expert stores market book
FREE

High and Low
The indicator marks bars with a simple trend definition“ each subsequent high above/below the previous one and each subsequent low above/below the previous one ”. Charles Dow
Formula:
Max – The current maximum Min – The current minimum MaxK – Maximum per period MinK – Minimum per period
Min>MinK & Max>=MaxK – Symbol on top Max<MaxK & Min<=MinK – The symbol on the bottom
Input parameter:
Number of bars in the calculated history Period for current timeframe The distance
FREE

Gain Guard MT5
secures the profits of all or selected trades on one terminal or on several terminals with the same account number. The selection can be configured according to Magic numbers and/or symbols, so that the Magic numbers and/or symbols that are not selected remain unconsidered. What is it useful for? For example, when several experts trade on one terminal and manual trading also takes place. Experts have different strategies and SL/TP. In particular, some experts let the trades run
FREE

Swiss Holy Grail Indicator Motivation and functioning The HolyGrail indicator serves to optimize an entry. At that very moment I caught myself, that I went short in an uptrend, so I got into a trade in an anti-cyclical way. Or I have entered into a much too mature trend. This indicator should prevent such errors: One should always be aware of whether it is pro- or anticyclic entry, and one must always know about the maturity of the trend. Don't enter an old trend. Linda Raschke advises to buy th
FREE

This is a Price Projection for Current Candle from Time Frame M15 To Weekly, It's shows Market Trends Teji (Bullish) Or Mandi (Berries). It's Show Teji High & Low for Bullish Market and Mandi High & Low for Berries Market. We can Plan Our Trade in Well Advance for our Current Open Trade. It's Generate New Data for Every New Candle. You are requested to Please Test it with demo Ac before Use in Real Trade. Please Save it to your Mql\Indicator folder and attache to your chart. if any quay Please
FREE

This is a multi frame stochastic indicator, you can attach any time frame of stoch indicator on one chart. It is very useful if you like to check multi time frame stoch data. If you are interested in EA,click below links to take a look: https://www.mql5.com/en/market/product/80170 https://www.mql5.com/en/market/product/81136
How to use: > Atach the first time frame you want on to the currency pair's chart > Atach the second time frame you want on to the currency pair's chart > Atach the thir
FREE

Backtesting PRO: Make a review of the market based on the available history of your broker. Practice your strategies and verify them in seconds. Remember to maintain excellent risk management, check your days and hours of operation. R emember to start it in the shortest period to operate. Any questions or suggestions can be sent to this email: autoeducacion0110@gmail.com
FREE

This indicator uses the chart information and your inputs to display the lot size and associated stop for long or short positions. It uses an ATR based percent volatility position sizing calculation. You can use this indicator to learn more about a better position size calculation than a fixed lot system. The indicator adds text directly to the chart to show you the current position size calculation, the risk % input, the ATR Range input, the ATR value from the prior bar, the account equity at r
FREE

Free version. Only works on EURUSD Do you want to always know in a quick glance where price is going? Are you tired of looking back and forth between different timeframes to understand that? This indicator might just be what you were looking for. Trend Signal Multitimeframe shows you if the current price is higher or lower than N. candles ago, on the various timeframes. It also displays how many pips higher or lower current price is compared to N. candles ago. Number N. is customizable The data
FREE

Free version of https://www.mql5.com/en/market/product/44815 Simple indicator to calculate profit on fibonacci retracement levels with fixed lot size, or calculate lot size on fibonacci levels with fixed profit. Add to chart and move trend line to set the fibonacci retracement levels. Works similar as default fibonacci retracement line study in Metatrader. Inputs Fixed - select what value will be fix, lot or profit (available in full version, lot is set on free version) Fixed value - value tha
FREE

Shows various helpful informations lik: ATR (in Pips) Spread (in Pips) Spread in percent of ATR (very helpful when your SL/TP is based on ATR Time left to next candle period Change in percent of last X candles (configurable) Spread warning, when its higher then 1/3 of the ATR Next-candle warning, when it appears shortly (2.5% of period) Please follow me on Twitter https://twitter.com/semager and stay up to date with the newest Indicators and EAs.
FREE

This is a rate of change chart from the baseline. features. comparison of max 5 symbols. free baseline with drag. free timeframes of the sub window. reverse chart selectable if you need.
i.e. set symbols "-US100" notes In the sub window, you can't believe datetime on the chart, because the numbers of bars are different. You can check the baseline if you click symbol name. The dragged baseline is temporary. You must set it to indicator's parameter if you need.
FREE

Индикатор, показывающий момент преодоления нулевой отметки индикатора MACD. Индикатор стрелочный и может быть использован для торговли бинарными опционами.
Входные параметры Period of SMA1 - Период 1 скользящей средней Period of SMA2 - Период 2 скользящей средней Period of SMA3 - Период 3 скользящей средней Inform about finding the signal - подавать уведомление, при нахождении сигнала
FREE

Multi-timeframe trend indicator, based on the ADX / ADXWilder indicator The indicator shows trend areas using ADX or ADXWilder indicator data from multiple timeframes. The impulse mode of the indicator allows you to catch the beginning of a trend, and several "Screens" with different timeframes allow you to filter out market noise.
How the indicator works: if PDI is greater than NDI, then it`s bullish movement; if PDI is less than NDI, then it`s bearish movement; to determine any trend, it
FREE

Donchian通道(唐奇安通道指标)是用于交易突破的最古老、最简单的技术指标之一。 一般来说,唐奇安通道的宽度越宽,市场波动就越大,而唐奇安通道越窄,市场波动性也就越小 。此外,价格走势可以穿过布林带,但你看不到唐奇安通道的这种特征,因为其波段正在测量特定时期的最高价和最低价。 交易实用必备工具指标 波浪自动计算指标,通道趋势交易 完美的趋势-波浪自动计算通道计算 , MT4版本 完美的趋势-波浪自动计算通道计算 , MT5版本 本地跟单复制交易 Easy And Fast Copy , MT4版本 Easy And Fast Copy , MT5版本 本地跟单复制交易 模拟试用 Easy And Fast Copy , MT4 模拟账号运行 Easy And Fast Copy , MT5 模拟账号运行 唐奇安通道指标计算: 唐奇安上阻力线 - 由过去N天的当日最高价的最大值形成。 唐奇安下支撑线 - 由过去N天的当日最低价的最小值形成。 中心线 - (上线 + 下线)/ 2 唐奇安通道信号 唐奇安通道常用作突破指标。它提供了两种主要类型的突破信号,一个是上阻力线或下支
FREE

You may have found after a carefully planned trade something happened. An unexpected event... You forgot to look the web calender or use any kind of program. This fills this gap in its own way. Features: - show all events as vertical lines - low, medium or high events... with different colors. -name of the events and numbers associated with the event are also shown such actual value, forecast value and previous value.
The calendar information is obtained from your broker. It is a built-in ser
FREE

The Indicator indicator draws 2 clouds based on Bollinger Bands indicator values. The upper cloud is formed by the upper lines values and the lower cloud by the lowers lines values. The indicator allows to change the Bollinger Bands parameters and the clouds colors the period of the base line and the deviations of each Bollinger Bands instance. The indicator holds 5 buffer index as follow: [0] - Outer values of the upper cloud [1] - Inner values of the upper cloud [2] - Base/Center line values
FREE

Thank you for your interest in The Tail.
I have been trading since 2018. Or rather, it’s not me who trades, but the army of my robots, which I constantly develop. Tail is one such candidate.
This robot works on moving averages, filters trades by RSI.
The robot provides the functionality of volume and position control.
Combine different approaches. I recommend using it in a group of 3-5 of the same robots on different instruments for the best result.
I recommend keeping a high value of
FREE

The CandleStick Scanner is a tool that allow you to perform a market scan and search any candlestick pattern that you already created in the current chart, You can perform a quick search in the current chart (500 bars will be scanned), This is a lite version of CandleStick Factory for MT5 . The full version video can be found here : https://www.youtube.com/watch?v=fq7pLXqVO94 The full version can be purchased here: https://www.mql5.com/en/market/product/75434
How it works You ca
FREE

Indicator for "screenshoting" the chart at a specified interval. The files are saved in the " MQL5\Files\ScreenShots\Symbol TF\ " directory and named as the date and time the screenshot was taken ( 2017.06.20 23.56.24.png ) Settings: Width and Height — width and height of the saved screenshots, IntervalSeconds — the saving interval in seconds. Attention ! If you set a large size for screenshots and a high frequency, you may run out of space on the hard drive. Do not delete the folder where the s
FREE

specific purpose: Export trading varieties in the market quotation to a table file, which is convenient for users to use EXCEL to analyze trading varieties, and find and select suitable trading varieties faster and more convenient. If you want all trading varieties, you can go to Market Quotation -> Trading Varieties -> Right-click -> Show All, so that you can download all trading varieties. Parameter Description: Cycle, you can choose M1, D1, W1, MN, etc., the default is D1, analyze the daily
FREE
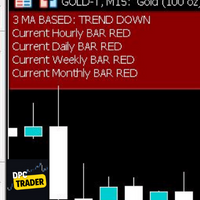
This Utility Bot is for New Traders, that struggle to spot the Trend direction. It also make you conscious about different Timeframes Bar Status. Utility have 3 Moving Averages totally configurable by input parameters. 3MA Based Trend is shown for the current Timeframe selected on the chart. (Line 1) 3MA Based Trend for Daily Timeframe. (Line 2nd) Also provide quick information about the currently Hourly Daily and Weekly Candle Status. Utility work on 1 Min Bar control, so comment section info
FREE

The indicator calculates the inclination angle between the Highs, Lows and Closes of adjacent bars. The angle can be measured in degrees or radians. A linear graph or a histogram is drawn in a subwindow. You can set the scale for the calculation — floating or fixed. For use in Expert Advisors or indicators, you need to specify a fixed scale.
Parameters Angular measure — degrees or radians. Scale mode for calculation — scaling mode. Free scale — free transformation, the indicator will calculate
FREE

All in one Multipurpose Telegram Trade Management , Manage and Copy Trades on the go From Telegram Pro Version MT5: www.mql5.com/en/market/product/95742 Pro Version MT4: www.mql5.com/en/market/product/85691
Execute Trades on mobile with fast execution When away from desktop MT5, or scalping the market with mobile device, or needed to copy trades from telegram groups while away, or doing some other activities, Telegram EA Manager is an effective tool to perform any trade operation with swi
FREE

Manual Trading Panel is a simple, efficient and intuitive graphic tool that provides a controls to open, close and manage all your orders in MetaTrader 5. It is very useful in case you have to interact with other EA adding another position or delete all positions in a specific direction or all of themes. This EA can not be tested on strategy tester. In case of usage please try its functions on demo account before running on live trading. Functions presented to this version: Interacts only with p
FREE

It is the simplest indicator in existence. It has only one function: report the seconds elapsed since the last minute end in a very convenient way, with a label that can be moved in the chart, so that the trader does not have to take his eye off the forming candle. It is used on M1, but also on larger intervals, for those interested in opening/closing positions at the best time. Sometimes an intense movement in the last 10" of the minute gives indications of future trend, and can be used for sc
FREE

The Co-Pilot is a simple trade management system designed to be the quickest way from your strategy to the market. It is optimized for single trade setups that might be short, medium or long term. The program allows you to set your trade setup directly from the chart using graphical objects, set your risk apetite and even provides oppurtunity for partial closes. It also has a built in alert system that keeps you informed on the actions taken by the copilot when youre offline.
It is designed to
FREE

It is the very same classic Stochastic indicator, but with a little twist: NO NAME and data is shown in the sub window. It could be stupid, BUT, if you are running out of space in Micro windows like Mini Charts, where the indicator's name is totally useless, you came to the right place. And that's it! I know it seems stupid but I needed the classical version of Stochastic indicator without that annoying name on my Mini Chart, so I did it that way... The original formula is right from Metaquote's
FREE

Indicador Regressão Linear – Par de Ativos - INTRADAY Indicador é um oscilador que faz o plot do Resíduo resultado da regressão linear entre os dois ativos inseridos como input do indicador, representado pela fórmula: Y = aX + b + R Onde Y é o valor do ativo dependente, X é o valor do ativo independente, a é a inclinação da reta entre os dois ativos, b é a intersecção da reta e R é o resíduo. O resíduo representa a quantidade da variabilidade que Y que o modelo ajustado não consegue explicar. E
FREE

The Commitments of Traders Ratio Indicator is one of these things you never thought about it before you really see the magic behind it. The indicator shows the Ratio of long/short positions released by the CFTC once a week.
If you have a look on the Sreenshot you can see two (three) zones of interest. Important note: MAs are not available in version 1.0. Zone 1: The Switches (Red -> Green, Green -> Red) Zone 2: MA cross Zone 3: If you combine this with the COX indicator an additional zone will
FREE

Adds the symbols listed in Binance Future to Metatrader5
With this free file, you can list the entire list right away. You can easily install it on your demo account It is the first file to be uploaded for Binance Future Tick and is offered for free.
Tools menu / Options / Expert Advisors / You need to select Use WebRequest for listed
You can watch videos to add metatrader
FREE

Indicador Regressão Linear – Par de Ativos Indicador é um oscilador que faz o plot do Resíduo resultado da regressão linear entre os dois ativos inseridos como input do indicador, representado pela fórmula: Y = aX + b + R Onde Y é o valor do ativo dependente, X é o valor do ativo independente, a é a inclinação da reta entre os dois ativos, b é a intersecção da reta e R é o resíduo. O resíduo representa a quantidade da variabilidade que Y que o modelo ajustado não consegue explicar. E os resíduos
FREE
"AV Preview MT5" is an Expert Advisor designed to make it easier to view my MT5 demo indicators. Some of them need trades, which is why this EA carries out a few trades based on simple logic.
These indicators can be turned on or off:
- "AV Trade History MT5" (requires trades)
- "AV Grid MT5"
- "AV Monitor MT5" (requires trades)
- "AV Stop Hunter MT5"
- "AV SuperTrend MT5"
- "AV Donchian Channel MT5"
- "AV Forecast MT5"
Instructions:
- Download the desired demo indicators (a
FREE

このスクリプトは、さまざまなウィンドウ関数の重みを評価するように設計されています。これらのウィンドウ機能に基づいて構築されたインジケーターは、 https://www.mql5.com/ru/market/product/72160 からダウンロードできます。 入力パラメータ: iPeriod –インジケーター期間。 iPeriod> = 2 iCenterは、ウィンドウ関数の中心が配置される参照のインデックスです。デフォルトでは、このパラメーターは0です。ウィンドウの中心はインジケーターの中心と一致します。 1 <= iCenter <= iPeriodの場合、ウィンドウ関数の中心がシフトし、その結果、インジケーターのいくつかの特性が変化します。図1では、中心の選択がウィンドウ機能とインジケーターの表示にどのように影響するかを確認できます。このパラメータは、0.5刻みで変更できます。 Histogramwidth-ヒストグラムの幅。 Histogramcolor-ヒストグラムの色。 Showduration-期間を表示します。 スクリーンショット-このオプションを有効にすると、画像
FREE

The RSI (Relative Strength Index) scanner is a powerful technical analysis tool designed to help traders and investors identify potential trading opportunities in the forex, stocks, and cryptocurrency markets. RSI is a popular momentum oscillator that measures the speed and change of price movements and helps determine overbought or oversold conditions in an asset. The scanner takes advantage of this indicator to streamline the process of finding trading signals and opportunities. The RSI value
FREE

IN DEMO VERSION, "CLOSE BY PIPS & ALERTS" ARE DISABLED. FOR COMPLETE ACCESS PLEASE BUY. : https://www.mql5.com/en/market/product/58097 FIRST 10 COPIES AT 30 USD, NEXT PRICE WOULD BE 50 USD RISK AND TRADE MANAGER RISK AND TRADE MANAGER is an advanced trading panel designed for manual trading. Utility helps to manage trades effectively and efficiently with a single click. You can also try our high probability indicator HAWA Price Action HAWA Price Action WITH 90% WIN RATE
MT4 VERSION:
https
FREE

The Time End bar by MMD is a simple indicator that shows the number of seconds remaining in the three selected intervals. According to the MMD methodology, the moment when a directional price movement occurs is important. This indicator allows you to use this relationship more effectively in Forex and Futures trading.
Functionality description:
Time Frame 1 Period - defining the first time interval Time Frame 1 Color - specifying the color for the first time interval Time Frame 1 Period - d
FREE

RSI magic kjuta trial is the demo version of RSI magic kjuta.
Custom Indicator (RSI magic kjuta) based on the standard (Relative Strength Index, RSI) with additional settings and functions. The maximum and minimum RSI lines on the chart have been added to the standard RSI line. Now you can visually observe the past highs and lows of RSI, and not only the values of the closing bars, which avoids confusion in the analysis of trades. For example, the EA opened or closed an order, but the RSI l
FREE

Exp Crassula expert Advisor can start working with a minimum Deposit of 20$
You can enable it on other timeframes and currency pairs by first testing and selecting the parameter the minimum size for the calculation in paragraphs. it is recommended to use from 50 to 500.
It is possible to use a martingale.
The free version is released so that you can test the expert Advisor in real time.
1.unlike the paid version, the expert Advisor trades 2 days a week, on Tuesdays and Thursdays.
2. in th
FREE

This expert advisor joins 18 strategies on crosses and changes, each of them identify a gap on specific custom sessions and try to close the gap. All the parameters are in the code so you can select only the size used for each strategies the base magic number: the real magic numbers used strating from base+1 to base+18. You can specify also the "Suffix" parameters, a special char following the name of the cross in some brokers (eg: EURUSD. EURUSD# EURUSDm) You can also activate/deactivate eve
FREE

Script to create arrows and lines on chart of history positions traded on account for the symbol where you launch the application. From inputs you can select: - Magic number (default is -1; -1 = all magics number) - "From" date and time (default is 1970.01.01 00:00; all positions) - "To" date and time (default is 1970.01.01 00:00; all positions) - Color for buy open positions (arrows and lines between open and close) - Color for buy closing positions (arrows) - Color for sell open positions
FREE

This creates a mean-reversion chart using a moving average as a reference, detaching ourselves from the changing value of fiat currencies. [ Installation Guide | Update Guide | Troubleshooting | FAQ | All Products ] Get a mean-based view of the market Find real overbought/oversold situations easily Isolate your perception from the changing value of fiat currencies The center line represents the moving average Your imagination is the limit with this indicator Customizable chart period and Bolling
FREE

New candlestick alert, the alert appears according to the timeframe it is placed on. The indicator works on any asset, the alert can be silenced at any time, without the need to remove the indicator from the graph. It's great for those who can't keep an eye on the chart all the time. You can use this tool at work, college or anywhere else. It is also possible to receive signals directly on your cell phone by connecting to the metatrader. Aurélio Machado.
FREE
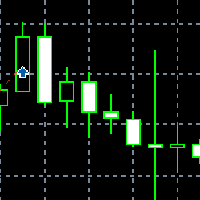
Application with Close Button.
Program include parameters to change settings:
Robot work with Symbols: - All Symbols - Current Chart Symbol
Transaction close (Profit/Loss): - All - Close Profit Only - Close Losing Only
Retries - max retries to close all transaction Sleep - time in ms between next Retries
Robot is free.
Robot designed for learn publish robots in Market.
FREE

This indicator can be used to study the repeating daily volatility structure, and also find deviations from the historical means. Black line tells the average volatility of current hour from last 30 days. Blue bands tell the confidence interval (2 times standard deviation). Red line tells the current volatility, ATR.
Inputs: - days: the number of days where to calculate the average volatility - atrp: the ATR period used to measure volatility
FREE

NoLoser是根據信號產生器做出交易決定後再根據現有的資金量調整下單的單量 只支持歐美貨幣對使用
NoLoser設計目的希望所有參與交易的交易者,都能夠獲取合理的利潤 值得注意的是,過去的歷史回測匯或許會有相當大的利潤發生.但是將來的行情型態是不可知的.所以不要盲目地相信EA會創造出絕對的利潤,但也不要一昧地認為自動交易就是不可取的
特點 自適應的交易信號: 根據市場狀況自動調節信號產生的條件 自適應的單量計算: 根據現有資金狀況調整可以進場的單量.資金量高的時候,獲利隨之增加,反之資金量減少時,虧損隨之減少. 簡單的設定方式: 只需簡單的設定,調整信號的計算範圍即可.
啟動資金必須在2000美金以上 才能確保交易帳戶的安全
購買後聯繫賣家,可提供進階的工程版,可以做更完整的歷史測試.
FREE

これは、リアルタイムバイナンス先物ティックデータとリアルタイムバイナンススポットティックデータを処理するためのユーティリティです。 データをより高速にプルし、BinanceFutureの境界内にとどまるように設計されています。
動作ロジック:グローバル変数は、Binance Check ServerTimeから受信した時間情報を記録します。
他のプログラムでは、この時間情報を使用して、より速く、より効率的に作業を行います。
[ツール]メニュー>> [オプション] >> [エキスパートアドバイザー]からWebRequestを許可し、URLを追加する必要があります:https://api.binance.com 設置時や販売後に問題が発生した場合は、お気軽にお問い合わせください。
FREE

A unique professional tool is a divergence/convergence indicator between AC and price, which allows you to receive a signal about a trend reversal in a timely manner or catch price pullback movements (depending on the settings). It is indispensable for those who trade divergences manually or with an Expert Advisor. The indicator settings allow you to adjust the strength of the divergence /convergence due to the angle of the AC peaks and the percentage change in price, which makes it possible to
FREE

The Relative strength index is an oscillator that follows price, it was introduced by Welles Wilder, who went on to recommend the 14 period RSI. This adaptive version is based on the indicator described by John Ehlers, in the book 'Rocket Science for Traders'. The indicator uses the homodyne descriminator to compute the dominant cycle. To apply the homodyne descriminator, real and imaginary parts have to be calculated from the Inphase and Quadrature components. (Inphase and Quadrature components
FREE
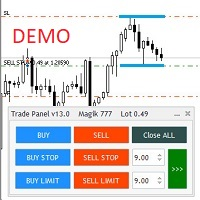
Бесплатная версия советника Trade Panel PRO
Данная торговая панель предназначена для быстрой и удобной торговли в один клик. Создавался продукт для частичной автоматизации своей личной ручной торговли https://www.mql5.com/ru/signals/1040299?source=Site+Profile+Seller Советник имеет ряд возможностей, а именно: Открытие BUY или SELL ордеров. SL выставляется ниже (выше) минимальной (максимальной) цены, задаваемых в параметрах количества свечей. Размер TP рассчитывается в соотношении от размера
FREE

To calculate strength of currencies and to show in table There is 1 parameter: . Show recommended pairs: true/false -> To show top 1 of strong and weak currency Tips to trade: . To trade only with strongest vs weakest currency . When H1, M30, M15, M5 of specific currency is up or down -> consider to open BUY/SELL . It can combine: + strongest currency vs weakest currency + strongest currency vs 2nd weakest currency + 2nd strongest currency vs weakest currency
FREE
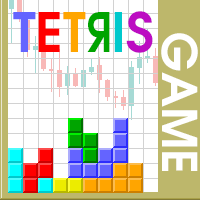
The Tetris — the most famous time killer is now on MT. Game develops active logic, attention and speed of decision making. This is a classic version of the game, no frills, but you can still adjust the size of the glass, the scale of the game, the color of the figures, and the desired speed. The game is made as an indicator. Control Keys: 'W,A,S,D' or 'Cursor' or 'NumPad'. S — Start new game. C — Continue previous game. P — pause on / off. Space — drop a figure. Esc — exit to menu.
FREE

WalkForwardDemo is an expert adviser (EA) demonstrating how the built-in library WalkForwardOptimizer (WFO) for walk-forward optimization works. It allows you to easily optimize, view and analyze your EA performance and robustness in unknown trading conditions of future. You may find more details about walk-forward optimization in Wikipedia . Once you have performed optimization using WFO, the library generates special global variables (saved in an "archived" file with GVF-extension) and a CSV-f
FREE
This utility exports candle data which you chosed by input parameter to CSV file. Time Frames: M1,M5,M15,M30,H1,H4
Inputs:
StartTime: Start time for exporting data. EndTime: End time for exporting data. DataType: Close, Open, High, Low, Median(HL/2), Typical(HLC/3), Weighted(HLCC/4), Pip(H-L). DecimalSeperator: Decimal seperator for candle price data. (Default = ".") CSVDelimiter: Delimiter character for CSV file. (Default = ";") * This utility exports candle data horizontally. That
FREE

This is a demo version of the Candle Absorption Full indicator. It has limitations on operation. This indicator detects the Engulfing candlestick pattern and draws the corresponding market entry signal.
Features It works only with EURUSD on timeframes M1 and M5. The indicator analyzes a combination of 2 or 3 candlesticks depending on settings. The number of pre-calculated bars (signals) is configurable. The indicator can send an alert to notify of a found signal. Signal can be filtered by sett
FREE

Recomended broker: https://tinyurl.com/5ftaha7c Indicator used to monitor price fluctuations in the market and discover possible reversals through reversal points or divergences in the indicator. All assets and all timeframes. SEE OUR RESULTS ON INSTAGRAM: https://www.instagram.com/diogo.cansi/ TELEGRAM GROUP = https://t.me/robosdsc More information by email dscinvestimentos@gmail.com or by Whatsapp 55-991372299
FREE
Botti Tools features
1 - Automatically places Take Profit and Stop Loss values, previously defined, in Pending Orders and in Market Positions
2 - Based on the amount of Stop Loss points defined and the specified monetary value it calculates what volume should be used for that order.
3 - After X points he puts the order on breakeven
4 - It cancels the Take Profit at X points away from it and places the Stop Loss in such a way as to guarantee Y gain points
5 - If the fourth option
FREE

The Detective Pips EA is an automated hands-free tool that trade pending order breakout at previous high and low strategy. This EA is also a non-Martingale and Hedging Mechanism by which most traders are comfortable with, profits are secured by the adjustable trailing stop. Also, this strategy works with small average profits therefore it is highly suggested to trade with a low spread and commission broker. This EA is a great day trading scalping Project that are able to trade both trending and
FREE

Ever thought of your broker stop hunting your stop losses? Incognito SL and TP is exactly what you need! As promised, version 1.1 now has the SL and TP lines that can easily be adjusted by the user. ========================================== INPUTS: SL: Exact price you want the orders for the chart symbol to close when this SL price was hit. Set to 0 for no SL. TP: Exact price you want the orders for the chart symbol to close when this TP price was hit. Set to 0 for no TP. ======================
FREE
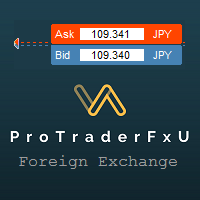
Description: - BidAskLine Indicator is very simple and easy, but each utility can be important in the probability that we will win in our trade. This utility Indicator shows lines and prices of the Bid, Ask and Spread. Input Parameters: - Visual Aspect Options : Select between 2 options with Box or Simple Style. - Parameters Bid Price : Select between show or hide line or box objects, change color, style or width line. - Parameters Ask Price : Select between show
FREE

パラボリックのデータをもとにトレンドの方向性を1分足から月足まで表示します。 1分足から 月足 まで表示されているので今どの方向に価格が動いているのかがすぐに分かります。
更新はティク毎ではなくディフォルトでは1秒毎、もちろん変更も可能なのでチャートの表示が遅くなるようなことはありません。
機能:
どの通貨でも表示可能になります。
アイコンの色を指定することが可能になります。
表示位置(X軸、Y軸)が変更可能 になります。
表示位置 (左上 、 右上 、 左下 、 右下) が 指定 が可能 になります。
フォント を指定することが可能になります。
フォントサイズ が 変更可能 になります。
アイコンのサイズ が 変更可能 になります。
週足、 月足 の非表示 が 可能 になります。
FREE

The indicator measures and displays the difference in the number of "Bid" and "Ask" prices changes in the form of digital, analog and graphic indicators. Designed for market research and for determine the moments of position closing during scalping trade with H1 or less timeframe. Use with bigger timeframe is not prohibited, but it is not informative because of a large number of accumulated values. Theory
"Bid" and "Ask" prices do not change simultaneously for most symbols. Often you can see h
FREE

The Equity Curve indicator is a simple and helpful tool that shows the development of the equity curve in real time. For precision measurement, it should be used in a separate window with a period of M1.
Main features The indicator shows the development of the equity curve in real time. High precision on the minute chart. High-speed calculation. Available for MT4 and MT5. Please visit the Equity Curve indicator product page for the input and output parameters settings.
FREE
MetaTraderマーケットは自動売買ロボットとテクニカル指標を販売するための最もいい場所です。
魅力的なデザインと説明を備えたMetaTraderプラットフォーム用アプリを開発するだけでいいのです。マーケットでプロダクトをパブリッシュして何百万ものMetaTraderユーザーに提供する方法をご覧ください。
取引の機会を逃しています。
- 無料取引アプリ
- 8千を超えるシグナルをコピー
- 金融ニュースで金融マーケットを探索
新規登録
ログイン