YouTubeにあるマーケットチュートリアルビデオをご覧ください
ロボットや指標を購入する
仮想ホスティングで
EAを実行
EAを実行
ロボットや指標を購入前にテストする
マーケットで収入を得る
販売のためにプロダクトをプレゼンテーションする方法
MetaTrader 4のための有料のテクニカル指標 - 87
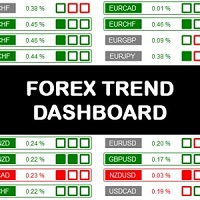
The Forex Trend Dashboard is a truly exceptional tool for analyzing and operating the choice of which exchange to try to trade. The analysis of currency baskets allows you to better understand the real situation of the market and better evaluate your own operational ideas. The dashboard analyzes the trend over different time horizons such as: daily, weekly and monthly. The resulting considerations are very simple, the session opening price and its strength condition are analyzed by recognizing t

初心者またはプロフェッショナルである当社のベストセラーのマルチタイムフレームPivotProfは、スペシャリストが使用するサポート層とレジスタンス層を使用して、売買を美化し、一流の変更の可能性を提供します。ピボットの売買は、主要な範囲で市場に出入りするための簡単で優れた手法であり、当局によって長い間使用されており、外国為替、暗号、株式、インデックスなどのすべてのシンボルで機能します。ピボット教授がトップをもたらします市場が反応する可能性が最も高い場所であるディーラーへのレートティア。これは、ディーラーが市場に出入りし、大規模な最終損失やドローダウンを回避することを望んでいるまさにその要素です。
17の特定の時間枠全体から、シンボルごとに120度以上のデータを計算し、同時に表示する、他に類を見ないアルゴリズムを備えた豊富な機能。すべてがユニークで整頓された使いやすい形式で表示され、端末、電子メール、携帯電話のスマートフォンアラートが付属しています。さらに、全体がカスタマイズ可能です...数式、表示、信号など。
売買スタイルは数えられません。PivotProfを使用して、これらの

This tool provides a freehand drawing method, to treat the chart space as a blackboard and draw by-hand. Drawings can be made to stick to the CHART (moves with chart scroll), or to stick to the WINDOW (does not move with chart scroll).
Features: all drawings are individually styled, color, width
show/hide each drawing type
delete last drawing drawings, on chart and on window, remain through TF changes and terminal re-starts, until the indicator is removed
Panel: stylable colors scalable in
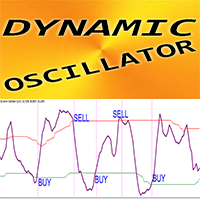
ダイナミック オシレーター - 高度なカスタム インジケーター - MT4 用の効率的な取引ツールです。 新世代のオシレーター - 使い方を写真で確認してください。 ダイナミックオシレーターには適応可能な売られ過ぎ/買われ過ぎゾーンがあります オシレーターは売られ過ぎ/買われ過ぎの領域から正確なエントリーポイントを見つけるための補助ツールです 売られ過ぎの値: 緑の線より下。 買われ過ぎの値: 赤い線を超えています 標準の発振器よりもはるかに正確です。
// さらに優れたエキスパートアドバイザーとインジケーターはここから入手できます: https://www.mql5.com/en/users/def1380/seller // また、収益性が高く、安定していて信頼性の高いシグナル https://www.mql5.com/en/signals/1887493 に参加することも歓迎します。 当MQL5サイトのみでご提供しているオリジナル商品です。

My indicator is a great helper in the forex market. It shows possible market reversals with absolute accuracy. My indicator does not redraw and does not change values when switching timeframes. It works perfectly on all timeframes and can become a key indicator in your strategy. I would like to note that flexible indicator settings allow you to adapt the indicator to your strategy and can make a big contribution to your profitable strategy, although everything is already laid down in this indica
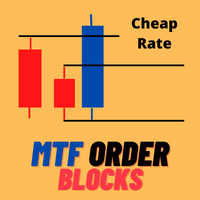
Cheap Rate limited COPIES HURRY UP! 5 LEFT COPIES Very precise patterns to detect High Accurate Order Blocks: It Draw zone after market Structure Breakout with a high Accuracy, institutional orders with the potential to change the price’s direction and keep moving towards it, have been placed. Features Auto Order Blocks Draw MTF Order Blocks Double Signal One Alert Signal Second Long Wick Rejection Signal Market Structure BOS LINE This Indicator is limited features if you want full Feature
ADX Pro Indicator This Indicator Are Advanced Pro ADX Indicator Multi Time Frame Are Same Window Multi Currency Are Same Windows All Time Frame And All Currency ADX Strenght Are Same Window Monitring You Will Add Manully All Currency Pairs , And Metel , And Also Crypto Currency Pairs : EURUSD , GBPUSD, USDJPY .... Etc , Metel : XAUUSD , XAGUSD ... Etc , Crypto : BTCUSD, ETHUSD... Etc
Hello; The product offers high quality trend tracking. Thanks to the arrows on the graph, you can easily follow the entry and exit signals. It provides ease of use thanks to a single input parameter. You can easily follow the signals thanks to the alarm options. Moreover, trend color lines provide convenience in determining the trend direction. Input parameter setting: Periodic: Indicates the number of bars that need to be calculated.
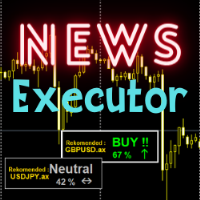
Several indicators are summarized in one display conclusion. Highly recommended indicator for all traders even beginners. You only need to make transactions according to the recommendations displayed by the indicator. It's obvious for trading news with big effects though. Trading is all about money, so love your money and make a profit with our tools. Trading recommendations on news on major currencies

Balance Weighted Moving Hedge System- is the trend following manual system for forex/crypto market. Indicator represents custom balance-weighted moving average indicator. The main advantagies : very stable moving with really early signals, defines current trend power, ignores market noise. The more width of indicator line - the more expressive trend is. On the other hand thin moving line shows unstable / choppy market. Indicator can be used as single b alance weighted moving or with hedge strate

Master Trend Signal Indicator
TimeFrame - 15 Mins & More
Pairs - All Forex Currency Pairs , Gold , Silver , Crypto, Stock
Once Trend Is UP Cross The Yellow Line, It's Show Colour For Green
Once Trend Is Down Cross The Yellow Line, It's Show Colour For Red Easy TO Identify Trend Strength ON Trading For Scalping, Intraday Trading 5 Purchases left & The Price Increases

В основе индикатора EasyBands лежит тот же принцип, что и при построении Bollinger Band. Однако, данная модификация индикатора использует вместо стандартного отклонения средний торговый диапазон (Average True Range). Соответственно, с данным индикатором абсолютно аналогично можно использовать все стратегии, которые применяются с Bollinger Band. В данной версии индикатора используется двенадцать уровней и средняя линия (белый цвет). Индикация тренда выполнена в виде окраски свечей в зависимости
Golden Scalping & Day Trading Signal Indicator You Can Enable Or Disable Scalping Signal Option Once Enable For Scalping More Order Signals Option Or Disable For Scalping Option Intraday Signal Option Pairs : XAUUSD, XAGUSD - EURUSD, GBPUSD,USDJPY, AUDUSD, USDCAD, BTCUSD , USDCHF, GBPJPY Time Frame : 15 Mins, 30 Mins , 1 Hour 5 Purchases left & The Price Increases

UR モメンター
UR Moenter は、オシレータとして表される価格変動の枯渇に相関する価格のモメンタムを完全に計算します。 したがって、これは潜在的な反転またはリトレースメントの本当に初期のシグナルを提供します. この公式は、2018 年に市場バブルが崩壊した後に発見されました。
UR Moenter を使用する利点:
パラメータなし 価格の動きを表す 2 本の線があります。白線は、オシレーター (青い線) として表される価格の移動平均偏差と相関する価格のモメンタムです。 ヒストグラムは、価格の勢いに応じた最大偏差を視覚化したものです インターフェースは、両極端 (上部の赤と下部の緑の領域) のいずれかの線の枯渇を示しています。 最大の利点: 簡単で、すべてのアセットに合わせて調整できます。 ツールの最新情報を入手できる特別な電報チャットがあり、何か不足していると感じた場合はリクエストを送信することもできます!
UR モメンターを選ぶ理由
このインジケーターは、スタンドアロンのエントリーまたはエグジット インジケーターとして使用できます。 価格に依存

数列の一つに「森林火災数列」があります。これは、最も美しい新しいシーケンスの 1 つとして認識されています。その主な特徴は、このシーケンスが線形トレンドを回避することです。最短のものであってもです。この指標の基礎を形成したのはこのプロパティです。 財務時系列を分析する場合、この指標は可能なすべての傾向オプションを拒否しようとします。そして失敗した場合にのみ、トレンドの存在を認識し、適切なシグナルを発します。このアプローチにより、新しいトレンドの始まりの瞬間を正しく判断できます。ただし、偽陽性の可能性もあります。それらの数を減らすために、このインジケーターに追加のフィルターが追加されました。新しいバーが開くとシグナルが生成されます。いずれの場合も再描画は発生しません。 指標パラメータ: Applied Price - 適用価格定数; Period Main - インディケータのメイン期間、その有効な値は 5 ~ 60 です。 Period Additional - 追加の期間。このパラメーターの有効な値は 5 ~ 40 です。 Signal Filter - 追加の信号フィルター、有効
Gold Scalping Pro Signal Indicator Pairs : XAUUSD, XAGUSD, Crude OIL , BTCUSD, ETHUSD, EURUSD, GBPUSD, USDJPY, AUDUSD, USDCHF, GBPJPY Setting : Once Market Are Up And Down Side , The Indicator Are Provide Buy And Sell Order Push Notification Time Frame - 5 Mins, 15 Mins, 1 Hour, 4 Hour Additional : You Have Also Trade Manual , Once Trend Power Is Up , Enter Buy Or Trend Power is Down, Enter Sell
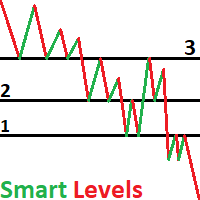
NOTE: T he indicator in demo version will not work as it requires the specific preset and if in future you don't see recent numbers drawn on your chart then please contact us for recent calculated preset file
This is smart money levels , just see the pictures how the pair reacts to our calculated numbers
The indicator can be used with any timeframe but to match the institutional traders we recommend H4 or D1 charts
Allow DLL imports must be turned on, as the indicator requires to be conn
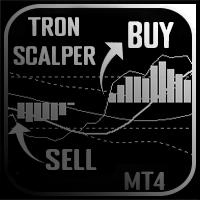
Tron Scalperは、スキャルピングのために設計された新しい著者の指標です。
標準的な、専有用具の全範囲の読書に基づいて信号を与える表示器。
トロンのダフ屋の主な特長: 分析関数
これは、任意の通貨ペアと時間枠で使用することができます; インジケーターは再描画されません; それは他の指標に大きな追加です; グラフィカルな機能
チャート上の最小位置数を占めています; 柔軟性のあるチンキ; 簡単に学ぶことができます; Tronダフ屋はから成っています。..
青い線はRSIインジケータです; オレンジ色のラインは、T3RSIに基づく統合RSIインジケータです; 点線-ボリンジャーバンドの境界線; 青い線はボリンジャーバンドの中央線です; トロンのダフ屋の主な特長:
フィルタリングのための指標のセットを持っています; 指標自体は、いつ市場に参入する必要があるかを示しています;
トロン-ダフ屋の基本設定: RSI期間-RSIの青い線を設定する;
バンド期間-点線の調整;
MA期間-移動平均の設定;
バンド偏差-バンド偏差;

Note: The PRICE IS SUBJECT TO INCREASE AT ANY TIME FROM NOW!! DON'T MISS THIS BEST OFFER.
Dear traders once again I am very glad to introduce to you my another trading tool called "Trend Hunter Indicator". This indicator is designed to help traders capture the trend from the beginning or the end of it. It is one of the indicator that if used wisely may help you improve in your trading decisions.
Timeframe
The indicator is for all timeframes
Pairs
The Indicator is for all pairs.
Mar

HEIKEN PLUS is the only indicator you really need to be a successful trader , without in depth knowledge of the forex trading or any tools. Also there is automatically trading MT5 EA available now: https://www.mql5.com/en/market/product/89517? with superb SL/TP management! and sky high profit targets ! MT5 ONLY !
For Metatrader5 version visit: https://www.mql5.com/en/market/product/83761?source=Site
Very suitable tool for new traders or advanced traders too.
HEIKEN+ is a co

DESCRIPTION Investing indicator help you get signal like Technical Analysis Summary of Investing.com When have signal strong ( Strong buy or Strong sell) at Time Frame M5, M15, H1, The Alert will announce to you HOW TO USE When have signal , you can entry Order and set TP & SL appropriately Recommend : This indicator also Technical Analysis Summary of Investing.com is suitable for medium and long term trading

UR フロントエンドバックエンド
UR FrontEndBackEnd は、サポートとレジスタンスの最も正確なレベルを見つけるための私のお気に入りの公式です。 また、それらをさまざまなカテゴリ (破線、実線、および領域) に分割して、その強度を示しています。 すべてがバッファに格納されるため、簡単にアクセスして他のツール内で実装できます。
追加: ツールは、適用される資産に合わせて調整する必要がある場合があります。資産は、ツールに影響する価格の桁数に関して異なります。 そのために必要なパラメーターは、設定で提供されます。
UR FrontEndBackEnd を使用する利点:
計算の密度と距離を設定するための 2 つのパラメーターのみ サポートとレジスタンスはバッファ内に保存され、指定された資産の価格から上昇/下降します サポート/レジスタンスラインの強さをすばやく視覚的にフィードバックするための 3 種類のライン -> DASHED、SOLID、AREA ツールの最新情報を入手できる特別な電報チャットがあり、何か不足していると感じた場合はリクエストを送信

The Cycle Identifier MT4 indicator is a great choice of custom indicator for both short-term and long-term traders. The Cycle Identifier MT4 generates filtered price action signals to assist traders to identify when the conditions are right to open buy and sell positions. How it works The Cycle Identifier MT4 indicator displays on a separate indicator chart below the main chart where it draws an oscillating gray line. This gray line is characterized by upward and downward spikes that are accompa
This indicator is used to show the PERFECT TREND . All Time Frame charts are available. The trend is determined based on the Cycle, Price and Volatility. This Trend Indicator will give 5 output values: Cycle Period: 48 is default
Graph Place: 0 Means Main Windows - 1 means Sub Windows (you can use in your indicator)
NumBars: you can decide how many older Bar use
Short Trend Color : You can decide which color to use for Short Trend
Long Trend Color : You can decide which color to use for Lo
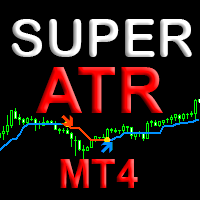
Индикатор Super ATR MT4 предназначен для определения математически оправданного размера стоплосса и тейкпрофита. В расчете алгоритм использует заданные фракталы рынка текущего таймфрейма. Размер минимального стоплосса определяется по среднему размеру свечей ATR ( Average True Range ), а максимальный тейкпрофит определяется по FATR ( Fractals Average True Range ) - среднему размеру цены между противоположными фракталами на графике. Особенности Авторский алгоритм определения среднего фрак

Awesome Oscillator by Bill Williams with the ability to fine-tune and replace the averaging algorithms of the indicator, which significantly expands the possibilities of using this oscillator in algorithmic trading and brings it closer in its properties to such an indicator as the MACD. To reduce price noise, the final indicator is processed with an additional Smooth averaging. The indicator has the ability to give alerts, send mail messages and push signals when the direction of movement of th

What is 2 Line MACD Indicator MT4? The 2 Line MACD Indicator, in short, is a technical indicator that assists in identifying the trend as well as its strength, and the possibility of the trend reversal. It is a widespread forex technical indicator that is made of three essential components, i.e. 1. MACD histogram
2. MACD: 12-period exponential moving average (12 EMA) – 26 period EMA
3. MACD Signal Line: the 9-period EMA of the MACD. This Indicator is one that ensures a trader stays profitabl

3C JRSX H Indicator represents a trend-following forex trading oscillator that signals for both market trends and its possible swing areas. Besides, it supports all sorts of timeframe charts available within the forex MT4 platform. Therefore, it can serve all kinds of financial traders providing supports for both scalping and day trading activities. This Indicator can be applied to all kinds of forex currency pairs available in the market. Moreover, its simplicity of use and easy chart demons

Signal lines are used in technical indicators, especially oscillators , to generate buy and sell signals or suggest a change in a trend. They are called signal lines because when another indicator or line crosses them it is a signal to trade or that something potentially important is happening with the price of an asset. It could be that the price was trending, pulled back , and is now starting to trend or again, or it could signal that a new uptrend or downtrend is starting.
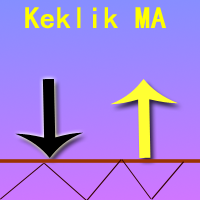
指標名称:Keklik MA.
使用:MA、MACD、RSIなどの技術指標。
推奨サイクル:1時間チャート。
長期トレンド:EMA 1、EMA 2、EMA 3、EMA 4の平均線配列方式。平均線の既定値:7、14、21、63。
短期トレンド:EMA 1、EMA 2、EMA 3均等線配列方式。
操作者タイプ:超急進者、急進者、穏健者。デフォルト値2.(0ロバスト者:信号平均線とEMA 3が交差し、1急進者:信号平均線とEMA 2が交差し、3超急進者:信号平均線とEMA 1が交差する。)
矢印信号:平均線規則、RSI規則、MACD規則を同時に満たす。
矢印信号平均線規則:信号平均線と取引平均線が交差する。
矢印信号RSI規則:連続する2つのK線のRSI値を比較する。
矢印信号MACD規則:連続する2つのK線のMACD値を比較する。
信号平均線:SiginalEMA、取引平均線:EMA 1、守備平均線:EMA 2。既定値:1、7、14。
取引注意:

About Scanner:
It will show you the Higher/Lower Highs and Lows of zigzag price. Use it to keep track of best ongoing trends and price ranges. Detailed blog post with free 2 weeks demo (till Sep-2,2022): https://www.mql5.com/en/blogs/post/750232
Symbols:
HH: Higher Highs HL: Higher Lows When price makes higher and higher Highs or higher Lows:
It will count Zigzag in reverse and find total number of last "Higher Highs" and "Higher Lows" or "Lower Lows" and "Lower Highs". LL: Lower Lows

Accelerator Oscillator by Bill Williams with the ability to fine-tune and replace the averaging algorithms of the indicator, which significantly expands the possibilities of using this oscillator in algorithmic trading and brings it closer in its properties to such an indicator as MACD.
To reduce price noise, the final indicator is processed with an additional Smooth averaging. The indicator has the ability to give alerts, send mail messages and push signals when the direction of movement of

SupportResistancePeaks Indicator indicator - is the combination of dynamic support/resitance and price action pattern. As a rule support/resistance indicators uses already calculated, history levels. The most disadvantage of this method - new(incomming) levels always are not the same as were on history, in other words accuracy is not so high as expected. My indicator is looking for dynamic/live levels that are forming right now after trend lost it's power and choppy market starts. As a rule exac
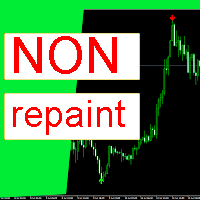
取引に役立つインジケーター。この指標は、トレンドの反転とプルバックを示します。矢印が表示されると、トレンドが方向を変えるか、メインの動きからロールバックすることを意味します。いずれの場合も、トレーダーが事前にそれを知っていれば、効果的に取引を開始することができます。この指標は値を再描画しません。ろうそくの始点に矢印が表示され、そこにとどまります。
このインジケーターで取引する方法: 赤い矢印が表示されたら、売り取引を開始します。 青い矢印が表示されたら、買い取引を開始します。 テイク プロフィットは 15 ~ 25 ポイントに設定されています。市場のボラティリティと取引している通貨ペアに応じて、あなたの裁量で設定されたストップロス。
インジケーターの利点: その値を再描画しません 価格反転ポイントを表示 トレンド転換点を示します 価格ロールバックポイントを表示 とても使いやすい 使いやすさのための最小限の設定があります
インジケーターの設定: period - 指標の計算期間を指定します。 このインディケータを使用した取引の有効性を実証するために、このイン

В основу алгоритма этого осциллятора положен анализ веера сигнальных линий технического индикатора RSI . Алгоритм вычисления сигнальных линий выглядит следующим образом. В качестве исходных данных имеем входные параметры индикатора: StartLength - минимальное стартовое значение первой сигнальной линии; Step - шаг изменения периода; StepsTotal - количество изменений периода. Любое значение периода из множества сигнальных линий вычисляется по формуле арифметической прогрессии: SignalPeriod(Numbe
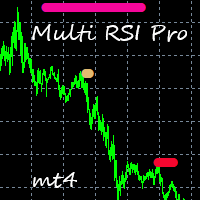
This indicator takes input from the RSI from multiple time frames (M/W/D/H4/H1), and presents the output on the main chart. Great for scalping. Features alerts for the current chart's TrendLine above or below price. TrendLine period setting. Multi RSI period settings. How to use: Simply attach to M5 (Scalping - zoom chart out completely on M5) or use on higher time frames' charts. Zoom chart out completely to get a better view of the chart. Hover over the lines to see the time frame applicable.

Wink IND is an indicator that tell you: -when MACD is saying buy or sell -when RSI is saying buy or sell -work on multi timeframes MT5 Version
by Wink IND: you don't need to have Knowledge about MACD or RSI don't need to check and compare MACD and RSI respectly don't need to check all of timeframes and compare the resaults don't lose time, save more time for your decisions in trading
Wink IND: multi timeframe indicator multi currency indicator show the positions by graphic shapes, arrows an

В основу алгоритма этого трендового индикатора положен анализ веера сигнальных линий универсального мувинга . Алгоритм вычисления сигнальных линий выглядит следующим образом. В качестве исходных данных имеем входные параметры индикатора: StartLength - минимальное стартовое значение первой сигнальной линии; Step - шаг изменения периода; StepsTotal - количество изменений периода. Любое значение периода из множества сигнальных линий вычисляется по формуле арифметической прогрессии: SignalPeriod(Nu
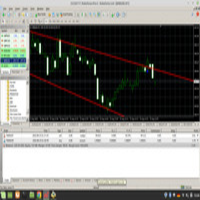
the trend line Alert indicator will inform you when the candlesticks crosses or touches the desired line. the indicator is having pop up and push notifications, see the pictures down how to setup, e.x, 1. pic one is alert 2. pic two is right click of the chart 3. pic three is how to change names of the trend so the indicator will detect 4. pic four is how you changed in the correct way any assistance please drop me via mql5 chat

Trend deviation scalper - is the manual system to scalp choppy market places. Indicator defines bull/bear trend and it's force. Inside exact trend system also defines "weak" places, when trend is ready to reverse. So as a rule, system plots a sell arrow when bull trend becomes weak and possibly reverses to bear trend. For buy arrow is opposite : arrow is plotted on bear weak trend. Such arrangement allows you to get a favorable price and stand up market noise. Loss arrows are closing by common p

Классический Parabolic SAR с цветовой визуальной индикацией действующего тренда и моментов его изменения на противоположный для ручного трейдинга. При необходимости символы сигналов покупки и продажи можно заменить, используя входные параметры индикатора Buy Symbol; Sell Symbol. Номера символов можно найти здесь .
Индикатор имеет возможность подавать алерты, отправлять почтовые сообщения и push-сигналы при смене направления тренда.

Gold Trend Pro Buy & Sell Signal Indicator Pairs : XAUUSD - XAGUSD - Crude OiL, EURUSD,GBPUSD,USDJPY,AUDUSD,GBPJPY,BTCUSD TimeFrame - 1 Min , 5Min, 15Min Once All Are Green Bar , And Also Englufing The Candle You Can Enter To Buy Once All Are Red Bar, And Also Engulfing The Candle You Can Entry To Sell And Next Once Change The Bar Colour , You Can Exit The Buy & Sell Order

Trend driver bars is the manual trading system, which defines current trend continue or it's pull-back/reverse. "Driver" bars - are price action patterns that has powerfull affect on market, defining it's near future direction. Generally, driver bars represents trend "skeleton" and often anticipates new market impulse. System plots arrows when market shows 3 pattenrs in a row(most powerfull combo-pattern), and makes fast scalping of incomming movement. Loss positions closes by common profit. Lot
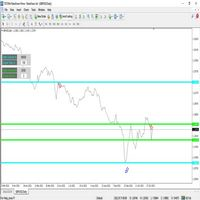
プライスチャンネルは、2つの独立したプライスチャンネルとプライスゾーンのレベルで構成されています - (A / B). このインジケータは、常に価格の挙動と動きを監視し、チャネルレベル(A / B)の破壊、レベルの再配置、極値および極小値の新しいゾーンの固定を行います。 以前の高値と現在の安値の分析については、各チャンネルのバーの数 - (A / B)に依存することはありません。 チャート上の各チャンネルに有用な情報を表示するインジケーターです - (A/B)。 1. 各チャンネルの解析で指定されたバーの数。 2. デルタ - 各チャンネルのレベル間の距離。
1. インジケータのアプリケーション例:最大値と最小値(上または下)のゾーンと新しいローカルレベルを検索して更新するために、チャネルで - (A)は、範囲を指定します - (100 - 500)バー例えば。チャンネル(B)は使いたくないので、チャンネル(B)には(0)バーを表示します。 B)チャネルの水準は、チャート上では消えてしまい、私たちの邪魔をすることはありません。 2. インジケータアプリケーションの例:狭い廊下で価
Calculate 28 pairs buy and sell volume real-time.
This Indicator is good for all trader. It will increase the accuracy and decision making of placing orders. It shows the strength and weakness of every currency. It's a great help to you. CurrencyStrength28pairs - The indicator calculates the price and the buy and sell volume of every currency pair. Show you the results on the board in real time. and averaged all currency pairs to show the strength of the current currency. Features
Result on t

Wave Impulse OmegaScalper - is the manual system for scalping. In many cases Indicator "eats" almost all possible trend wave. System defines up price wave and down price wave. Inside the exact wave - system defines true trend movement and choppy market. Indicator plots signals while market is trending, powerfull and has quiet good volatility. This is complete system with enter and exit points. Main Indicator's Features Signals are not repaint,non-late or disappear(exept cases when system recalcu

Angle of Moving Averages This indicator is very simple yet powerful concept which constantly calculate the slope of the current bar moving average with respect to the N bar before moving average value. This no only give a good entry and exit signal but also it shows traders the strength of the signal. It shows positive green histogram when market is moving toward upward direction and red histograms for downtrend. When large histograms found means market has very strong trend. Inputs Available

Reverse side scalper is the manual trading system, that works on choppy(anti-trend) market. As a rule markets are on 80% choppy and only 20% is trend phase. System is based on custom step Moving and RSI and reverse pattern. System defines up movement, down movement, trend / choppy phases. Indicator plots Buy signal arrow when current direction is down and phase is trend, Sell signal arrow is plotted when currently is up movement and phase is trend. As a rule it allows to "catch" local maximum/mi

Binary step clouds - is the complete trading system with enter and exit points. System is based on double smoothed exponential step moving and volume weighted simple step moving.Generally each movings define trend direction and places when trend is in active phase. Signals plots when both movings approache to active trend phase and market speed is high. Main Indicator's Features Signals are not repaint,non-late or disappear(exept cases when system recalculates all history datas,refreshing main

Apollo Global Trends - これは、任意の通貨ペアの市場トレンドの動きを予測するために作成されたトレンド インジケーターであり、金属、インデックス、株式、暗号通貨、その他の取引商品を含む絶対にすべての取引商品です。このインジケーターは、任意の時間枠で使用できます。この指標は、長期および短期取引の両方に適しています。インジケーターは、メイン システムとして、またはインジケーターのフィルターとして機能できます。この指標は、市場のノイズを完全にフィルタリングします。インジケーターは非常に使いやすいです。信号に従うだけです。 購入後、必ず私に書いてください! このインジケーターを使用した取引に関する推奨事項を共有します。また、無料でインジケーターを提供します。これにより、取引がさらに有益で快適になります。

残り3枚だけで99! 次の価格249円!
任意の初心者や専門家のトレーダーのための最良のソリューション! 再び動きを見逃すことはありません!
シンプルさとピップを愛するトレーダーのために、私たちはあなたのための特別な製品を持っています。 自然の中でシンプルな、ダッシュボードは、私たちのカスタムHikenAshiベースのアルゴリズムで12通貨ペアを見てすべての作業を行います。 唯一のチャートを使用すると、プロのように市場を読むことができます。 ちょうどあなたが任意の外国為替ペアの方向を特定することができ、それが移動を開始したときに正確にする場合は、あなたの取引が改善するこ
私たちのシステムは、これらの高確率信号を見つけて、リアルタイムでユーザーに警告を送信するために構築されています。 遅れおよび偽りの約束無し、私達は私達の単語によって立ちません。 システムは、移動を見つけて、あなたに彼らが表示された瞬間を警告するために構築されています!
あなたの高い確率の動きを見つけるために、バックグラウンドで作業しながら、あなたがそれを必要としないときにきれいなあな
残り9枚だけで149枚! 次回価格199円!
私たちのMA-スナイパーダッシュボードはライブです!
代替ハ-スナイパーダッシュボードを探す(通販で購入)] https://www.mql5.com/en/market/product/85666 ]
任意の初心者や専門家のトレーダーのための最良のソリューション! 再び動きを見逃すことはありません!
シンプルさとピップを愛するトレーダーのために、私たちはあなたのための特別な製品を持っています。 自然の中でシンプルな、ダッシュボードは、私たちのカスタム移動平均ベースのアルゴリズムで28通貨ペアを見て、すべての作業を行います。 唯一のチャートを使用すると、プロのように市場を読むことができます。 ちょうどあなたが任意の外国為替ペアの方向を特定することができ、それが移動を開始したときに正確にする場合は、あなたの取引が改善するこ
私たちのシステムは、これらの高確率信号を見つけて、リアルタイムでユーザーに警告を送信するために構築されています。 遅れおよび偽りの約束無し、私達は私達の単語によって立ちません。 シス

The indicator for determining key patterns for the BBMA strategy will perfectly complement the Fibo Musang strategy, and can also be used as an independent tool. IMPORTANT! Contact me immediately after purchase to receive the second file! If you have any questions, I will help you deal with the indicator. Designed to save market analysis time; Sends push notifications to the phone when key moments of the strategy have arisen (Extrem A, Csak, cross the BB line with a candle) Advantages Easy to u
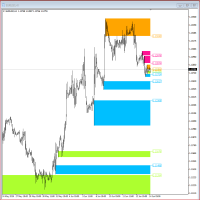
"Supply / Demand Zones"
The concepts of supply and demand zones are undoubtedly two of the most highly discussed attributes of technical analysis. Part of analysing chart of pattern , these terms are used by traders to refer to price levels i n charts that tend to act as barriers, preventing the price of an asset from getting pushed in a certain direction. At first, the explanation and idea behind identifying these levels seems easy, but as you'll find out, supply and demand zones can co

Slot - 再描画なしの価格反転インジケーター。チャート上のインジケータの矢印は、反対方向の価格反転ポイントを示しています.スロットは、標準的なテクニカル指標と価格パターンを使用して市場を分析します。この指標は、時間枠と通貨ペアに応じて、85 ~ 95% の精度で価格反転ポイントを示します。この指標は、すべての時間枠とすべての通貨ペアで機能します。時間枠が大きいほど、指標の精度が高くなります。シグナルの最大効率は、横方向の値動き (フラット) で達成されます。このインジケーターは、短い時間枠で多くのシグナルを示すため、スキャルパーであると言えます。このインジケータは、空きチャネル インジケータと組み合わせて使用することをお勧めします。
このインジケーターで頭皮を洗う方法は? チャネルインジケーターが下に傾いて赤い矢印が表示されたら、売ります。 チャネル インジケーターが上に傾いて青い矢印が表示されたら、買います。 テイクプロフィットは、時間枠と通貨ペアに応じて 15 ~ 35 ポイントを設定します。ストップロスは 35 ~ 65 ポイントに設定します。 ロットサイズは残高の

As per name Candles Talk, This Indicator is a affordable trading tool because with the help of Popular Developers & Support of M Q L Platform I have programmed this strategy. I tried to input history of candles with average Calculation regarding High, Low, Last High, Last Low with Moving averages. Furthermore, I have also taken help of Moving average So Trader can easily get in touch with market in another way also. What is in for Trader?
Arrows: Buy Sell Indications (Candles Hig
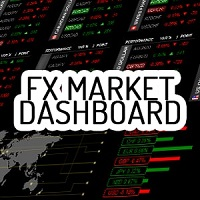
Fx Market Dashboard is a very innovative tool that features very professional graphics. Simplifying the reading of the market has always been our prerogative and we believe that with this tool everyone can better understand the market. This tool is mainly concerned with giving us a clear view of what are the strongest and weakest currencies, through this information we can begin to better understand where the market puts money or takes away money. The reading of the percentage logic serves to h
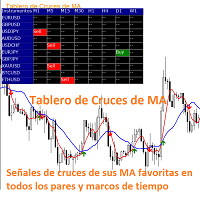
El indicador Tablero de Cruces de MA es un indicador que muestra los cruces de 2 medias móviles seleccionadas en el gráfico de precios indicando si se trata de un cruce alcista o bajista. Además, como su nombre lo indica, muestra un tablero de señales que indica en que mercado y marco de tiempo se produce un cruce de las dos medias móviles. En la ventana de configuración el usuario puede seleccionar los mercados y marcos de tiempo que puede visualizar en el tablero. También tiene la opción de ac
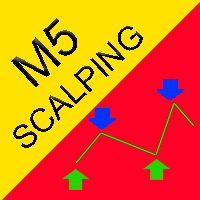
買い時、売り時を矢印で示す既製の取引システム。インジケーターは矢印を再描画しません。 94% の精度でシグナルを表示します。すべての通貨ペアとすべての時間枠 (推奨時間枠 M5、M15、M30、H1) で動作します。これは、スキャルピング戦略に従って取引する既製の取引システムです。日中指標は、M5 と M15 の時間枠で多数のシグナルを示しています。
この指標で取引するには? 赤い矢印が表示されたら、右下隅にある通貨ペアの強さを確認する必要があります。たとえば、GBPUSD で取引する場合、GBP ストリップを USD ストリップより小さくする必要があります。そのような状況を見つけたとき、私たちは売却の取引を開始します。 買うには、チャートの青い矢印を待つ必要があります。その後、右下隅を見て、GBP ストリップが USD ストリップよりも大きいことを確認する必要があります。そのような状況が見られた場合、私たちは買いの取引を開始します。 TakeProfit は最低 15 ~ 35 ポイントを設定します (スカルプするため)。ストップロスは、矢印のレベルから 35 ~ 55 ポイン

このインディケータは、チャート上に「Rails」パターンを表示します。こ の パ タ ー ン は 、同 じ 本 体 と 小 さ な 影 を 持 つ2本の多方向ローソク足で構成されています。 現 在 の タ イ ム フ レ ー ム で パ タ ー ン "Rails "が表示されている場合、x2タイムフレームではピンバー(童 子)のように表示されます。 このインディケータは、簡単に変更できる論理的にシンプルな設定により、最も効率的な方法でパターンを自動的に見つけるように作成されています。 トレンド(2本の移動平均線)と反転(RSIとボリンジャーバンド)でフィル ターするオプションもあります。 多通貨パネルが利用可能です。その助けを借りて、簡単にチャートを切り替えることができます。
取引パターン トレンドの再テスト。 偽ブレイクアウト。 その他 。
EURUSD, GBPUSD, XAUUSD, ... M15、M30、H1。
入力パラメータ 。
基本。 Bars Count - インディケータが機能するヒストリーバーの数。 Max Candles Shadows

このインジケータは、2本目のローソク足が1本目のローソク足の内側にあるとき、つまり限界 を超えていないときに、チャート上にシグナルを表示します。 このローソク足パターンはインナーバーと呼ばれます。 このパターンはピン・バーやテイクオーバーほどポピュラーではありませんが、一部のトレーダーによって使用されることがあります。 トレンド(2本の移動平均線)と反転(RSIとボリンジャーバンド)によるフィルターが可能です。 多通貨パネルが利用可能です。その助けを借りて、あなたは簡単にチャートを切り替えることができます。
取引パターン トレンドの再テスト。 偽ブレイクアウト。 その他 。
EURUSD, GBPUSD, XAUUSD, ... M15、M30、H1。
入力パラメータ 。
基本。 Bars Count – インジケータが動作する履歴バーの数。 Min Ratio Candles - 最初のローソク足と2本目のローソク足の最小比率。 Calc Mode - 内部バーの決定方法(HL、OC、HLOC)。
フィルター 。 Filter 1 Trend And Rever

MetaTrader indicator that detects WRBs (Wide Range Bodies/Bars) and Hidden Gaps.
WRB Hidden Gap MetaTrader indicator detects WRB and marks it. WRB can be either a Wide Range Bar (a very large bar) or a Wide Range Body (a candlestick that has a very long body). WRB alone do not provide much information so the indicator uses WRB to detect Hidden Gaps. The indicator also displays filled and unfilled Hidden Gaps in a different way, making it easier to view the market situation at a glance
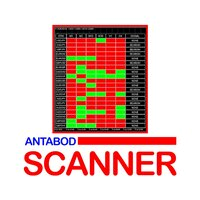
Antabod Scanner, Is a multi-timeframe scanner. It's a metatrader 4 indicator, which allows the detection of the trend of several pairs at a glance. I t will display on the platform any pair or pairs that all the timeframes, from the higher time frame to the lower timeframe, in the inputs, are all bullish or all bearish. When a pair is completely bullish, all the timeframes will be green, or when bearish all the timeframes will be red, and a sound will alert and a written alert will be displayed

The Pearson Trend!! My name is Murat Yazici. I have B.Sc. Statistics and M.Sc. Quantitative Methods degrees. I have several scientific papers, conference presentations in Texas, Toronto, London, Istanbul, books and book chapters studies, and many projects about mathematical and statistical modelling. I am also journal reviewer at some scientific journals.
What is The Pearson Trend's Logic? It is based on A Fuzzy Model developed by me. Vague or fuzzy data and application several fields,

Optimized for Asia- London- US- Open-Session the best Features from MOMENTUM-SOLO true Momentum - time-based Indicator it's based on a self-developed candle Pattern, in relation to the ATR
Filter
Daytime Weekdays Moving Averages Keltner-Channel
Advantages Optimized for Asia- London- US- Open-Session choose your personal times to trade - select Daytime and Weekdays Keltner-Channel => to reduce market noise - sideways movement will be hidden 3x Moving Averages => for the Trend Sig

F1 Scalping for MT4 は、あなたの代わりに市場を分析する完全な取引システムであり、いつ注文を開始する必要があるかを示し、良い結果を得るためにテイクプロフィットとストップロスを配置するレベルを示します。これは、1 つのテクニカル インジケーターにまとめられたツールのトレーディング コンプレックス全体です。また、このシステムは電話でトレーダーに信号を送ることができます。これにより、取引プロセスが大幅に容易になります。電話で信号を受信し、PC に移動して、どこで注文を開始する必要があるか、どの方向で、どこにストップロスを置き、利益を得るかを確認します。すべてがとてもシンプルです。取引システムの指示に従うだけで、結果を得ることができます。このシステムはプロのトレーダーによって作成され、実際の取引口座で 6 か月間テストされました。
MT4インジケーターのF1スキャルピングの利点: 準備が整った取引システム その信号を再描画しません 電話に信号を送ることができます すべての主要通貨ペアでの取引 インジケーターは、いつ注文を開始するか、どの方向に、どこにストップロスを置き、

Welcome to Investment Castle products This product is exclusively available in the MQL5 market and is not available and will not be available anywehere else. The Combined indicator is a multi-time frame indicator and it is built using 3 indicators: Bands indicator which draws the support and resistance key levels using up to 5 different time frames Patterns indicator which draws the chart patterns using up to 6 different time frames Spots indicator which shows the common candlestick pattern

Night Crawler is a moving average trend trading strategy and delivers over 89 to 90% wining ratio when applied and traded properly. It work for all Timeframe and for every currency pairs trading on the MQL4 Platform. To have a clear trend bias of the market Apply EMA 50 and EMA 21 to your chat to get the best out of this strategy for your overall Trend View.
The Best Timefarme to use is H1 or H4
ENTRY RULES :
For Buy trades :
1. Wait for EMA 21 to Cross Above 50 2. When the arrow (Bl

66% discount only for the first 5 buyers (4 left), main price: 300 $
Show the signal as a line graph Prediction of 10 future candles and advanced display Prediction of individual candles graphically Can be used in the gold symbol Can be used in 15 minutes time frame Can be used only in gold symbol and only 15 minutes time frame
How the indicator works:
Using complex mathematical calculations, it predicts the future 10 candles. The predictions of this indicator are based on price. Ther
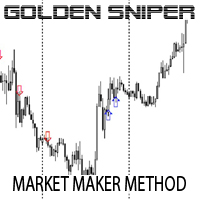
指標はマーケットメーカー戦略に基づいています。再塗装なし。 MM はトレーダーであり、彼らの目的はお金を稼ぐことです。これには、小売トレーダーとの取引戦略が含まれます。彼らと他のトレーダーとの主な違いは、大量の取引量にアクセスすることで、自由に価格を動かす能力があることです。そのため、利益を得るために、彼らはより低い価格で購入し、より高い価格で販売することを目指しています。 彼らは次の方法でこれを達成します。 1. トレーダーにポジションを取るように誘導する。これは、一連の価格変動を使用して、トレーダーを「だまして」特定の方向にポジションを取り、その後再び反転させることによって達成されます。これは、MM が特定の通貨を特定の価格で売却し、リテール トレーダーが通貨の価値が後退して再び売却したいという苦痛を感じたときに、より低い価格で買い戻すことができることを意味します (たとえば、ストップ ロスを介して)。 ) 2. パニックと恐怖を引き起こし、トレーダーが感情的になったり、不合理に考えたりするように仕向けます。多くの場合、これには次のことが含まれます。 ⋅ 素早い動き ⋅ スパイクキ
MetaTraderマーケットはMetaTraderプラットフォームのためのアプリを購入するための便利で安全な場所を提供します。エキスパートアドバイザーとインディケータをストラテジーテスターの中でテストするためにターミナルから無料のデモバージョンをダウンロードしてください。
パフォーマンスをモニターするためにいろいろなモードでアプリをテストし、MQL5.community支払いシステムを使ってお望みのプロダクトの支払いをしてください。
取引の機会を逃しています。
- 無料取引アプリ
- 8千を超えるシグナルをコピー
- 金融ニュースで金融マーケットを探索
新規登録
ログイン