YouTube'dan Mağaza ile ilgili eğitici videoları izleyin
Bir ticaret robotu veya gösterge nasıl satın alınır?
Uzman Danışmanınızı
sanal sunucuda çalıştırın
sanal sunucuda çalıştırın
Satın almadan önce göstergeyi/ticaret robotunu test edin
Mağazada kazanç sağlamak ister misiniz?
Satış için bir ürün nasıl sunulur?
MetaTrader 4 için ücretli teknik göstergeler - 87

This indicator provides several drawing tools to assist in various methods of chart analysis.
The drawings will keep their proportions (according to their handle trendline) across different chart scales, update in real time, and multiple drawings are supported.
#
Drawing Option
Description
1 Grid box draggable boxed grid, user defines rows x colums, diagonal ray option 2 Grid partial or fullscreen grid, sized by handle line 3 Grid flex a diagonal grid, sized and sloped by handle line
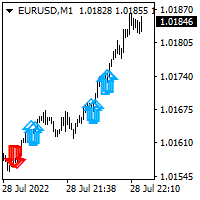
This indicator helps you to build position and profit when market turns in your favor. You will build your full position by trading many small position. Once blue arrow appear on the chart, you could add long position. Once red arrow appear on the chart, you could add short position. I personally spread my full size position in to 5-10 small position. I use small target of 2-5 pips on eurusd pair.

DESCRIPTION
The CHAOS INDICATOR has been developed to be used for the TRADING STRATEGY OF CHAOS, as described in the book. The book is in italian language only and can be obtained only on my website indicated below.
DATAS COLLECTED AND SHOWN ON GRAPHS
The CHAOS INDICATOR apply easily to any graph and any asset, and it is a TRADING FACILITATOR, as it identify immediately the following items on any graph: - The GP (= RIGHT PRICE) i.e. the price to which the asset should be attracted within 24

https://c.mql5.com/31/761/best-trend-indicator-logo-200x200-8493.png The indicator uses a solid line of red and green to reflect the myriad changes in market prices. The green line indicates a period of rising market prices and the red line indicates a period of falling market prices. Solid line color change indicates that the market has changed and the market is likely to reverse! It is recommended that you use this indicator on your daily K-chart. This indicator is not suitable for you to do
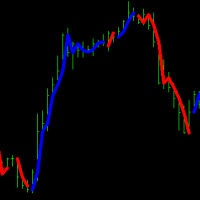
Trend indicator to determine the direction of the trend. The indicator scans the market looking for sharp price reversals and shows the trader where a bearish or bullish trend begins. When the market moves sideways, the indicator stops drawing signal lines. Thanks to this indicator, each trader is able to quickly determine the direction of the market and open the right orders in the direction of price movement. You can also analyze the market on different timeframes, confirming the signals of a

Night Ghost - İkili opsiyonlar için ok göstergesi.
Bu, gelecekte sizin için güvenilir bir yardımcıdır!
- Grafikte yeniden çizim yok
-Tüm döviz çiftlerinde harika çalışıyor!
-%90'a varan gösterge doğruluğu (Özellikle geceleri)
-Uzun süre kurulum yapmaya gerek yok (İkili Opsiyonlar için mükemmel kurulum)
- Geç olmayan sinyaller
- Mevcut mum üzerinde bir sinyalin görünümü
-M1 dönemi için mükemmel (Artık Yok!)
- Göz dostu mum rengi (Kırmızı ve Mavi)
-Yüklü Uyarı
Onunla çalış

Forex Gump Trend is a universal indicator for highly effective determination of the trend direction. If you identify the trend correctly, this is 95% of trading success, because you will be able to open trades in the direction of the price movement and benefit from it. The Forex Gump Trend indicator helps traders with a high degree of efficiency to determine the current trend direction, as well as trend reversal points. The direction of the trend is shown by colored lines on the chart, and the
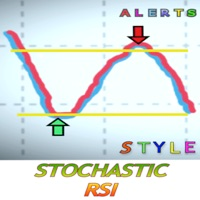
Stokastik RSI nedir?
Stokastik RSI (StochRSI), teknik analizde kullanılan, sıfır ile bir (veya bazı grafik platformlarında sıfır ile 100) arasında değişen ve Stokastik osilatör formülünün standart fiyat verileri yerine bir dizi göreli güç endeksi (RSI) değerine uygulanmasıyla oluşturulan bir göstergedir. Bu sürüm, gerçekten iyi fırsatları kaçırmamak için uyarılar içerir. Bir sinyal satın alma emri veya sinyal satış emri almak istediğinizde parametreyi ayarlarsınız. Herhangi bir sinyal almak i
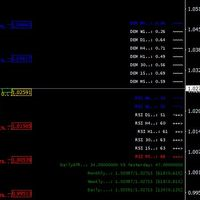
I decided to add parallel function with DeMarker to free version of my indicator with RSI MTF. it is good for scalping or for weekly trading and looks as universal fx-toy. In menu you can turn on daily percentage gain info, it is good for crypto as for me, weekly and monthly gains also included as informers. Short ATR helps to determine when price was stopped and entry for pulse pump/dump. The filter of numbers of RSI can be tuned for overbought/oversold values with colors you needed. Examp

Currently switched to the 4 hour chart - but use other time frames for confirmation. :-) I change my main time frame based on the market movement at the time. The Hurricane Forex Indicator is a multi time frame indicator that includes such things as Trade Notifications, Trade Calculator, Momentum Indicator, risk reward and much more. We have a free Trade room for our users as well. Please check out the video for full details of how this indicator works as it has over 15 years worth of developme

BSA indikatörü ZigZag bazlı bir indikatördür. Bu indikatör fiyatın geri dönüş seviyesini bulmakta kullanılır. Girdilerde mevcut risk oranı ve hesaplama timeframe ini kullanım tercihinize göre optimize ederek kullanabilirsiniz. Düşük zaman dilimlerinde indikatör yeniden boyama yapabilir. Daha sağlıklı sonuçlar için uygulayacağınız grafiğe göre bir süre gözlem yaparak en az yeniden boyamayı tespit edebilirsiniz.
Simple Dark Holder Tool
Arrow indicator for Forex and binary options
Already tuned for the best signals
Multicurrency and multitimeframe
Works on all currency pairs as well as raw materials, etc.
Works on the author's strategy and combines 3 indicators that show good results
Does not draw or redraw
The signal appears clearly at the opening of the candle
blue up
Red down
Alert is also built into it for your convenience.
Test and watch a video on how it works

Welcome to Upside Down !
Upside Down is a powerful indicator that gives the perfect trading opportunities and a clear indication of the market. Upside Down has been created to be as simple as possible. Arrows are calculated based on ASC Trend and customs indicators . Signals appear without delay at the end of a candle, if it has tested the level. The signals do not overdraw.
THE BENEFIT:
Easily to enter in buy position/sell position Intuitive directional arrows by co
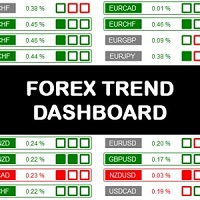
The Forex Trend Dashboard is a truly exceptional tool for analyzing and operating the choice of which exchange to try to trade. The analysis of currency baskets allows you to better understand the real situation of the market and better evaluate your own operational ideas. The dashboard analyzes the trend over different time horizons such as: daily, weekly and monthly. The resulting considerations are very simple, the session opening price and its strength condition are analyzed by recognizing t

Acemi veya Profesyonel, en çok satan çok zaman dilimli Pivot Prof, alış ve satışlarınızı güzelleştirecek ve uzmanların kullandığı Destek ve Direnç katmanlarıyla size birinci sınıf değişim olanakları sunacaktır. Pivot alış ve satış, anahtar aralıklarda piyasaya giriş ve çıkış yapmak için kolay ve güzel bir tekniktir ve yetkililer tarafından uzun süredir kullanılmaktadır ve tüm semboller üzerinde çalışmaktadır: Forex, Kripto, Hisse Senetleri, Endeksler vb. Pivot Prof top getiriyor Katmanları bayi

This tool provides a freehand drawing method, to treat the chart space as a blackboard and draw by-hand. Drawings can be made to stick to the CHART (moves with chart scroll), or to stick to the WINDOW (does not move with chart scroll).
Features: all drawings are individually styled, color, width
show/hide each drawing type
delete last drawing drawings, on chart and on window, remain through TF changes and terminal re-starts, until the indicator is removed
Panel: stylable colors scalable in
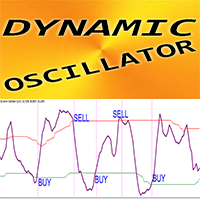
Dynamic Oscillator - is an advanced custom indicator - efficient Trading tool for MT4 ! New generation of Oscillators - see pictures to check how to use it. Dynamic Oscillator has adaptive Oversold/Overbought zones
Oscillator is an auxiliary tool to find exact entry points from OverSold/OverBought areas Oversold values: below Green line; Overbought values: over Red line It is much more accurate than standard oscillators. // More great Expert Advisors and Indicators are available here: htt

My indicator is a great helper in the forex market. It shows possible market reversals with absolute accuracy. My indicator does not redraw and does not change values when switching timeframes. It works perfectly on all timeframes and can become a key indicator in your strategy. I would like to note that flexible indicator settings allow you to adapt the indicator to your strategy and can make a big contribution to your profitable strategy, although everything is already laid down in this indica
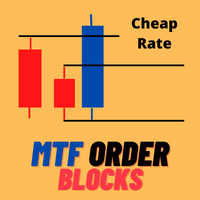
Cheap Rate limited COPIES HURRY UP! 5 LEFT COPIES Very precise patterns to detect High Accurate Order Blocks: It Draw zone after market Structure Breakout with a high Accuracy, institutional orders with the potential to change the price’s direction and keep moving towards it, have been placed. Features Auto Order Blocks Draw MTF Order Blocks Double Signal One Alert Signal Second Long Wick Rejection Signal Market Structure BOS LINE This Indicator is limited features if you want full Feature
ADX Pro Indicator This Indicator Are Advanced Pro ADX Indicator Multi Time Frame Are Same Window Multi Currency Are Same Windows All Time Frame And All Currency ADX Strenght Are Same Window Monitring You Will Add Manully All Currency Pairs , And Metel , And Also Crypto Currency Pairs : EURUSD , GBPUSD, USDJPY .... Etc , Metel : XAUUSD , XAGUSD ... Etc , Crypto : BTCUSD, ETHUSD... Etc
Merhaba; Ürün yüksek kalitede trend takibi sunar.Grafikteki oklar sayesinde giriş ve çıkış sinyallerini kolay bir şekilde takip edersiniz.Tek bir girdi parametresi sayesinde kullanım kolaylığı sağlar.Alarm seçenekleri sayesinde sinyalleri kolay bir şekilde takip edersiniz.Ayrıca trend renk çizgileri trend yönünü belirlemede kolaylık sağlar. Girdi parametre ayarı: Periodic: Hesaplanması geren bar sayısını ifade eder.
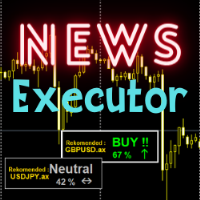
Several indicators are summarized in one display conclusion. Highly recommended indicator for all traders even beginners. You only need to make transactions according to the recommendations displayed by the indicator. It's obvious for trading news with big effects though. Trading is all about money, so love your money and make a profit with our tools. Trading recommendations on news on major currencies

Balance Weighted Moving Hedge System- is the trend following manual system for forex/crypto market. Indicator represents custom balance-weighted moving average indicator. The main advantagies : very stable moving with really early signals, defines current trend power, ignores market noise. The more width of indicator line - the more expressive trend is. On the other hand thin moving line shows unstable / choppy market. Indicator can be used as single b alance weighted moving or with hedge strate
Master Trend Signal Indicator
TimeFrame - 15 Mins & More
Pairs - All Forex Currency Pairs , Gold , Silver , Crypto, Stock
Once Trend Is UP Cross The Yellow Line, It's Show Colour For Green
Once Trend Is Down Cross The Yellow Line, It's Show Colour For Red Easy TO Identify Trend Strength ON Trading For Scalping, Intraday Trading 5 Purchases left & The Price Increases

В основе индикатора EasyBands лежит тот же принцип, что и при построении Bollinger Band. Однако, данная модификация индикатора использует вместо стандартного отклонения средний торговый диапазон (Average True Range). Соответственно, с данным индикатором абсолютно аналогично можно использовать все стратегии, которые применяются с Bollinger Band. В данной версии индикатора используется двенадцать уровней и средняя линия (белый цвет). Индикация тренда выполнена в виде окраски свечей в зависимости
Golden Scalping & Day Trading Signal Indicator You Can Enable Or Disable Scalping Signal Option Once Enable For Scalping More Order Signals Option Or Disable For Scalping Option Intraday Signal Option Pairs : XAUUSD, XAGUSD - EURUSD, GBPUSD,USDJPY, AUDUSD, USDCAD, BTCUSD , USDCHF, GBPJPY Time Frame : 15 Mins, 30 Mins , 1 Hour 5 Purchases left & The Price Increases

UR Momenteri
UR Momenter, bir osilatör olarak temsil edilen fiyat hareketinin tükenmesiyle ilişkili olarak fiyatın momentumunu mükemmel bir şekilde hesaplar. Bu nedenle, bu bize potansiyel geri dönüşlerin veya geri çekilmelerin gerçekten erken sinyallerini verir. Bu formül, 2018'de pazar balonu patladıktan sonra keşfedildi.
UR Momenter kullanmanın avantajları:
parametre yok Fiyat hareketini tanımlayan 2 çizginiz var - Fiyatın hareketli ortalama sapmasına bağlı olarak fiyatın Momentumu o

Sayı dizilerinden birine "Orman Yangını Dizisi" denir. En güzel yeni dizilerden biri olarak kabul edildi. Başlıca özelliği, bu dizinin lineer trendlerden, hatta en kısa olanlardan kaçınmasıdır. Bu göstergenin temelini oluşturan bu özelliktir. Bir finansal zaman serisini analiz ederken, bu gösterge tüm olası trend seçeneklerini reddetmeye çalışır. Ve ancak başarısız olursa, bir trendin varlığını tanır ve uygun sinyali verir. Bu yaklaşım, yeni trendlerin başladığı anların doğru bir şekilde belirl
Gold Scalping Pro Signal Indicator Pairs : XAUUSD, XAGUSD, Crude OIL , BTCUSD, ETHUSD, EURUSD, GBPUSD, USDJPY, AUDUSD, USDCHF, GBPJPY Setting : Once Market Are Up And Down Side , The Indicator Are Provide Buy And Sell Order Push Notification Time Frame - 5 Mins, 15 Mins, 1 Hour, 4 Hour Additional : You Have Also Trade Manual , Once Trend Power Is Up , Enter Buy Or Trend Power is Down, Enter Sell
A Good , Easy , Readable and handy indicator for experienced and professional traders. It gives bounded signals between zero and one. Easy for investors to comprehend. It gives near and longer trading outlook to investors and helps them to find good opportunities. Indicator gives zero signal on price downturns and signal value equals to one on price upturns. Once again a new type of indicator and rangebound between zero and one .

A very Simple Indicator for experienced and professional traders. It indicates direction of trade and provides signals of best deals. Signal is referred here a point on chart where indicator line turns its direction or converges. This indicator finds underlaying trading asset trade direction and indicates best scenarios of trade as described in screenshots. Where it has run for a period of time and converges to best deal scenarios.
Have a Look!
A value indicator. It is helping tool to indicate the direction of value gain. A best helping tool to trade value. This indicator is equipped with a colored line and a digital tool to indicate value numerically .
This indicator also helps to indicate value during trends. A study based on this indicator shows value of trade significantly changes during trends best tool to chase the trends.
A basic tool for experienced and professional traders to trade percentile of the value. It indicates both values in the form of digits appeared on the left corner of the screen.
Instructions Manual : First choose your desired symbol and then select this tool. Please be remined that this tool is just a helping tool. its upon trader what he chooses. The function of this tool is just to provide a help in trading.
A technical Indicator Providing Price Convergence Signals along with value for experienced and professional traders. Easy to comprehend, Easy to understand.
This is a helping tool provides best signals. This indicator is designed based on the fundamentals of trade. A very good indicator you can customized its color. A best tool to find trade direction.
An adaptive indicator. It constantly adapts to the trade.
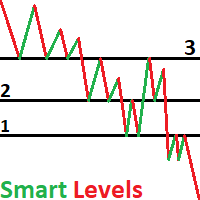
NOTE: T he indicator in demo version will not work as it requires the specific preset and if in future you don't see recent numbers drawn on your chart then please contact us for recent calculated preset file
This is smart money levels , just see the pictures how the pair reacts to our calculated numbers
The indicator can be used with any timeframe but to match the institutional traders we recommend H4 or D1 charts
Allow DLL imports must be turned on, as the indicator requires to be conn
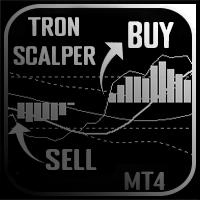
Tron Scalper, scalping için tasarlanmış yeni bir yazarın göstergesidir.
Gösterge, bir dizi standart ve telif hakkı enstrümanının okumalarına dayanarak sinyaller verir.
Tron Scalper'ın Temel Özellikleri: Analitik fonksiyonlar
Herhangi bir döviz çiftinde ve zaman çerçevesinde kullanılabilir; Gösterge yeniden çizilmiyor; Diğer göstergelere ek olarak harika; Grafik yetenekleri
Grafikte minimum miktarda yer kaplar; Esnek tentürler; Öğrenmesi kolay; Tron Scalper oluşur ...
Mavi çizgi

Note: The PRICE IS SUBJECT TO INCREASE AT ANY TIME FROM NOW!! DON'T MISS THIS BEST OFFER.
Dear traders once again I am very glad to introduce to you my another trading tool called "Trend Hunter Indicator". This indicator is designed to help traders capture the trend from the beginning or the end of it. It is one of the indicator that if used wisely may help you improve in your trading decisions.
Timeframe
The indicator is for all timeframes
Pairs
The Indicator is for all pairs.
Mar

HEIKEN PLUS is the only indicator you really need to be a successful trader , without in depth knowledge of the forex trading or any tools. Also there is automatically trading MT5 EA available now: https://www.mql5.com/en/market/product/89517? with superb SL/TP management! and sky high profit targets ! MT5 ONLY !
For Metatrader5 version visit: https://www.mql5.com/en/market/product/83761?source=Site
Very suitable tool for new traders or advanced traders too.
HEIKEN+ is a co

DESCRIPTION Investing indicator help you get signal like Technical Analysis Summary of Investing.com When have signal strong ( Strong buy or Strong sell) at Time Frame M5, M15, H1, The Alert will announce to you HOW TO USE When have signal , you can entry Order and set TP & SL appropriately Recommend : This indicator also Technical Analysis Summary of Investing.com is suitable for medium and long term trading

UR Ön UçArka Uç
UR FrontEndBackEnd, en doğru destek ve direnç seviyelerini bulmak için en sevdiğim formüldür. Ayrıca ne kadar güçlü olduklarını işaretlemek için bunları farklı kategorilere (kesikli çizgiler, düz çizgiler ve alanlar) ayırdım. Tümü arabelleklerde saklanır, böylece diğer araçlara kolayca erişilebilir ve uygulanabilir.
Ek: Aracın uygulandığı varlığa göre ayarlanması gerekebilir - varlığın aracı etkileyen fiyattaki basamak sayısı farklılık gösterir. Bunun için gerekli parametr

The Cycle Identifier MT4 indicator is a great choice of custom indicator for both short-term and long-term traders. The Cycle Identifier MT4 generates filtered price action signals to assist traders to identify when the conditions are right to open buy and sell positions. How it works The Cycle Identifier MT4 indicator displays on a separate indicator chart below the main chart where it draws an oscillating gray line. This gray line is characterized by upward and downward spikes that are accompa
This indicator is used to show the PERFECT TREND . All Time Frame charts are available. The trend is determined based on the Cycle, Price and Volatility. This Trend Indicator will give 5 output values: Cycle Period: 48 is default
Graph Place: 0 Means Main Windows - 1 means Sub Windows (you can use in your indicator)
NumBars: you can decide how many older Bar use
Short Trend Color : You can decide which color to use for Short Trend
Long Trend Color : You can decide which color to use for Lo
Индикатор Super ATR MT4 предназначен для определения математически оправданного размера стоплосса и тейкпрофита. В расчете алгоритм использует заданные фракталы рынка текущего таймфрейма. Размер минимального стоплосса определяется по среднему размеру свечей ATR ( Average True Range ), а максимальный тейкпрофит определяется по FATR ( Fractals Average True Range ) - среднему размеру цены между противоположными фракталами на графике. Особенности Авторский алгоритм определения среднего фрак

Awesome Oscillator by Bill Williams with the ability to fine-tune and replace the averaging algorithms of the indicator, which significantly expands the possibilities of using this oscillator in algorithmic trading and brings it closer in its properties to such an indicator as the MACD. To reduce price noise, the final indicator is processed with an additional Smooth averaging. The indicator has the ability to give alerts, send mail messages and push signals when the direction of movement of th

What is 2 Line MACD Indicator MT4? The 2 Line MACD Indicator, in short, is a technical indicator that assists in identifying the trend as well as its strength, and the possibility of the trend reversal. It is a widespread forex technical indicator that is made of three essential components, i.e. 1. MACD histogram
2. MACD: 12-period exponential moving average (12 EMA) – 26 period EMA
3. MACD Signal Line: the 9-period EMA of the MACD. This Indicator is one that ensures a trader stays profitabl

3C JRSX H Indicator represents a trend-following forex trading oscillator that signals for both market trends and its possible swing areas. Besides, it supports all sorts of timeframe charts available within the forex MT4 platform. Therefore, it can serve all kinds of financial traders providing supports for both scalping and day trading activities. This Indicator can be applied to all kinds of forex currency pairs available in the market. Moreover, its simplicity of use and easy chart demons

The Market Profile Indicator for MT4 displays the price levels and zones where increased trading activity happens. These zones with substantial forex trading activity provide the forex traders with the best entry levels, support, and resistance levels. Moreover, price levels indicate the best reversal zones. As a result, forex traders can identify BULLISH and BEARISH market trends and BUY and SELL entry points as well as the best reversal points. The indicator works well in all intraday timefram

Signal lines are used in technical indicators, especially oscillators , to generate buy and sell signals or suggest a change in a trend. They are called signal lines because when another indicator or line crosses them it is a signal to trade or that something potentially important is happening with the price of an asset. It could be that the price was trending, pulled back , and is now starting to trend or again, or it could signal that a new uptrend or downtrend is starting.
Index name: keklik ma
Use: Ma, MACD, RSI and other technical indicators.
Recommended cycle: 1 hour chart.
Long term trend: EMA 1, EMA 2, EMA 3, EMA 4 moving average arrangement. Default value of EMA: 7,14,21,63. If you want a 1-minute and 5-minute chart, it is recommended to use parameters
EMA1=30;
EMA2=60;
EMA3=144;
EMA4=250;
Short term trend: EMA 1, EMA 2, EMA 3 moving average arrangement.
Operator type: Super radical, radical and moderate. The default

About Scanner:
It will show you the Higher/Lower Highs and Lows of zigzag price. Use it to keep track of best ongoing trends and price ranges. Detailed blog post with free 2 weeks demo (till Sep-2,2022): https://www.mql5.com/en/blogs/post/750232
Symbols:
HH: Higher Highs HL: Higher Lows When price makes higher and higher Highs or higher Lows:
It will count Zigzag in reverse and find total number of last "Higher Highs" and "Higher Lows" or "Lower Lows" and "Lower Highs". LL: Lower Lows

Accelerator Oscillator by Bill Williams with the ability to fine-tune and replace the averaging algorithms of the indicator, which significantly expands the possibilities of using this oscillator in algorithmic trading and brings it closer in its properties to such an indicator as MACD.
To reduce price noise, the final indicator is processed with an additional Smooth averaging. The indicator has the ability to give alerts, send mail messages and push signals when the direction of movement of

SupportResistancePeaks Indicator indicator - is the combination of dynamic support/resitance and price action pattern. As a rule support/resistance indicators uses already calculated, history levels. The most disadvantage of this method - new(incomming) levels always are not the same as were on history, in other words accuracy is not so high as expected. My indicator is looking for dynamic/live levels that are forming right now after trend lost it's power and choppy market starts. As a rule exac
Ticaret yapmanıza yardımcı olacak bir gösterge. Bu gösterge, trend dönüşlerinin yanı sıra geri çekilmeleri de gösterecektir. Ok göründüğünde, trendin yönünü değiştireceği veya ana hareketten bir geri dönüş olacağı anlamına gelir. Her durumda, eğer tüccar bunu önceden biliyorsa, etkili bir şekilde anlaşmalar açmak mümkündür. Bu gösterge değerlerini yeniden çizmez. Ok mumun başında belirir ve orada kalır.
Bu gösterge ile nasıl işlem yapılır: Kırmızı bir ok göründüğünde, bir satış anlaşması

В основу алгоритма этого осциллятора положен анализ веера сигнальных линий технического индикатора RSI . Алгоритм вычисления сигнальных линий выглядит следующим образом. В качестве исходных данных имеем входные параметры индикатора: StartLength - минимальное стартовое значение первой сигнальной линии; Step - шаг изменения периода; StepsTotal - количество изменений периода. Любое значение периода из множества сигнальных линий вычисляется по формуле арифметической прогрессии: SignalPeriod(Numbe
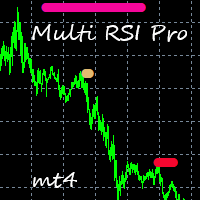
This indicator takes input from the RSI from multiple time frames (M/W/D/H4/H1), and presents the output on the main chart. Great for scalping. Features alerts for the current chart's TrendLine above or below price. TrendLine period setting. Multi RSI period settings. How to use: Simply attach to M5 (Scalping - zoom chart out completely on M5) or use on higher time frames' charts. Zoom chart out completely to get a better view of the chart. Hover over the lines to see the time frame applicable.

Wink IND is an indicator that tell you: -when MACD is saying buy or sell -when RSI is saying buy or sell -work on multi timeframes MT5 Version
by Wink IND: you don't need to have Knowledge about MACD or RSI don't need to check and compare MACD and RSI respectly don't need to check all of timeframes and compare the resaults don't lose time, save more time for your decisions in trading
Wink IND: multi timeframe indicator multi currency indicator show the positions by graphic shapes, arrows an

В основу алгоритма этого трендового индикатора положен анализ веера сигнальных линий универсального мувинга . Алгоритм вычисления сигнальных линий выглядит следующим образом. В качестве исходных данных имеем входные параметры индикатора: StartLength - минимальное стартовое значение первой сигнальной линии; Step - шаг изменения периода; StepsTotal - количество изменений периода. Любое значение периода из множества сигнальных линий вычисляется по формуле арифметической прогрессии: SignalPeriod(Nu
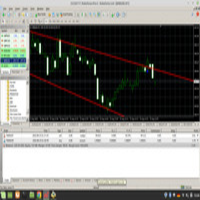
the trend line Alert indicator will inform you when the candlesticks crosses or touches the desired line. the indicator is having pop up and push notifications, see the pictures down how to setup, e.x, 1. pic one is alert 2. pic two is right click of the chart 3. pic three is how to change names of the trend so the indicator will detect 4. pic four is how you changed in the correct way any assistance please drop me via mql5 chat

Trend deviation scalper - is the manual system to scalp choppy market places. Indicator defines bull/bear trend and it's force. Inside exact trend system also defines "weak" places, when trend is ready to reverse. So as a rule, system plots a sell arrow when bull trend becomes weak and possibly reverses to bear trend. For buy arrow is opposite : arrow is plotted on bear weak trend. Such arrangement allows you to get a favorable price and stand up market noise. Loss arrows are closing by common p

Классический Parabolic SAR с цветовой визуальной индикацией действующего тренда и моментов его изменения на противоположный для ручного трейдинга. При необходимости символы сигналов покупки и продажи можно заменить, используя входные параметры индикатора Buy Symbol; Sell Symbol. Номера символов можно найти здесь .
Индикатор имеет возможность подавать алерты, отправлять почтовые сообщения и push-сигналы при смене направления тренда.

Gold Trend Pro Buy & Sell Signal Indicator Pairs : XAUUSD - XAGUSD - Crude OiL, EURUSD,GBPUSD,USDJPY,AUDUSD,GBPJPY,BTCUSD TimeFrame - 1 Min , 5Min, 15Min Once All Are Green Bar , And Also Englufing The Candle You Can Enter To Buy Once All Are Red Bar, And Also Engulfing The Candle You Can Entry To Sell And Next Once Change The Bar Colour , You Can Exit The Buy & Sell Order

Trend driver bars is the manual trading system, which defines current trend continue or it's pull-back/reverse. "Driver" bars - are price action patterns that has powerfull affect on market, defining it's near future direction. Generally, driver bars represents trend "skeleton" and often anticipates new market impulse. System plots arrows when market shows 3 pattenrs in a row(most powerfull combo-pattern), and makes fast scalping of incomming movement. Loss positions closes by common profit. Lot
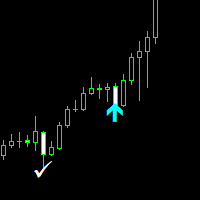
Nasdaq Savages Non-repaint indicator works on all timeframes 1 minute to 15 minutes timeframe for scalpers. 30 Minutes to Monthly timeframe for swing traders The Nasdaq Savages indicator comes with a top right info tab which tells you about the current buy or sell signal, Profit in pips, Stop loss and Target Red arrow is your sell entry signal the white right tick is your exit signal and take profit hit signal Light blue arrow is your buy entry signal the white right tick is your exit signal an
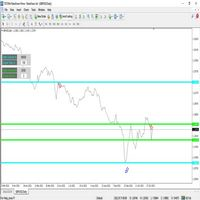
Gösterge Fiyat Kanalı, iki bağımsız fiyat kanalı ve fiyat bölgesi seviyesinden oluşur - (A / B). Gösterge, fiyatların davranışını ve hareketini ve ayrıca kanal seviyelerinin - (A / B) bozulmasını, seviyeleri yeniden düzenlemeyi ve yeni ekstremum ve minimum bölgeleri sabitlemeyi sürekli olarak izler. Önceki ve mevcut en yüksek ve en düşük seviyelerin analizi için, her kanaldaki çubuk sayısına bağlı değildir - (A / B). Gösterge, grafikteki her kanal için yararlı bilgiler görüntüler - (A/B): 1. He
Calculate 28 pairs buy and sell volume real-time.
This Indicator is good for all trader. It will increase the accuracy and decision making of placing orders. It shows the strength and weakness of every currency. It's a great help to you. CurrencyStrength28pairs - The indicator calculates the price and the buy and sell volume of every currency pair. Show you the results on the board in real time. and averaged all currency pairs to show the strength of the current currency. Features
Result on t

Wave Impulse OmegaScalper - is the manual system for scalping. In many cases Indicator "eats" almost all possible trend wave. System defines up price wave and down price wave. Inside the exact wave - system defines true trend movement and choppy market. Indicator plots signals while market is trending, powerfull and has quiet good volatility. This is complete system with enter and exit points. Main Indicator's Features Signals are not repaint,non-late or disappear(exept cases when system recalcu
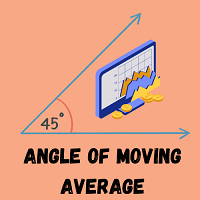
Angle of Moving Averages This indicator is very simple yet powerful concept which constantly calculate the slope of the current bar moving average with respect to the N bar before moving average value. This no only give a good entry and exit signal but also it shows traders the strength of the signal. It shows positive green histogram when market is moving toward upward direction and red histograms for downtrend. When large histograms found means market has very strong trend. Inputs Available
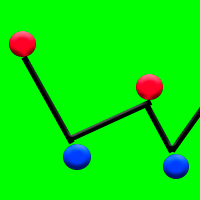
Dot scalp - shows price reversal points with 93% accuracy. Does not redraw points. Works well during sideways price movement when the market is flat. The indicator draws the points of price reversal or pullbacks on the chart.
How to use this indicator in trading? Add the Dot scalp indicator to the chart. Also download on the Internet any channel indicator that shows the channel on the chart. Wait for the sideways movement of the price, this is when the channel indicator draws a channel in t

Reverse side scalper is the manual trading system, that works on choppy(anti-trend) market. As a rule markets are on 80% choppy and only 20% is trend phase. System is based on custom step Moving and RSI and reverse pattern. System defines up movement, down movement, trend / choppy phases. Indicator plots Buy signal arrow when current direction is down and phase is trend, Sell signal arrow is plotted when currently is up movement and phase is trend. As a rule it allows to "catch" local maximum/mi

Binary step clouds - is the complete trading system with enter and exit points. System is based on double smoothed exponential step moving and volume weighted simple step moving.Generally each movings define trend direction and places when trend is in active phase. Signals plots when both movings approache to active trend phase and market speed is high. Main Indicator's Features Signals are not repaint,non-late or disappear(exept cases when system recalculates all history datas,refreshing main
MetaTrader Mağaza, MetaTrader platformu için uygulama satın almak adına rahat ve güvenli bir ortam sunar. Strateji Sınayıcıda test etmek için Uzman Danışmanların ve göstergelerin ücretsiz demo sürümlerini doğrudan terminalinizden indirin.
Performanslarını izlemek için uygulamaları farklı modlarda test edin ve MQL5.community ödeme sistemini kullanarak istediğiniz ürün için ödeme yapın.
Ticaret fırsatlarını kaçırıyorsunuz:
- Ücretsiz ticaret uygulamaları
- İşlem kopyalama için 8.000'den fazla sinyal
- Finansal piyasaları keşfetmek için ekonomik haberler
Kayıt
Giriş yap
Gizlilik ve Veri Koruma Politikasını ve MQL5.com Kullanım Şartlarını kabul edersiniz
Hesabınız yoksa, lütfen kaydolun
MQL5.com web sitesine giriş yapmak için çerezlerin kullanımına izin vermelisiniz.
Lütfen tarayıcınızda gerekli ayarı etkinleştirin, aksi takdirde giriş yapamazsınız.