YouTubeにあるマーケットチュートリアルビデオをご覧ください
ロボットや指標を購入する
仮想ホスティングで
EAを実行
EAを実行
ロボットや指標を購入前にテストする
マーケットで収入を得る
販売のためにプロダクトをプレゼンテーションする方法
MetaTrader 4のための有料のテクニカル指標 - 85

Test Confluence OB , es un indicador ideal para unir de 1 hasta 8 indicadores de todo tipo, siempre en cuando tenga búffer habilitado, busca confluencias y alineamientos.
¿tienes una estrategia basado en varios indicadores?
Con " Test Confluence OB" puedes testearlo, el indicador lanzará una alerta y flecha en los puntos de confluencia ó alineación que estás buscando; ahorrandote tiempo y dinero.
Para estrategias de Opciones Binarias puedes emplear el Display que tiene para testear rápid
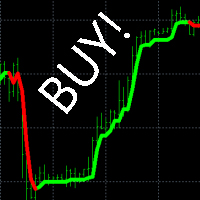
"Buy Sell Alert" - an indicator that shows the trader where the trend is going and when to open a deal. If the indicator draws a green line on the chart, we open a buy order. If the indicator draws a red line on the chart, we open a sell order.
Benefits of the indicator: latency percentage less than 3% signal accuracy over 96% does not redraw its values to build a trading strategy, it is enough to use this one indicator. very easy to set up works on all currency pairs and all times Description
Очень точный индикатор, с его помощью очень легко определять барные паттерны.
Это очередная разновидность ЗигЗага, за исключением, он не рисует текущую линию, которая может перерисоваться,если нарисовал конечную точку, по закрытому бару, то больше ее не изменяет - это означает смену направления и следующая точка будет другого цвета. Может быть применен как для определения основного движения, при использовании увеличенных параметров, так и непосредственно для входа с минимальным риском. Очень х
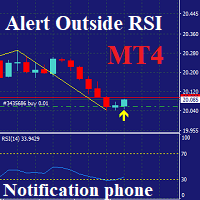
Notifications outside of RSI: only MT4 Send phone Notification and window alerts when price Over RSI: Default: Over Buy RSI=70 & Over Sell RSI=30. You can set the value Alert, Notification, Over Buy, Over Sell. And On OFF Alert on Terminal, Notification on Smartphone. Notifications - Client Terminal Settings - MetaTrader 4 Help
How to Setup MT4/MT5 Mobile Alerts Right to Your Phone (forexschoolonline.com)
The indicator plots the Up and Down arrows on every price swing made by the classic Zigzag indicator. When Zigzag makes a new swing low, a green arrow is plotted. Likewise, a red arrow is plotted when Zigzag makes a new swing high.
Features
Compared to the classic ZigZag, it marks the swing points more effectively. It helps to identify the forming chart patterns in advance. It comes with a Multi-Timeframe scanner which shows the Zigzag direction on each timeframe. All Metatrader alerts included
The indicator measures the buying and selling force between the buyers and sellers in the form of a histogram/oscillator by using a BOP equation:
BOP = Moving Average of [close – open)/(high – low)]
Igor Levshin first introduced the Balance of power in the August 2001 issue of Technical Analysis of Stocks & Commodities magazine.
Features
Quickly find the buying and selling pressure among the traders. It comes with simple inputs and an interface. All Metatrader alerts included.
Applications

これは、2005年にAlan Hullが開発したクラシックなHMAを改良したバージョンです。3つの加重移動平均(WMA)を組み合わせることで、従来の移動平均線よりも遅延を効果的に減らしています。 ロングエントリー: HMAが赤から青に変わり、上向きの傾きになるとき。 ショートエントリー: HMAが青から赤に変わり、下向きの傾きになるとき。
特徴 すべての時間足で新しいシグナルをスキャンするマルチタイムフレームスキャナーを搭載。 HMAは、従来の移動平均でよく見られるラグ(遅れ)を効果的に軽減します。 新たに発生するトレンドの開始と終了を識別します。 すべてのMetaTraderアラートに対応。
HMAの計算式 Hull移動平均は、以下の3つのWMAを使って計算されます: WMA1 = P × WMA WMA2 = P/2 × WMA Raw HMA = (2 × WMA1) - WMA2 Final HMA = Raw HMAのWMA(√P) P = 期間 WMA = 加重移動平均
プロのヒント
HMAは単体でも使用可能ですが、他のインジケーターと組み合わせることで精度が向上

"M1 Scalping Turbo" - indicator for intraday scalping. With this indicator, you can trade on M1, M5, M15, M30, H1 timeframes. We recommend currency pairs GBPUSD, EURUSD, USDJPY, USDCHF, USDCAD, EURAUD, EURCAD, EURNZD, GBPCAD, GBPAUD.
Trading rules:
The indicator shows with arrows on the chart when you need to open a deal, in which direction to open a deal, where to put TakeProfit and StopLoss. Lot size is up to you. We recommend using no more than 10% of the deposit for 1 trading transaction

Работа индикатора показана в видео во время тестирования на исторических данных. Индикатор поддержек сопротивлений в основном создавался для H4, хотя возможна работа и на других таймфреймах. Присутствует алерт появления очередной поддержки или сопротивления. Также в индикатор встроены восходящая поддержка и нисходящее сопротивление, которые неплохо себя показали. Есть возможность отключения лишнего. Для удобства на экран выведены кнопки, которые работают онлайн. https://youtu.be/UHhM1J-sX2E

このインジケーターは、ogiveの形状に基づいています。このような形状は、航空力学および宇宙技術で使用されます。弾丸でさえ、ある種のオギバルの形をしています。 テクニカルインジケーターでこのようなフォームを使用すると、インジケーターの感度と安定性の間の妥協点を見つけることができます。それはそのアプリケーションで追加の可能性を与えます。 インジケーターパラメーター: iType -ogiveフォームのタイプ。 iPeriod -インジケーター期間。 iFactor は、放物線および指数形式で使用される追加のパラメーターです。有効な値は0〜255です。iFactor= 0の場合、インジケーターは単純な移動平均に縮退します。 iChannel -価格が変動する上位および下位チャネルを構築できるようにするパラメーター。有効な値は-128〜127です。値が正の場合は上部チャネルが描画され、値が負の場合は下部チャネルが描画されます。 これらのパラメーターを組み合わせることにより、さまざまな結果を得ることができます。このインジケーターは、市場のトレンド価格の動きを追跡するために使用できます。チャネ

VIP signal for binary options.
This indicator was created specifically for binary options. Set up for profitable work in binary options.
Try this indicator if you want to trade binary options profitably.
The terms of trade are very simple. We are waiting for directions. We open a deal on the current timeframe in the direction.
< < < Indicator non repaint > > >
Many users have already rated it positively. The results will surprise you too.
According to the test results, this indicator per

Provides Regression Channel on the current chart. Combined by Trend of Moving Averages and Multi timeframes Oscillator Indicators: CCI, RSI, Stochastic, and MACD with specific working logic . It could make us easier to identify swing high-low as an entry point, the retracement area while following the current trend. Consists of 2 types of signal, main and secondary. The main signal will draw very clearly triangle and lines on the chart with the word " BUY" or 'SELL'. and the secondary is the sta

This Beautiful Real Entry indicator is designed for signal trading. This indicator generates trend signals.
It uses many algorithms and indicators to generate this signal. It tries to generate a signal from the points with the highest trend potential.
This indicator is a complete trading product. This indicator does not need any additional indicators.
The indicator certainly does not repaint. The point at which the signal is given does not change.
The indicator has a pips counter.
Индикатор iVeles_Channel_Extremum_II_MTF вычисляет точки слома направлений движения цены на установленном в параметрах ТФ, на основе этих точек и выбранного их количества строится основной канал цены, который можно использовать в качестве уровней поддержки и сопротивления для меньшего ТФ, на котором установлен индикатор. В зависимости от направления движения основного тренда рассчитывается средняя линия канала по уровню Фибоначи, от которой, как правило, идет отскок в сторону тренда. Также по ур
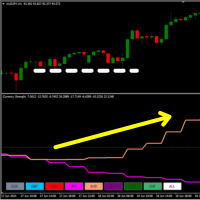
28 market in a Single Indicator! You have 8 Lines and each represents a currency { EUR - USD - GBP - JPY - AUD - NZD - CAD - CHF } .
What It Does? It calculates a custom oscillator on all 28 Forex Pairs and draws you the Strength of each currency. This way you can analyze the Trend and the Volatility on a Multicurrency Rate. Also by Clicking on two different currencies instantly changes the market.
How To Use It? You can use this indicator to find true market contractions when two currencie

FinArk Support and Resistance is an indicator that will detect support and resistance zone that are drawn on the chart by automatic. Supply Demand uses previous price action to identify potential imbalances between buyers and sellers. This trend detection indicator will compliment any strategy and can also be used as an independent tool.
We can enter in good price with this Indicator, in order to follow the strong demand on the current instrument.

MT4のサイクル識別子インジケーターは、フィルターされた価格アクションシグナルを生成し、トレーダーが売買ポジションを開くのに適切な条件を特定するのを支援します。
Cycle Identifier MT4インジケーターは、短期および長期のトレーダーの両方にとって、カスタムインジケーターの優れた選択肢です。 Cycle Identifier MT4は、フィルターされた価格アクションシグナルを生成して、トレーダーが売買ポジションを開くのに適切な条件を特定するのを支援します。
使い方 Cycle Identifier MT4インジケーターは、メインチャートの下の別のインジケーターチャートに表示され、そこで振動する灰色の線が描画されます。この灰色の線は、市場のトレンドとトレンドの勢いを示すために、それぞれ緑と赤のバーを伴う上向きと下向きのスパイクによって特徴付けられます。
バックグラウンドでは、インジケーターはスムーズ移動平均(SMA)、相対力指数(RSI)、および価格アクションフィルターインジケーターの組み合わせを使用します。これにより、インディケータは市場トレンドを識別し、その強さ(
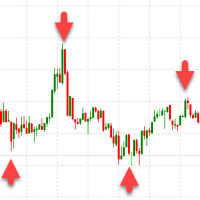
Scalping trader - the indicator is designed for intraday trading (scalping). Does not redraw arrows. Shows possible price reversals on the chart with arrows. The accuracy of the signals is approximately 96%. That is, in 96% after the arrow appears on the screen, the price will go in the opposite direction by at least 40 points for the GBPUSD pair. The trading strategy is very simple. We are waiting for the arrow to appear on the chart. After the arrow appears, open an order in the direction of
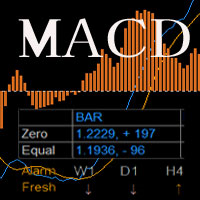
MACD with two lines and bar,
Predict the price, moniotr all period, play sound when it changed.
If there is any other need, contact me.
MACD = [stockPrices,12]EMA - [stockPrices,26]EMA signal = [MACD,9]EMA divergence = MACD – signal User Inputs Fast EMA Period - Fast moving average line, the default period is 12. Slow EMA Period- Slow moving average line, the default period is 26. Signal SMA Period - set signal period , the default period is 9.

Индикатор iVeles_MACD_Pro представляет симбиоз обычного индикатора MACD или разницу показаний между двух динамических МА, рассчитанных по текущим ценам инструмента. Сигнальная линия отсутствует, но ее заменяет более точные динамические облачные уровни.
Хорошо показывает разворотные моменты, позволяет точно определять дивергенции. Имеет цветовое сопровождение изменения показаний.
Параметры: period_Fast - период быстрой МА period_Slow - период медленной МА price_Bar - применяемая цена level -
Индикатор iVeles_RSI представляет собой обычный RSI, привязанный к нулевой отметке . В отличии от обычного RSI, наложены уровни сигнала в виде облака, что заметно расширяет области применения данного индикатора.
Очень хорошо показывает разворотные моменты, так же позволяет точно определять дивергенции.
Параметры: period - период RSI price - применяемая цена level - уровень облака
Индикатор iVeles_RVI представляет собой обычный RVI, с пересчитанными и приведенными значениями . В отличии от обычного RVI, наложены уровни сигнала в виде облака, что заметно расширяет области применения данного индикатора.
Очень хорошо показывает разворотные моменты и циклы тенденций, так же позволяет определять дивергенции.
Параметры: period - период RVI price - применяемая цена level - уровень облака

Индикатор iVeles_DeMarker представляет собой обычный DeMarker, с пересчитанными и приведенными к нулю значениями . В отличии от обычного DeMarker, наложены уровни сигнала в виде облака, что заметно расширяет области применения данного индикатора.
Очень хорошо показывает разворотные моменты и циклы тенденций, так же позволяет определять дивергенции.
Параметры: period - период DeMarker level - уровень облака
Индикатор iVeles_CCI представляет собой обычный CCI . В отличии от обычного CCI, наложены уровни сигнала в виде облака, что заметно расширяет области применения данного индикатора.
Очень хорошо показывает окончание трендов, разворотные моменты и циклы тенденций, так же позволяет определять дивергенции.
Параметры: period - период CCI price - применяемая цена level - уровень облака
Индикатор iVeles_Moment представляет собой обычный Momentum, с пересчитанными и приведенными к нулю значениями . В отличии от обычного Momentum, наложены уровни сигнала в виде облака, что заметно расширяет области применения данного индикатора.
Очень хорошо показывает разворотные моменты и циклы тенденций, может применяться как основной сигнал для входа в позицию.
Параметры: period - период Momentum price - применяемая цена level - уровень облака
The best indicator for Binary Options is now available at the MQLMarket, this version is already configured and optimized to operate with Binary Options, Forex and Cryptocurrencies. It is composed of a momentum algorithm that looks for better opportunities in the market, bringing you the best points to open your positions with low risk and high proportion of gain.
The MQL version can also be incorporated into the MT2 signal automator.
Product features Common signals (Oscillator) Super
***SALE NOW ON***
We've all been there, searching for that profitable trade wading through 25 pairs but missing out because we didn't see it in time.
This is why I say trade simple trade effective and why I designed this scanner to keep watch on the markets that are trending and where a pullback could be able to happen.
Features:
Automatically looks at up to 28 pairs at the same time to save you from having to. Easily adjustable EMA settings to your own critera (Fast, Mid and slow settings
Perfected Stochastic HTF (Higher Time Frame) is perhaps the most advanced and reliable HTF indicator. Highly optimized in terms of execution, the indicator comes with standard settings of the Stoch indicator which is supplied with the MT4 platform. Place the indicator on the chart, any timeframe. You may select a higher time frame in indicator inputs. The same indicator can be used on a chart multiple times to draw Stoch from multiple timeframes or for different Stoch values. A must-have tool t
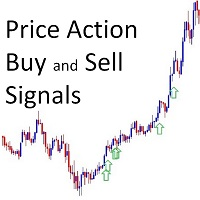
Buy and Sell Arrows On The Chart According To Price Action Sends Alerts On MT4 To Your Phone To You Email
Does NOT repaint. Works on any pair, any timeframe.
10 Activations allowed so you are free from limitations. MT5 Version here . For spreads from a tiny 0.1pip RAW/ECN Accounts, click here . Check out my Waka Esque EA signal here: >> High Risk Settings or Medium Risk Settings .
When you get a signal, all you need to do is check the previous structue highs and lows to use as your
Индикатор iVeles_Trend_X_II - использует специализированный расчет текущих цен графика. Очень качественно и своевременно показывает смену направления, более того, отображаемая цена индикатора может быть использован в качестве уровня принятия решения. Работает качественно на любом ТФ и с любым инструментом. Параметры: period - период расчетов average - усреднение МА method - применяемый метод shift - сдвиг показаний
Индикатор iVeles_Perfect_Oscilator является опережающим и одним из самых лучших осциляторов на сегодняшний день, использует специализированный расчет текущих цен графика. Очень качественно и своевременно показывает смену направления, очень точный подход к уровням перекупленности и перепроданности, что позволяет своевременно принять решение по сделке. Работает качественно на любом ТФ и с любым инструментом. Параметры: period_Osc - период расчетов average_Osc - усреднение МА method_Osc - прим

AlgoKing Chandelier Exit Indicator (MT4)
The Chandelier Exit Indicator is a volatility based indicator that maximizes returns using the Average True Range (ATR) value and the highest high or lowest low of a period. Benefits Should be used as a trailing stop. Helps you exit a position when you have a respectable profit. Identifies a high probability of a trend reversal when the price moves against the prevailing trend by a distance equal to 3x the average volatility. Join the AlgoKing Lightning

The indicator refers to the means of probabilistic analysis. Prediction is performed by the Monte Carlo method together with a mathematical model of a neuron. But, the modeling of samples for this method is made not artificially, but comes from the original "nature", that is, from history. The number of samples and the detail of their modeling is achieved using the lower (relative current) timeframe.
Indicator algorithm :
In general terms, the algorithm boils down to the fact that the indica

DYJカメレオンはトレンド追跡と逆トレンドシステムに基づいている。 DYJカメレオンは高確率インジケータである。この指標は独特の混合指標を用いて、複雑な指標とユーザーの判断力を結合する。 この指標は最先端のMa交差と分散アルゴリズムである。 このインジケータは、トレーダーの最適な進入位置と退出位置を示すカラー方向矢印を表示します。 入場がBUY信号であると同時に、前回入場SELLのオフ信号でもある. メールや携帯電話のプッシュで信号通知を受信し、携帯電話で手動で倉庫を開けておくことができます パラメータ InpPeriod = 50 -- Period InpPrice = PRICE_TYPICAL:好みや取引習慣に合わせて、より良い通貨を選択できる価格適用方法価格方法 InpMethod = MODE_SMA--4種類のMAモード方法、MODE _SMA,MODE_EMA,MODE_SMMA,MODE_LWMA

UR ダイバージェンススポッター
UR DivergenceSpotter は、長年の経験の結果であり、時には最も簡単な方法が最善です。 いくつかの指標の間には良好な相関関係がありますが、それらが一致しない場合 (価格は「再調整」しようとします)、UR DivergenceSpotter でシグナルを受け取るのはその瞬間です。
UR Divergence Spotter を使用する利点:
パラメータなし ろうそくの作成後に再描画しません シグナルが有効でなくなった場合のシグナル (つまり、トレードをより長く保持し、ストップ ロスを BE に設定して乗り、部分的な利益を得るか、完全に閉じることができます!)。 この指標は、長年の経験と観察の結果です。 それはしっかりしていて、テスト済みです。 より良い結果とより安全な信号を得るには、より高い時間枠 (h1/h4) で使用するのが最適です。
加えて、UR TrendExhaustion や UR VolumeTrend などの私の他のインジケーターと一緒に使用して、シグナルの精度を高めることもできます。 ツールの最新情報を入手

UR ボリュームトレンド
UR VolumeTrend は、出来高の継続的な傾向を示す最も明確な出来高インジケーターです。 UR TrendExhaustion などの他のインジケーターと完全に連携して、ローカルのトップとボトムを示します。
パラメータは 2 つだけに制限されています。値が高いほど、トレンドが長く表示されます。 極端な勾配は、潜在的な反転を捉えるためにボリュームが枯渇する可能性を示しています。 2 本の線 - 出来高の傾向と平均です。 最大の利点: 簡単で、すべてのアセットに合わせて調整できます。 ツールの最新情報を入手できる特別な電報チャットがあり、何か不足していると感じた場合はリクエストを送信することもできます!
UR VolumeTrend を選ぶ理由
トレンドを捉えるには出来高が鍵となることは誰もが認めるところです。 このオシレーターは、1 つの使いやすいインジケーターに圧縮されたすべてのボリューム ツールの合計です。 見やすい方法で正/負のボリュームを示します。 背後にあるインターフェイスは、ボリュームが過去に比べて使い果たされている可能性があ
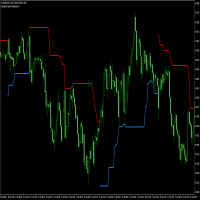
TP Trend Bars Indicator is a trend following technical indicator which is based on price action focusing on the swing highs and lows.
This indicator plots 2 types of lines. The first line is a dotted line, represnting the short-term trend. The second line is a solid line, representing the long term trend
Lines which are below the price action when on a bullish trend and above the price when the trend is bearish The solid line also changes color to indicate trend direction

Professional Support&Resistance Indicator. This indicator is primarily intended for professional use by brokers. There are countless options to choose from and it is one of the best tools in the stock market today. The indicator is optimized for use with EAs.
For programmers to retrieve output index value is for MQL4; (EXAMPLE)
bool buySNR=false,sellSNR=false;
char count=100;
char limit=1;
char dist=3;
for(short cnt=0;cnt<=count;cnt++)
{
double snr_middle=iCustom(NULL,TF_,"::Indicators\\SN

极大的提升了交易感官,一目了然的走势展示,简洁高效。 极大的突出展示了行情的趋势脉络,跟随时间周期适应变化,替用户交易者研判了行情走势,简洁高效 同时我们还提供了主窗口和副窗口的展现,有需要可以联系我作者本人,感谢支持。 像传统的renko,又不是传统的renko,技术在发展,同样的砖图可以有不一样的绘制和计算展现。 希望可以帮到大家的交易,再次感谢。
极大的提升了交易感官,一目了然的走势展示,简洁高效。 极大的突出展示了行情的趋势脉络,跟随时间周期适应变化,替用户交易者研判了行情走势,简洁高效 同时我们还提供了主窗口和副窗口的展现,有需要可以联系我作者本人,感谢支持。 像传统的renko,又不是传统的renko,技术在发展,同样的砖图可以有不一样的绘制和计算展现。 希望可以帮到大家的交易,再次感谢。

Fractal Structures Breakout Trader !!SPECIAL PRICE FOR THE FIRST 10 COPIES!!
A next generation powerfull indicator which brings a new approach to fractal theory Indicator tries to scan and find the fractal breakouts. Momentum, price action and harmonic calculations are also used to complete the algo. Advantages: No Repaint Works on all chart timeframes. Works for every instrument including Currency Pairs, Gold, Oil, Commodities, Indices, Stocks and Cryptocurrencies. Easy to use. User and CPU fr

Price pivot points H1 - an indicator that shows price pivot points on the H1 timeframe with an accuracy of up to 95%. 95 signals from 100 will accurately indicate the place of the price reversal in the opposite direction. The indicator does not redraw its values. Suitable for trading on any currency pair. It can be used for both intraday scalping and long-term trading. Price pivot points H1 shows signals as arrows. When the price reverses, the indicator will draw an arrow on the chart. If the p

This Indicator is a very Simple Method to make profit from the market! it has two arrow directions up and down. you can easily buy when you see up arrow and close it when you see down arrow. you can use it for Binary Options too! you also can use it with other indicators like Heiken Ashi and Ichimoku to make a complete System of Trading. it has just two Input Options: nBars: The Number of Candles you want to see the Signals for. ShowPanel: to display or not to display the Panel DoAlert: to Send

Indicator Support and Resistence plain in your chart seven lines; Red line=Resistence 3. Red line=Resistence 2. Red line=Resistence 1. Yellow line= Pivot. Green line= Support 1. Green line= Support 2. Green line= Support 3. adattable in all timeframe (minute 1, minute 5, minute 15, minute 30, Hour 1, Hour 4,Day 1,Week 1,Mounth 1); Buy under support and sell over the resistence;


This is another Arrow Indicator to show the instant direction of the Market. it's no repainting and no lagging. you can easily trade by it's direction or use it on your own System. the later is recommended! you can use it on Automatic Experts too. it's input parameters are consists of: nBars: Number of Bars to be checked EnableAlerts: to send Alert messages when get new Signal. EmailAlerts: to send you Email for new Signals you can simply use it on any Symbol or Time Frame after checking for it'

Magic Lines MT4 is an indicator which can be categorized as trend, levels and channels type. It draws a colored line which is colored in green and red depending where last close is. The value at the current open bar should not be taken into account. This part of the indicator can give us a sense whether it is trending up or down or its going sideways. Magic Lines indicator also draws blue top and bottom levels which can be taken into account for breakouts and false breakouts. A sideway zone shou

It could help to calculate Risk-Reward easily before placing a BUY-SELL position. TradeSizeCalculator is a Multi-Tasking Calculator. It will calculate the others when we define the value in one of the columns. Stoploss, risk percentage, risk-money, lot size, take-profit , reward-money, and reward-ratio. Depending on which value is changed. All values in the columns are editable. Also, we can get those calculation results by drag-drop the stop-loss/take-profit line. Parameter: The inputs below ar

For Nasdaq trading, the most important principle is to know the trend of the fund.
This indicator with 6 green and red lights provides you with the daily path of this important indicator.
This indicator has been tested for 6 months and has a win rate of over 85%.
Be sure to contact me before purchasing to get the necessary instructions on how to use and set up this indicator.
You should use a broker that has dollar index, vix, and commodities. MT5 Version
You can contact us via Instagram, Teleg
CFF Follow Me
*** 10 Copies left for next price $613***
* Entry signals without repainting or delays * Error-free opening of trades * Provides signals for any direction sell & Buy * Provides multiple timeframes on a single chart * Colored Histogram based on the market direction * Arrows entry signals
How does the CFF Follow Me Works?
Our CFF Follow Me trading system based on a very accurate "Trend-Following" Trading Strategy. Here's how to Start using our Syste
AI Signal is an indicator that is a ready to made scalping system that doesn't repaint
Instructions: Load indicator. Use arrows as entries in trends and stay out of sideways markets. Trade with the larger trend and trade only active volatile hours Buy blue arrow above yellow and exit at red arrow or at discretion. Sell red arrow below yellow and exit at blue arrow or at discretion.
Easy to follow and is based on trends. The indicator works on all time frames and assets. Use at your own d

Indicator help you recognize trend quickly ( recommended to use TF M30-Daily ) Parameters: Alert when have signal Push Notification to MT4 mobil2 Benefits Easy to use. input parameters is simple The ability to use as filter for any strategy. It work on stock, index, oil, gold, and on all time frames. It has the function of push-notifications, and sound alerts. Importance : Non Repainting Indicator

Diagnosis of major and minor pivot
Trend detection
with many signals
Can be used in all symbols
Can be used in all time frames
Settings:
Back Show: The number of candles it displays
If you need any adjustments, or have any questions or suggestions, message me
How to trade:
Blue: sell signal
Red: buy signal
Blue and red at the same time: no signal
Exit signal: Opposite signal

Forecasting the future by combining trend and average price
with many signals
Can be used in all symbols
Can be used in all time frames
Settings:
BackShow: The number of candles displayed
Osi: Main setting, the larger the number, the longer the trend
If you need more settings, or have any questions or suggestions, message me
How to trade:
Blue: sell signal
Red: buy signal
Blue and red at the same time: no signal

URの高値と安値
UR Highs&Lows は、価格の動きとそのボラティリティを詳細に分析し、価格が変動するチャネルを作成します。 そのチャネルは現在、オシレーターとして動き、価格の偏差と重ね合わされて、潜在的な枯渇と反転の可能性を示しています。
UR Highs&Lows を使用する利点:
パラメータなし 価格の動きを表す 3 本の線があります - 価格の平均である白線と、その極値である青線です。 ヒストグラムは、価格のコンテキストにおける最大偏差の視覚化です インターフェースは、両極端 (上部の赤と下部の青の領域) のいずれかの線の枯渇を示しています。 最大の利点: 簡単で、すべてのアセットに合わせて調整できます。 ツールの最新情報を入手できる特別な電報チャットがあり、何か不足していると感じた場合はリクエストを送信することもできます!
なぜ UR の高値と安値なのか?
このインジケーターは、スタンドアロンのエントリーまたはエグジット インジケーターとして使用できます。 価格に依存しているため、すべてのチャートに適用でき、偏差計算アルゴリズムは数年の経験と観察に基
Binaripexはバイナリーオプションの指標です 。インジケーターはチャート上に矢印で表示され、近い将来価格がどちらの方向に進むかを示します。私たちの統計によると、95%のケースで、近い将来(短い時間枠で1分から5分)の価格は矢印の表示より上または下になります。これにより、バイナリーオプションの取引にこのインジケーターを高効率で使用できます。また、チャートのインジケーターは、各トランザクションの近くで、価格が正しい方向に進んだ距離を示します。 M5タイムフレームで取引する場合、95%のケースで、価格が30ポイント以上正しい方向に進むことが視覚的にわかります。
インジケーターの利点: 再描画されません いくつかの動作モードがあります バイナリーオプションまたは外国為替スキャルピング用に作成 すべての通貨ペアと時間枠でシグナルを表示します とても使いやすい 電話と電子メールに信号を送信します インジケーターの設定: .period-価格分析の計算期間。 .border-信号フィルター。 mode_price-計算が行われる価格:OPEN、CLOSE。 arrow_size-矢印のサイ
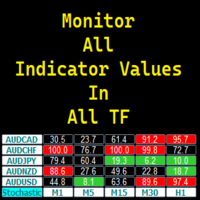
ALL in ONE Indicator Display Indicator values in all Timeframes Display Multiple Symbols/Pairs Fully customizable Click any value/box to open the chart of the corresponding symbol and timeframe Attach multiple instance of the program to display other indicator values Flexible Dashboard Positioning in chart You may request more indicators or additional feature for future updates!
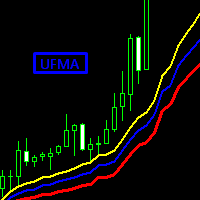
NEW FEATURE ! Now you can select the option of two MA to see the amazing MA cross of Two UFMA.
With the fast reaction of this MA you can avoid most of the false signals of a normal MA Cross.
New formula to calculate moving average, it quickly adapts to the price but maintains the analysis to determine if a change in trend is necessary.
Input Parameters:
Period: used to select the number of bars to use for calculations. Mode: Mode to use for the calculation of the moving average > SMA, EMA, S
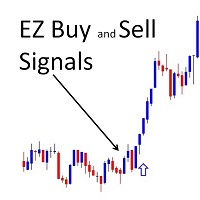
!! FLASH SALE !! Over 80% off !! For ONE week only. Now only $47 - normally $297! >>> Ends on 30 June 2023 - Don't miss it!
Buy and Sell Signals Directly Onto Your Charts. It couldn't be EZ-er! Aslo Gives Alerts – On Your MT4 To Your Phone To Your Email.
Does not repaint! This couldn't be EZ-er to use - just drag it onto your chart (any timeframe, any pair) set the time of day you want signals and where you want alerts, and wait for the signals. Spreads from 0.1pip RAW/ECN Accoun
Reminder: After purchasing the unlimited version of this indicator send me the proof and I will add you to my private group so that you join the community and continue to learn more about this tool and grow together with other traders. You will also learn the strategy that will change your trading story! Dear Traders I am so glad to introduce my forex trading product called "Day Traders Master Board". This tool is designed for serious traders of any trading strategy. My goal is to help trader b

Golden section price action indicator - is a trend-scalping complete system with enter and exit points. Indicator is based on most powerfull price action japan patterns that are filtered by volume, volatility, market phase. Pattern is not a simple combinations of candles. Patterns must have "weight" to move market in right direction. "Weight" - is the summary of pattern's volume, the size of pattern candles according to last average volatility and ofcourse pattern must appear in correct market p

NOTE: NEXT PRICE WILL BE 550$ Dear Trader I hope you have been eagerly waiting and looking for a tool to improve your trading. I am so glad to introduce my other product to you called Trend Shooter Index. The main goal of this tool is to help traders shoot the trend (target the trend) from the bottom or from the top of the trend for maximum profitability. How is the Indicator designed
This tool is designed to show the following Red arrows pointing down for sell signals. Blue arrows pointing up f
Fixation Trend indicator showing buy and sell areas. The indicator follows the price movement, works at the opening price. It also displays information about the trend following the breakout of the minimum and maximum. The indicator has very simple but effective graphics: above the opening price, an orange dot is displayed - a sell signal, below the opening price - blue, a buy signal. The indicator also accompanies the signals with a sound alert and a pop-up window notifying the signal on the op

The Mechanism Trend indicator is a hybrid indicator that shows the moments for entering the market with arrows. This indicator was created on the basis of the original indicators for searching for extreme points, the indicator is well suited for determining a reversal or a large sharp jerk to one side.
When the trend changes, the Mechanism Trend indicator uses color signaling: green - when changing from a downtrend to an uptrend, and red - vice versa, to a downtrend. You can use the indicator
Are you tired of the constant ups and downs? Do not become a victim of unstable market movements, it's time to get rid of it somehow! Already now you can use The Trend Setter solutions to balance the price movement analysis and get a clearer picture of the price action.
The Trend Setter is a trend indicator for the MetaTrader 4 trading platform. If you don't have your own trading strategy yet, you can use our ready-made trading strategy. The indicator will help in finding entry points when ana

Polynomial Trend - A tool that allows you to determine the direction and strength of a trend. Unlike most indicators, Polynomial Trend finds longer-term trends and gives fewer false signals. This indicator allows you to find the most likely trend reversal points b allows you to identify the current market phase (uptrend, downtrend).
This indicator displays arrows of different colors depending on the current state of the market and thus signals the user about a change in trend. It is easy to us

Shift Trend is a forex trend arrow indicator for identifying potential entry points. Determining the market trend is an important task for traders. The Shift Trend indicator implements an advanced algorithm for visualizing the market trend. Shows the opening points of transactions for sale or purchase, and also indicates the direction of the trend on: short-term and long-term periods. Suitable for trading on low timeframes because it ignores sudden price spikes or corrections in price action by

What are "pivot points"? Pivot point analysis is often used in conjunction with the calculation of support and resistance levels, as is the case with trend line analysis. Pivot point analysis calculates the first support and resistance levels using the trading range width between the pivot point and the previous day's high or low price. The second support and resistance levels are calculated using the entire width between the previous day's high and low prices.
Looking for a quality pivot poin

A useful dashboard that shows the CCI values for multiple symbols and Time-frames.
It can be easily hidden/displayed with a simple click on the X top left of the dashboard.
You can input upper and lower CCI values and the colours can be set to show when above/below these values. The default values are 100 and 30-100 There are also input colours for when the CCI is positive or negative (but not exceeding the upper/lower levels
Symbols and time-frames are input separated by commas.
Symbols
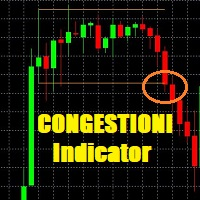
This indicator is very usefull to TRADE Trading Ranges and helps identify the following TREND. Every Trader knows that any market stay 80% of the time in trading ranges and only 20% of the time in TREND; this indicator has been built to help traders trade trading ranges. Now instead of waiting for the next TREND, You can SWING TRADE on trading ranges with this simple yet very effective indicator.
TRADING with CONGESTIONI INDICATOR:
The CONGESTIONI Indicator identify a new trading range and ale
AverageDirectionalIndex-改善されたインジケーター式。このバージョンのADXは、価格の反転ポイントと現在のトレンドの方向をはるかに正確に決定します。さらに、この指標を使用して、トレンドの強さを判断できます。緑の線が下から下の赤の線と交差する場合、これはトレンドが上向きになっている、または一時的な引き戻しが形成されていることを意味します。赤い線が緑の線と上から下に交差している場合は、トレンドが下降しているか、一時的な引き戻しが形成されていることを意味します。
AverageDirectionalIndexインジケーターと取引するにはどうすればよいですか? 購入取引。チャートにAverageDirectionalIndexインジケーターを追加し、標準の移動インジケーターを追加します。価格が移動平均を上回っている場合、緑の線が下から赤の線と交差する瞬間を待って、買い取引を開始します。 販売のための取引。チャートにAverageDirectionalIndexインジケーターを追加し、標準の移動インジケーターを追加します。価格が移動平均を下回った場合、赤い線が緑の線と上
MetaTraderマーケットは、他に類のない自動売買ロボットやテクニカル指標の販売場所です。
MQL5.community ユーザーメモを読んで、取引シグナルのコピー、フリーランサーによるカスタムアプリの開発、支払いシステムを経由した自動支払い、MQL5Cloud Networkなど、当社がトレーダーに対して提供するユニークなサービスについて詳しくご覧ください。
取引の機会を逃しています。
- 無料取引アプリ
- 8千を超えるシグナルをコピー
- 金融ニュースで金融マーケットを探索
新規登録
ログイン