YouTubeにあるマーケットチュートリアルビデオをご覧ください
ロボットや指標を購入する
仮想ホスティングで
EAを実行
EAを実行
ロボットや指標を購入前にテストする
マーケットで収入を得る
販売のためにプロダクトをプレゼンテーションする方法
MetaTrader 4のための有料のテクニカル指標 - 79

You can use the Viking Trend indicator as the main one to determine the trend. The indicator can work both for entry points and as a filter. This is a hybrid trend indicator, as it is based on the signals of elementary indicators and a special algorithm for analysis. The indicator reflects information in a visual form; it can be used both for pipsing on short periods and for long-term trading. The indicator does not redraw and does not lag. Take Profit is bigger than Stop Loss! Works on all curr
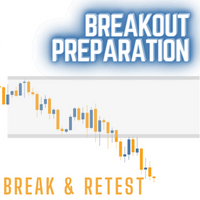
Breakout Preparation Choppy movement up and down on the opening range everyday. Trading breakouts on London session and New York session is recommended. Setting a bounce for a certain time zone and trade when the bounce reveals a break through. Input Parameter Indicator Name Days to Show Start Time to Analysis End Time to Analysis Bounce Show till Time Chart Setting Color Scheme Selection
Happy Trading and thanks for support.

The intelligent algorithm of the Calc Flagman indicator determines the trend well, filters out market noise and generates entry and exit levels. The indicator shows potential market reversal points. Works on all currency pairs and on all timeframes. Ready trading system. Uses only one parameter for settings. Simple, visual and effective trend detection. The indicator does not redraw and does not lag. You can set up message alerts as sound or email.
The principle of this indicator is very simple: detecting the trend with Moving Average, Predicting BUY and SELL signals with arrows, alerts and notifications. The parameters are fixed and automatically calculated on D1 timeframe. You can trade with small timeframe or using Dash DIY Ai Robot, Dash Smart Majors Strategy for autotrading on any timeframe and any currency pairs. You can download template and the presets file for autotrading with Dash Smart Majors Strategy . Example: If you install i

** All Symbols x All Time frames scan just by pressing scanner button ** *** Contact me to send you instruction and add you in "Divergence group" for sharing or seeing experiences with other users. Introduction MACD divergence is a main technique used to determine trend reversing when it’s time to sell or buy because prices are likely to drop or pick in the charts. The MACD Divergence indicator can help you locate the top and bottom of the market. This indicator finds Regular divergence for pul
The principle of this indicator is very simple: detecting the trend with Moving Average, Predicting BUY and SELL signals with arrows, alerts and notifications. The parameters are fixed and automatically calculated on M30 timeframe. You can trade with small timeframe or using Dash DIY Ai Robot, Dash Smart M30 Strategy for autotrading on any timeframe and any currency pairs. You can download template and the presets file for autotrading with Dash Smart M30 Strategy . Example: If you install indica

Top Trader Indicator
This is an arrow reversal indicator. This is with deviations and arrows. Trade a blue arrow for buy and trade a red arrow for sell. Change the time period and the deviations of the bands. This is similar to others but these arrows don't repaint. Load in back tester and study which periods and deviations work the best. It works on all time frames. 15 min to 1 hr would give good results for take profits. Try according to your own risk management.

Result look on https://t.me/BonosuProBinary Pair : All Forex Pairs Time Frame : M1 Expaired : 1-2 Minutes Trade Time Once Time a Day Backtester, Alert Avaliable Average Signals Generate 5 - 20 Signals All Pair A Day Broker Time Zone GMT+3 Default Setting [Example Broker GMT+3 : Alpari, FBS, XM] Support Broker : Deriv, IQOption, Alpari, Binomo, Olymtrade, Qoutex, GCoption, etc Support Auto Trading : MT2 Trading, Binary Bot, Intrade Bot, Binomo Bot, Olymptrad Bot, MX2 trading, Price Pro, etc Ind

Result look on https://t.me/BonosuProBinary Pair : All Forex Pairs Time Frame : M1 Expaired : 1-2 Minutes Trade Time Once Time a Day Backtester, Alert Avaliable Average Signals Generate 5 - 20 Signals All Pair A Day Broker Time Zone GMT+3 Default Setting [Example Broker GMT+3 : Alpari, FBS, XM] Support Broker : Deriv, IQOption, Alpari, Binomo, Olymtrade, Qoutex, GCoption, etc Support Auto Trading : MT2 Trading, Binary Bot, Intrade Bot, Binomo Bot, Olymptrad Bot, MX2 trading, Price Pro, etc Ind

Result look on https://t.me/BonosuProBinary Pair : All Forex Pairs Time Frame : M1 Expaired : 1-2 Minutes Trade Time Once Time a Day Backtester, Alert Avaliable Average Signals Generate 5 - 20 Signals All Pair A Day Broker Time Zone GMT+3 Default Setting [Example Broker GMT+3 : Alpari, FBS, XM] Support Broker : Deriv, IQOption, Alpari, Binomo, Olymtrade, Qoutex, GCoption, etc Support Auto Trading : MT2 Trading, Binary Bot, Intrade Bot, Binomo Bot, Olymptrad Bot, MX2 trading, Price Pro, etc Ind
The principle of this indicator is very simple: detecting the trend with Moving Average, Predicting BUY and SELL signals with arrows, alerts and notifications. The parameters are fixed and automatically calculated on M30 timeframe. You can trade with small timeframe or using Dash DIY Ai Robot, Dash Smart Boxing5 Strategy for autotrading on any timeframe and any currency pairs. You can download template and the presets file for autotrading with Dash Smart Boxing5 Strategy . Example: If you instal
Готов продать исходный код, за подробностями обращайтесь в личные сообщения.
Индикатор чертит горизонтальные линии поддержки и сопротивления,наклонные линии поддержки и сопротивления,треугольники.Работает на любых инструментах и таймфреймах.
Данный индикатор можно использовать в торговле ориентируясь на отбой и пробой уровней, а так же для ориентиров выставления стоп лоссов.
Индикатор не удаляет уровни , они остаются на истории графика , что очень удобно для анализа его работы.
Для удобств

** All Symbols x All Time frames scan just by pressing scanner button ** *** Contact me to send you instruction and add you in "Swing scanner group" for sharing or seeing experiences with other users. Swing EA: https://www.mql5.com/en/market/product/124747 Introduction: Swing Scanner is the indicator designed to detect swings in the direction of the trend and possible reversal swings. The indicator studies several price and time vectors to track the aggregate trend direction and detects situa

It will perfectly complement your working Expert Advisor or manual trading with up-to-date information.
There is a sound notification of exceeding the established profit and loss limits of open SELL and BUY orders.
Moreover, for each currency pair EURUSD, GBPUSD, XAUUSD, and others, various sound alerts are activated in English. Results are displayed on a special panel on the chart from the moment the indicator is activated: Elapsed time Fixed profit
Current profit SELL
Current profit BUY
Maximu
Индикатор Powerful trend indicator превосходно показывает текущую тенденцию. Индикатор Powerful trend indicator не перерисовывает не меняет свои значения. Советую пользоваться тремя периодами индикатора для фильтра сигналов. The Powerful trend indicator perfectly shows the current trend. The Powerful trend indicator does not redraw or change its values. I advise you to use three periods of the indicator to filter signals.

Odyssey is a global trend indicator. If you do not yet have your own trading strategy, you can use our ready-made trading strategy. This is a hybrid trend indicator, as it is based on the signals of several internal algorithms. The indicator also uses the oscillator algorithm in recalculations. The indicator also calculates the oversold and overbought levels of a trading instrument. Thus, having all the necessary information, the indicator generates signals when the trend changes.
Despite the

The intelligent algorithm of the Godfather indicator accurately determines the trend, filters out market noise and generates entry and exit levels. The indicator will help in finding entry points when analyzing the price chart. The program first receives a "snapshot" of the graph, then analyzes it. The results are reported to the trader in the form of signals. The main purpose of this indicator is to determine the moments of entries and exits from transactions, so the indicator displays only th

This strategy is best used for Scalping and Binary Options. Strategy: There are 3 EMAs: Faster, Medium and Slower. When Price is Trending, wait for Price to bounce an EMA and scalp at each bounce. Features: - Check if 3 MAs are Stacked - Check Price Bounce Off MAs (Faster, Medium, Slower) - Min Distance Between Faster and Medium MA Filter - Max Distance Between Entry Price and Faster MA Filter - High Volume Check - Heiken Trend Check - Volatility Check - Higher/Lower Timeframes MA Stacked check

Indicator that shows you at any time the current number of closed deals as well as profit and loss totals of the closed deals of the account that you're logged into for a configurable period.
To do this, it is best to load "Complete history" in the account history in the terminal and then enter the desired period in the indicator (e.g. 2022.01.01-2023.01.01 would be for calendar year 2022).
Input options:
- Period (Attention: corresponding data must be loaded into the account history of the

Индикатор превосходно показывает экстремумы цены. Для торговли по данному индикатору рекомендую торговать по сигналам старших таймфреймов. Индикатор не перерисовывается и не меняет значения в истории. The indicator perfectly shows price extremes. To trade on this indicator, I recommend trading on the signals of the higher timeframes. The indicator does not redraw and does not change the values in the history.

Индикатор уровней поддержки и сопротивления. Не перерисовывается и не меняет свои значения при переключении таймфреймов. С индикатором можно работать как на пробой уровней так и на отбой уровней поддержки и сопротивления Indicator of support and resistance levels. It does not redraw and does not change its values when switching timeframes. With the indicator, you can work both on the breakdown of levels and on the rebound of support and resistance levels

Anand is a forex trend arrow indicator for identifying potential entry points. I like it, first of all, because it has a simple mechanism of work, adaptation to all time periods and trading tactics. It indicates a short-term and long-term trend. operations. The simplest way to use the indicator is to open a trade in the direction of an existing trend. The indicator allows you to study the real and historical market trends in more detail!
Determining the market trend is an important task for tr

Индикатор Супер МА является трендовым индикатором и отлично справляется определением текущей тенденции. Ею можно пользоваться как для скальпинга так и для торговли внутри дня. Сигналы индикатора не перерисовываются и не меняют свои значения после закрытия бара The Super MA indicator is a trend indicator and does an excellent job of determining the current trend. It can be used both for scalping and for intraday trading. The indicator signals do not redraw and do not change their values after

The main application of the Rwanda indicator is to generate buy and sell signals. Displays the Rwanda indicator signals on the price function chart using a mathematical approach. The indicator determines the long-term and short-term trend. The best result is given by the combination of the indicator with fundamental news, it can act as a news filter, that is, it can show how the market reacts to this or that news.
With this indicator, you can predict future values. The indicator is designed to
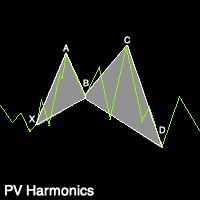
PV Harmonics - Paints harmonic triangles and patterns on live charts to show current live harmonic patterns. - Paints arrows on charts over the harmonic patterns to signal prime entry and exit points. - Extremely fast and versatile indicator. - Highly accurate. - Non repainting. (Does not repaint entry/exit signals) - Comes with numerous customization settings.
Индикатор уровней поддержки и сопротивления отлично показывает на графике все силовые уровни от всех таймфреймов. Рекомендую торговать уровни старших таймфреймов. Индикатор на текущем таймфрейме обновляться как только на графике появится новый сетап The indicator of support and resistance levels perfectly shows all power levels from all timeframes on the chart. I recommend trading higher timeframe levels. The indicator on the current timeframe is updated as soon as a new setup appears on the
Индикатор объёмов отличный помощник в трейдинге. Индикатор не перерисовывается и не меняет значения при переключении таймфреймов. Индикатор объёмов MTF, показывает текущую тенденцию на графиках. Рекомендую торговать в сторону сигналов старших таймфреймов The volume indicator is a great assistant in trading. The indicator does not redraw and does not change values when switching timeframes. MTF volume indicator, shows the current trend on the charts. I recommend trading in the direction of highe

One of the main definitions for monitoring the currency market is a trend, which is why the Citizen indicator was created in order to display the trend in a visual form. You should use the indicator as an additional indicator, that is, you need to use this indicator for example to perfectly display price movements! Its signals are based on a reliable algorithm. When used simultaneously on multiple timeframes, this indicator truly "makes the trend your friend". With it, you can follow trends on m

The main purpose of the Deathly indicator is to evaluate the market. Red dots indicate that the priority should be to open SELL positions. The blue color indicates that it is time for BUY trades. Using the indicator is very convenient and easy. The indicator is universal. It is applied at any time intervals. You can use the indicator to trade different assets. The tool is perfect for Forex trading. It is actively used for trading in commodity, commodity and stock markets.
The indicator impleme

With the help of the Elephant Forex indicator algorithm, you can quickly understand what kind of trend is currently developing in the market. The indicator indicates on the chart the main trend at the current moment in the market. A change in direction, in terms of market fundamentals, means a shift in trading interest towards sellers or buyers.
If you do not take into account speculative throws, which as a result do not affect the overall trend, then the moment of a real “reversal” is always

The advantage of working on the Special Agent signal indicator is that the trader does not need to independently conduct a technical analysis of the chart. Determining the market trend is an important task for traders, and the tool gives ready-made signals in the form of directional arrows. This tool is an arrow (signal).
Special Agent is a trend indicator, a technical analysis tool that helps to determine the exact direction of the trend: either up or down price movement for a trading pair of
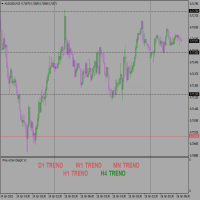
This is a price action traders delight, Too much of Indicators are bad on the chart so also to much of analysis can cause analysis paralysis. No need for Top down analysis, The EA does that for you based on Monthly, Weekly, Daily, And 4hrs trend readings on same window. Supports all time frame trading. Make your trading seem less and takes it to the next level. Its new and first of its kind with 5yrs development process. Just work with the colors ( Green for Bullish Market and Red for Bearish)

The Andhadhun trend step indicator will give you stability if you follow his signals. And you will be able to distinguish between work and the emotional component. It basically uses the process of identifying the rate of change in price growth and allows you to find entry and exit points from the market. Just look at the screenshots and you will determine the principles of working with the indicator yourself.
The indicator analyzes the state of the market, the phase of its movement and largely

A fundamental technical indicator that allows you to assess the current market situation in order to enter the market of the selected currency pair in a trend and with minimal risk.
Many beginners who first enter the market often have better luck than a professional who has spent years learning. The reason for this phenomenon is the unconscious entry of beginners into the trend, when even without any indicators it becomes clear where the market is moving.
The Apartment indicator basically us

The Bridge indicator displays potential entry points on the chart as signals (points of absolute trend reversal).
The Bridge forex indicator algorithm was created on the basis of the original indicators for searching for extremes, the indicator is well suited for determining a reversal or a large sharp jerk to one side, thanks to it you will know when this happens, it will notify you with the appearance of a blue dot to buy red to sell. The indicator, according to a certain algorithm, qualifie
ZigZag предназначается для анализа движений цен с заданной амплитудой. Индикатор изображает только самые важные развороты, что значительно облегчает оценку графиков. Стрелки показывают БАР, на котором последний Low/High полностью сформирован. ZigZag is designed to analyze price movements with a given amplitude. The indicator shows only the most important reversals, which greatly facilitates the evaluation of charts. The arrows show the BAR where the last Low/High is fully formed.
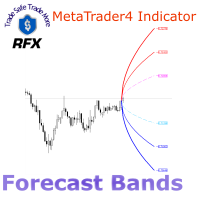
The RFX Forecast Bands indicator calculates the three significant confidence levels, 99%, 95% and 68% of price movement for a configurable number of bars in the future. The essence of calculations is based on statistical analysis of the asset's recent price changes. These levels can be used for many different purposes in trading systems. For example, one can use them for setting the target profit and stop loss levels effectively. The extreme upper and lower bands represent 99% confidence level,

Индикатор Super Ma Arrows состоит из модифицированной средней скользящей и стрелок. Индикатор предназначен для скальпинга. Индикатор Super Ma Arrows не перерисовывает не меняет значения при переключении таймфреймов The Super Ma Arrows indicator consists of a modified moving average and arrows. The indicator is designed for scalping. The Super Ma Arrows indicator does not redraw does not change values when switching timeframes
This indicator helps to trade in the right direction of the market, by knowing the bias of the market. If you are a swing trader this is the best indicator for you. You will just see the bias on the top right of your chart/screen. You can sometime wait for reversals then continue with the trend/bias. Indicator is based on moving averages and showing daily bias of the market. KEEP IN MIND THAT THE BIAS IS STRICTLY SHOWING THE DAILY TIMEFRAME TREND ONLY.
You can check the video attached.

Hello traders nice scalping tool
this indicator design for find best point to enter market in all time frame
indicator no repaint , no redraw , no lagging very accurate indicator just test it in strategy tester and see yourself !
you can use it for any pairs and indices CFD base of this indicator is cci so you can change period of it in input taps of indicator but default is optimized before ! good luck
Níveis de suporte ou resistência formados quando a ação do preço de um mercado reverte e muda de direção, deixando para trás um pico ou vale (ponto de oscilação) no mercado. Os níveis de suporte e resistência podem criar faixas de negociação. O indicador identifica High e Low com base no Período.
Características principais Um conceito chave da análise técnica é que quando um nível de resistência ou suporte é quebrado, seu papel é invertido. Se o preço cair abaixo de um nível de suporte, esse n

This indicator simplifies your entry zones by displaying the areas where you can plan your entry that potentially could give you high risk/reward ratios. Other than picking the most optimal entry points, the Hot Zone indicator can act as your typical support/resistance indicator for pullbacks for all timeframes. You can use this indicator as the only trading indicator or use it with another indicator for reentry purposes. Besides, when using Hot Zones, the risk/reward ratio should be well abov
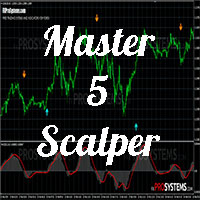
こんにちはトレーダー、特にスカルパー 今回は5分の時間枠でスカルパー用の特別なインジケーターを紹介します
このインジケーターは、わかりやすいスカルパーインジケーターを探すことに戸惑う初心者の方に役立つと期待されています。
はい先に行って
このインジケーターは5分の時間枠でのみ実行されます このインジケーターは、トレーディングプラットフォームでMQIDを入力することにより、モバイル経由でトレーダーに通知を提供することもできます
このインジケーターは、修正されたストキャスティクス法を使用します
今日のアップデートでは、インジケーターは移動平均インジケーターの傾向に基づいて通知を提供できます より正確な結果を得るには 5分の時間枠、ピボットポイントインジケーター(フィボナッチ)、およびボリンジャーバンド(期間120)を使用します
したがって、このインジケーターが通知を提供する場合、価格が売買する価値があるかどうかを判断します
100%の利益を保証するものではありません
ヒントとコツ
-移動平均トレンドが上昇したら、購入通知を待ちます
-移動平均トレンドが下がったら、売り
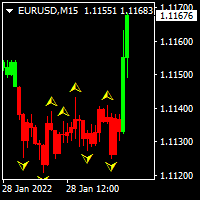
This indicator helps you to build position and profit when market turns in your favor. You will build your full position by trading many small position. If there is green colored candle on the chart, you could add long position. If there is red colored candle on the chart, you could add short position. I personally spread my full size position in to 5-10 small position. I use small target of 2-5 pips on eurusd pair.

MT5 Version MA Ribbon MT4 MA Ribbon is an enhanced indicator with 8 moving averages of increasing periods. MA Ribbon is useful to recognize trend direction, reversals and continuation points in the market as well as potential entry, partial take profit and exit points. Entry points for long and shorts position can be found when the price entries or leaves the Ribbon, at retest or a defined number of MA crossovers. It offers a good combination with mostly any volume or momentun indicators to f
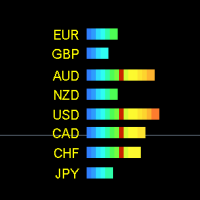
"Forex strength meter full" is a new improved version of the popular indicator. In this version, we have changed the input filters and made the indicator signals faster and more accurate. Now this indicator can be used in trading even more effectively than its basic free version. The new version of the indicator is built on self-learning algorithms and is able to self-analyze its signals in order to exclude false information data flows.
Why should you use this indicator? It shows the direction
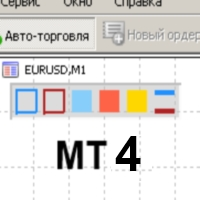
Color Levels - удобный инструмент для тех, кто использует технический анализ с использованием таких инструментов, как Трендовая линия и Прямоугольник. Имеется возможность настройки двух пустых прямоугольников, трех закрашенных и двух трендовых линий. Настройки индикатора крайне просты и делятся на пронумерованные блоки: С цифрами 1 и 2 вначале - настройки пустых прямоугольников (рамок); С цифрами 3, 4 и 5 - настройки закрашенных прямоугольников; С цифрами 6 и 7 - настройки трендовых линий. Объе

Этот индикатор имеет универсальный алгоритм торговли, который основан на импульсе цены . Все максимально упрощено - только сигналы на Buy и Sell . Есть оповещения, чтобы не пропустить открытие позиции.
Не требует оптимизации и дополнительных настроек!
Для любых типов инструментов: валюты, нефть, металлы, криптовалюты. Для любых таймфреймов: от M1 до D1 . Для любых стилей торговли: скальпинг, интрадэй, свинг, долгосрок . Если Вам необходима дополнительная информация или есть вопросы по
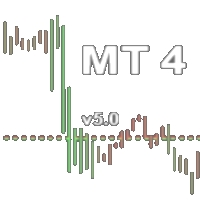
Индикатор закрашивает бары по цвету, выбор цвета ведется из расчета торгового объема валютного инструмента. вертикальную линию есть возможность перемещать для изучения на исторических данных горизонтальные линии отвечают за максимальный и минимальный бар зеленый большой объем красный маленький объем настройки: выбор ширины окраски бара выбор количество баров для расчета
Есть возможность доработать индивидуально: вывод звуковых сигналов вывод сообщения в телеграмм комбинировать с другим индикат

The Qv² Halifax - Indicator developed through a complex series of calculations, which aims to easily identify buylng and selling signals.
Buy signal are indicated by up arrows.
Sell signal are indicated by down arrows.
An important detail: In order to make the indicator work, the timeframes M1, M5. M15. M30, H1 D1 must be all updated.
It can be used on all pairs (I use it on Gold).
it is a very good deal in the trending market
To learn more about my work click here

The indicator (Current Strength) is represented in a separate window by Blue and Pink histogram . The parameter NPeriod represents the number of bars on which we calculate the variation of forces, the recommended value is 5. The Blue histogram measures the buyers force , while the Pink histogram measures the sellers force . The change in color signifies the change in strength which leads t he price . Each drop (especially below 52.8) after touching levels 96.3 or 1.236 must be condidered
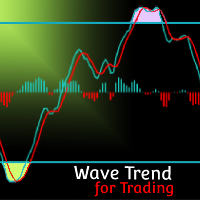
MT5 Version Wave Trend MT4 Wave Trend is an oscillator, which helps identifing in a extremely accurate manner market reversals. The Oscillator being obove the overbought level and a cross down of the fast into the slow MA usually indicates a good SELL signal. If the oscillators is below the oversold level and the fast MA crosses over the slower MA usually highlights a good BUY signal. The Wave Trend indicator can be also used when divergences appear against the price, indicating the current mo
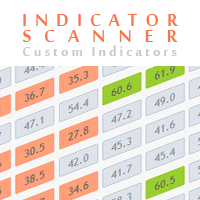
Advanced Indicator Scanner is a multi-symbol multi-timeframe scanner that works with hundreds of custom indicators available across the web including mql5 website market and codebase indicators.
Advanced Indicator Scanner features:
Scans your indicator in 28 customizable instruments and 9 timeframes. Monitors up to 2 lines(buffers) of an indicator. Showing of indicator value on buttons. You can choose between 3 alert modes: Single symbol and timeframe Multiple timeframes of a symbol Multiple

Contact me after payment to send you the User-Manual PDF File. ADVANCE PRICE ACTION TRADING CONCEPT. To test the indicator, you can download the demo version on my product list. it’s free (only shows patterns that have occurred in the past of the market). Quasimodo is a reversal trading pattern that appears at the end of an uptrend. As a price formation, the Quasimodo pattern is depicted by three peaks and two valleys, where: First, the middle peak is the highest, while the outside two peaks

RSI Trend Line is a simple indicator that draws trend lines.
Parameters:
Level Step - the step between the highs and lows.
Period_RSI - standard parameter of the RSI indicator.
Upper Line Color - sets the color of the trend lines for UP.
LowerLine Color - sets the color of the trend lines for Down.
Alerts - the parameter is responsible for On/Off notifications when trend lines intersect with RSI. By default, it is On.
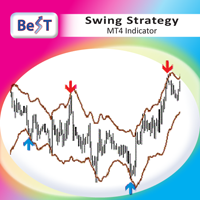
BeST Swing Strategy is a Metatrader indicator based on the corresponding Jim Berg's work about volatility as described in his article "The Truth About Volatility" (TASC 2/2005).The indicator consists of 2 channel lines deriving as (MA +/- times the ATR) and can be used as a standalone trading system.The outlier prices of the Market as of the indicator's values can be used for producing Entry and Exit Signals.
Advantages of the indicator == Uses 2 Swing Strategies (Normal and Reverse)
== Never

Индикатор " Nostradamus ind" мощный инструмент для торговли на рынке форекс. " Nostradamus ind" не перерисовывается и не меняет свои значения при переключении временных периодов. The "Nostradamus ind" indicator is a powerful tool for trading on the forex market. "Nostradamus ind" does not redraw and does not change its values when switching time periods.

Индикатор "Trend direction ind" является трендовым индикатором. Индикатор "Trend direction ind"не запаздывает, выдает сигналы на нулевом баре и не перерисовывает при переключении таимфреймов. С индикатором "Trend direction ind" вы будете с легкостью определять текущую тенденцию. The "Trend direction ind" indicator is a trend indicator. The "Trend direction ind" indicator does not lag, gives signals at the zero bar and does not redraw when switching time frames. With the "Trend direction ind
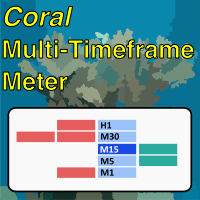
Coral Multi TF Meter allows you to quickly see how price is moving on a single currency pair across multiple timeframes at once. You can select which timeframes to display; the size, position, colors of cells; whether to display values or not; and how often the meter is updated. The calculation is based on ATR distance for each displayed timeframe. Hover over the header cell for the row (with the currency name in it) to see the current ATR value (in pips) for that period. When "Display Values
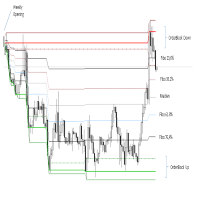
The indicator is activated at the beginning of each week and detects both bullish and bearish ORDERBLOCK potentials. These levels are of high operational probability, being able to use a minimum ratio of 3 to 1 to maximize profits. It is recommended to use pending orders at the OB levels of the chart and place the SL up to a maximum of 20 pips from the entry price.
Submit the indicator to Backtesting to become familiar with its performance and complement it with other trend or oscillation type

The indicator is triggered at the start of each trading day and detects both bullish and bearish ORDERBLOCK potentials. These levels are of high operational probability, being able to use a minimum ratio of 3 to 1 to maximize profits. It is recommended to use TimeFrame M5 to M30 for a proper display and consider pending orders at the OB levels of the chart and place the SL up to a maximum of 20 pips from the entry price.
Submit the indicator to Backtesting to become familiar with its performan

A machine translation from the English product description was used. We apologize for possible imprecisions. 英語の製品説明からの機械翻訳が使用されました。 不正確な可能性があることをお詫び申し上げます。 お気に入りのろうそく足の価格アクションパターンの視覚化システム。 アタッチされると、インジケーターはチャート上の次のパターンを自動的にマークします。 ピノキオバー - 長い「鼻」を持つ小さなボディのバー、非常によく知られている逆のパターン。 内側のバー - 範囲が前のバーの範囲内にあるバー。 それは市場の不確実性を表しています。 外側のバー - 範囲が前のバーの範囲を超えるバー。 それは市場の不確実性を表しています。 レールパターン - ほぼ等しく、より大きなボディを持つ 2 つの結果として生じる反対側のバー。 逆のパターン。これは、より高い時間枠のピノキオバーパターンと実際に一致します。 マスターキャンドル パターン - キャンドルの 5 つ、後続の 4 つのキャンドルの範囲
Индикатор "BO indicator at zero bar" для торговли бинарных опционов. Индикатор выдаёт свои сигналы на нулевом баре не перерисовывает и не меняет свои показатели при переключении временных периодов. Рекомендую использовать индикатор совместно с другим индикатором как фильтр "BO indicator at zero bar" indicator for binary options trading. The indicator gives its signals on the zero bar, does not redraw and does not change its indicators when switching time periods. I recommend using the indicato

[ MT5 Version ] How to trade using Order Blocks: Click here Discover the future of trading with Order Block Indicator , meticulously crafted for traders who demand unparalleled accuracy and customization. Whether you're scalping or swing trading, this tool is your gateway to mastering Order Blocks and Supply and Demand Zones—critical areas where price reversals often occur. Why Choose Order Block Indicator? Transform Your Trading Strategy: Precision Analysis: Pinpoint potential accumulation
Индикатор "Reversal zone" показывает силовые уровни и возможные точки разворота на текущем графике. Индикатор "Reversal zone" поможет трейдеру разобраться с текущей ситуацией The "Reverse zone" indicator shows power levels and possible reversal points on the current chart. The "Reverse zone" indicator will help the trader to deal with the current situation

Индикатор "Zigzag levels" основан на индикаторе зигзаг. Индикатор показывает зоны уровней поддержки и сопротивления относительно индикатору зигзаг. Индикатор "Zigzag levels" сделает хорошую службу в вашем трейдинге. Всем больших профитов!!! The Zigzag levels indicator is based on the zigzag indicator. The indicator shows the zones of support and resistance levels relative to the zigzag indicator. The Zigzag levels indicator will do a good service in your trading. Big profits for everyone!!!

The Omega Point indicator uses a complex multilayered system that is used by the top world traders which helps to determine the beginning of trends that are highly likely to last for a long time. The system uses several complex trend calculation modes, due to which the indicator adapts to the specifications of different currency pairs, and is suitable for both conservative and aggressive trading. The indicator makes the necessary calculations and shows important information about how the trade
指標は、ボラティリティに基づいて自動的にチャート上の大きな影を検索して表示します。 影はさらに波のサイズによってフィルタリングされます。 このアルゴリズムは、指定された範囲の影によるフラクタル内訳を分析し、レベルを表示します。 設定では、複数通貨ダッシュボードを有効にすることができます。 アラートは、現在のスケジュールまたはダッシュボードシート全体の間で選択されます。 大きな影の信号とフラクタルレベルを突破した信号は、別々にオンにすることができます。 Blog-Link - Retest and Fake Breakout with UPD1 。
取引パターン: +トレンド別再テスト 。 +偽の内訳 。 +その他 。
EURUSD, GBPUSD, XAUUSD, ... M15, M30, H1 。
入力パラメータ 。
メイン 。 Bars Count – 表示するバーの数 。 ATR Period - ボラティリティを計算するローソク足の数 。 ATR Coeff Shadow (0 - Off) – シャドウサイズ係数(平均ボラティリティに対する) 。 ATR Co

移動平均線クロス、ボリンジャーと移動平均線のクロス、移動平均線の角度でサイン表示
MT5インジケータ こちらに サイト とがあります。 このインジケータは3つのパターンでサインを表示(切り替え可能)します。 ① 移動平均線のクロス ② ボリンジャーバンドと短期移動平均線とのクロス ③ ボリンジャーバンドと短期移動平均線とのクロスと、中期移動平均線と長期移動平均線の角度 移動平均線のクロス 指定した短期移動平均線と長期移動平均線のゴールデンクロスでは買いサイン、デットクロスでは売りサインを表示します。 ディフォルトでは短期は5,長期は20となっています。 もちろん変更可能になります。 移動平均線の種類をEMA(指数平滑移動平均線)やSMMA(平滑化移動平均)などに変更可能で適する価格も変更可能になります。 ボリンジャーバンドと短期移動平均線のクロス ボリンジャーバンド(以降BB)と短期移動平均線のクロスでサインを表示します。 ディフォルトではBB+1σと5MAのゴールデンクロスで買いサイン、BB-1σと5MAのデットクロスで売りサインでサインを表示します。 BBの期間や、B
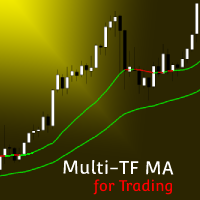
MT5 Version Multi Timeframe MA MT4 Multi Timeframe MA MT4 is an indicator that offers the representation of up to 3 MAs with different Periods and Timeframes. This allows the user to reprensent in one chart and timeframe information coming from other timeframes and get notified as any of the MAs crosses another one. Multi Timeframe MA is the first indicator in the market that offers Multi Timeframe interactions and a high customization level from up to 7 different MA types (SMA, EMA, WMA,
MetaTraderマーケットは、他に類のない自動売買ロボットやテクニカル指標の販売場所です。
MQL5.community ユーザーメモを読んで、取引シグナルのコピー、フリーランサーによるカスタムアプリの開発、支払いシステムを経由した自動支払い、MQL5Cloud Networkなど、当社がトレーダーに対して提供するユニークなサービスについて詳しくご覧ください。
取引の機会を逃しています。
- 無料取引アプリ
- 8千を超えるシグナルをコピー
- 金融ニュースで金融マーケットを探索
新規登録
ログイン