Regardez les tutoriels vidéo de Market sur YouTube
Comment acheter un robot de trading ou un indicateur
Exécutez votre EA sur
hébergement virtuel
hébergement virtuel
Test un indicateur/robot de trading avant d'acheter
Vous voulez gagner de l'argent sur Market ?
Comment présenter un produit pour qu'il se vende bien
Indicateurs techniques pour MetaTrader 4 - 5

La stratégie de trading Moving Average Convergence Divergence (MACD) est un outil d'analyse technique populaire utilisé pour identifier les changements de momentum et de direction de tendance. Le MACD est calculé en soustrayant la moyenne mobile exponentielle (EMA) sur 26 périodes de la EMA sur 12 périodes. Une EMA sur 9 périodes, appelée "ligne de signal", est ensuite tracée sur le MACD pour agir comme déclencheur des signaux d'achat et de vente. Le MACD est considéré comme étant en territoire
FREE
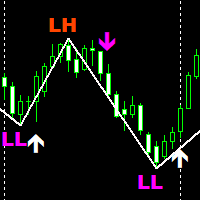
SMC Traders is a non-repaint indicator that is based on Price Action The indicator uses current market structure to predict future reversals. The indicator can be used with our free Market structure zig zag which can be found here: https://www.mql5.com/en/market/product/91579 Please note to find the HH AND HL CLINK ON LINK ABOVE Timeframes: 15 minutes for scalping 1 Hour for swing trading Purple Arrow look for sells in conjunction with LL White Arrow look for buys in conjunction with HL
FREE

Tout d'abord, il convient de souligner que cet indicateur de trading n'est ni repainting, ni redrawing et ne présente aucun délai, ce qui le rend idéal à la fois pour le trading manuel et automatisé. Manuel de l'utilisateur : réglages, entrées et stratégie. L'Analyste Atomique est un indicateur d'action sur les prix PA qui utilise la force et le momentum du prix pour trouver un meilleur avantage sur le marché. Équipé de filtres avancés qui aident à éliminer les bruits et les faux signaux, et à

Dark Breakout is an Indicator for intraday trading. This Indicator is based on Trend Following strategy, providing an entry signal on the breakout. The signal is provided by the arrow, which confirms the breaking of the level. We can enter in good price with this Indicator, in order to follow the main trend on the current instrument. It is advised to use low spread ECN brokers. This Indicator does Not repaint and N ot lag . Recommended timeframes are M5, M15 and H1. Recommended working pairs

Enjoy a 50% OFF Christmas holiday sale!
This indicator is unstoppable when combined with our other indicator called Support & Resistance . After purchase, send us a message and you will get it for FREE as a BONUS! Introducing Trend Punch , the revolutionary forex trend indicator that will transform the way you trade! Trend Punch is uniquely designed to provide precise buy and sell arrows during strong market trends, making your trading decisions clearer and more confident. Whether you

KT Price Border crée un canal de prix à trois bandes qui identifie les zones potentielles de sommets et de creux du marché. Ces niveaux peuvent également être utilisés comme des supports et résistances dynamiques. La bande médiane peut également être utilisée pour identifier la direction de la tendance, ce qui en fait un indicateur de suivi de tendance. De plus, sa simplicité d’utilisation et la clarté de ses signaux de trading sont particulièrement bénéfiques pour les traders débutants.
Carac

L'indicateur affiche la bougie motif Pin Bar. Les paramètres de rapport permettent d'ajuster facilement le rapport entre ombre, corps et taille. Il est possible de filtrer par tendance (2 moyennes mobiles) et par inversion (RSI et bandes de Bollinger). C'est le modèle le plus populaire de Price action. En présence d'un tableau de bord multi-devises. Avec elle, vous pouvez facilement basculer entre les graphiques.
Modèles commerciaux: Retest sur la tendance. Fausse panne. Autrui.
EURUSD, GBPUS

Daily Candle Predictor est un indicateur qui prédit le cours de clôture d'une bougie. L'indicateur est principalement destiné à être utilisé sur les graphiques D1. Cet indicateur convient à la fois au trading forex traditionnel et au trading d'options binaires. L'indicateur peut être utilisé comme un système de trading autonome, ou il peut servir de complément à votre système de trading existant. Cet indicateur analyse la bougie actuelle, calcule certains facteurs de force à l'intérieur du corps
Buy Sell Signal Low TF gives buy/sell signals and alerts with up and down arrow at potential reversal of a pullback or a trend continuation pattern in low timeframe. This is an indicator which gives signals based on trend => It works best in trend market with the principle is to ride on the trend not trade against the trend.
The components of Buy Sell Signal Low TF: - The trend is determined by SMMA 13 , SMMA 21 and SMMA 35 ( can be changed manually to suit your preference). - The signal is b
FREE

No Repaint Bext est un système de trading complet. Il indique quand ouvrir et fermer une position ainsi que la direction de la transaction. Chaque fois qu'une flèche verte apparaît, vous devez ouvrir une position d'achat . Toutes les positions d'achat sont fermées lorsqu'une flèche rouge apparaît.
De même, chaque fois qu'une flèche rouge apparaît, une position de vente est ouverte et sera fermée lorsque la flèche verte apparaît.
Le trading se fait sur l' unité de temps M5 et peut être utilisé s

Contact me to send you instruction and add you in group.
QM (Quasimodo) Pattern is based on Read The Market(RTM) concepts. The purpose of this model is to face the big players of the market (financial institutions and banks), As you know in financial markets, big traders try to fool small traders, but RTM prevent traders from getting trapped. This style is formed in terms of price candles and presented according to market supply and demand areas and no price oscillator is used in it. RTM conc

BUY INDICATOR AND GET EA FOR FREE AS A BONUS + SOME OTHER GIFTS! ITALO VOLUME INDICATOR is the best volume indicator ever created, and why is that? The Indicator works on all time-frames and assets, indicator built after 7 years of experience on forex and many other markets. You know many volume indicators around the internet are not complete, does not help, and it's difficult to trade, but the Italo Volume Indicator is different , the Italo Volume Indicator shows the wave volume, when market

Aperçu du produit gratuit mais avancé Turbo Trend est un indicateur puissant conçu pour aider les traders à identifier et à agir sur les tendances du marché. Il utilise une combinaison de moyennes mobiles avancées et d'analyse de volume pour fournir des signaux clairs sur la direction des tendances. Turbo Trend simplifie la prise de décision en catégorisant les conditions du marché en trois états distincts : Tendance haussière , Tendance baissière et Tendance neutre, en utilisant des lignes et
FREE

Auto Fibo est un indicateur développé pour améliorer votre trading manuel. Il dessine automatiquement le golden ratio, ce qui vous fait gagner du temps et facilite votre trading. Fixez l'indicateur sur le graphique et il dessinera automatiquement le nombre d'or exact, vous évitant ainsi d'avoir à trouver le point critique. L'interface s'ajuste en fonction de votre ordinateur aux points hauts et bas approximatifs de la bande. Cet indicateur corrigera la plupart des erreurs de sélection des point
FREE

I just sell my products in Elif Kaya Profile , any other websites are stolen old versions, So no any new updates or support.
- Lifetime update free
- Real price is 80$ - 40% Discount ( It is 49$ now ) Contact me for instruction, any questions! Related Product: Gold Expert , Professor EA - Non-repaint
Introduction Flag patterns are an important tool for technical traders in the stock market. When interpreting a flag pattern, it is important to wait for the pattern to pick a direction b

Point Trend Indicator - Un indicateur du niveau supérieur et inférieur de la tendance, qui peut déterminer la direction de la tendance et indiquer son renforcement. La direction de la tendance est déterminée par des points ronds ; si les points sont au-dessus de la ligne zéro, la tendance est haussière ; s'ils sont en dessous, la tendance est baissière. L'augmentation du mouvement directionnel est indiquée par des flèches. Il possède le seul paramètre de réglage manuel - la durée de la direction
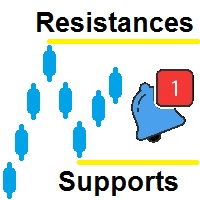
Supports et résistances, a été créé pour vous aider à identifier automatiquement les hauts et les bas sur plusieurs périodes différentes et ainsi tracer ces hauts et ces bas sur le graphique actuel. Passons à l'explication de la création des résistances Il y a un champ de règle, que vous pouvez définir ce qu'est un haut et un bas, la règle du haut est définie par défaut comme ceci : H[ 0 ]<=H[ 1 ] and H[ 1 ]=>H[ 2 ]
Où:
Élément Description H signifie haut
[0] signifie bougie actuelle [1
FREE

Ou ( BD% ) qui est un indice de volatilité qui mesure la volatilité en pourcentage plutôt qu'en points. L'idée de BD% est de créer un indice en fonction de l'écart type classique (CSD) qui évolue entre 0 et 100 pour cent.
Vous pouvez utiliser BD% pour comparer la volatilité d'un même titre sur différentes périodes ou sur différentes périodes. De plus, vous pouvez utiliser BD% pour comparer la volatilité entre différents titres sur différents marchés en termes de pourcentage plutôt que de points
Binary Power Pinbar 2 pour MT4 Binary Power Pinbar 2 est un indicateur pour options binaires, compatible avec toutes les paires de devises et adapté à tous les intervalles de temps. Principe de fonctionnement L'indicateur détecte le modèle "Pin Bar" sur le graphique. Une fois détecté : Signal d'achat : Si le prix dépasse le sommet de la Pin Bar, un signal d'achat est généré. Signal de vente : Si le prix franchit le bas de la Pin Bar, un signal de vente est généré. Caractéristiques principales Ex

Multicurrency and multitimeframe indicator of the Standard Deviation Channel. Displays the current direction of the market. On the panel, you can see breakouts and touches (by price) of the levels of the linear regression channel. In the parameters, you can specify any desired currencies and timeframes. Also, the indicator can send notifications when levels are touched. By clicking on a cell, this symbol and period will be opened. This is MTF Scanner. The key to hide the dashboard from the char

Introducing our exciting new Price Retest indicator! Get instant alerts when the price retests, giving you a powerful edge in your trading strategy. Remember to do your own analysis before making any moves in the market. MT5 Version - https://www.mql5.com/en/market/product/118159/ Here’s a detailed explanation of how the Price Retest indicator works, its components, and how you can incorporate it into your trading strategy: The Price Retest indicator is designed to notify traders when the pric
FREE
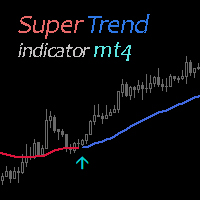
Super Trend Indicator uses two moving averages for calculating the trend direction. Combination with other market signals and analysis is necessary and provides more stable results. Indicator can be easily customized by the user including change of colors, with and arrow sizes.
FREE Super Trend Expert Advisor > https://www.mql5.com/en/market/product/81160?source=Site +Profile+Seller
FREE
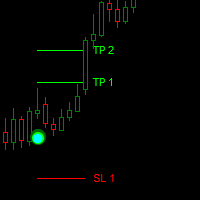
Dark Point is an Indicator for intraday trading. This Indicator is based on Trend Following strategy, also adopting the use of the atr to determine the right volatility. We can enter in good price with this Indicator, in order to follow the strong trend on the current instrument. If you love Dark Point, consider adding some power: Dark Power
Key benefits
Easily visible take profit/stop loss lines Intuitive directional points/arrows by colors Useful statistics , which indicate the win ra
FREE
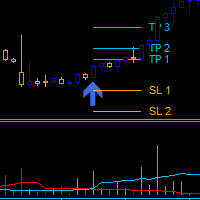
Dark Power is an Indicator for intraday trading. This Indicator is based on Trend Following strategy, also adopting the use of an histogram to determine the right power . We can enter in good price with this Indicator, in order to follow the strong trend on the current instrument. The histogram is calculated based on the size of the bars and two moving averages calculated on the histogram determine the direction of the signal
Key benefits
Easily visible take profit/stop loss lines Intui
Scalp SWING indicator.
It works on any time frame and Instruments
It works on trending and ranging markets.
The signals are robust and does not repaint.
The system is robust and requires no supporting indicator.
You don’t need any multiple indicators to trade the markets.
The alerts/ notifications can be enabled to gain prompt entries.
The entries are at Top and Bottom of Trend Cycles
It is Very accurate and robust system- yet extremely simplified tools for the pro traders.
Scalp SWING
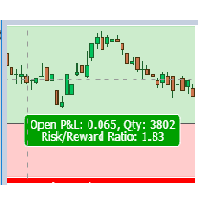
Risk Reward Panel This is a useful tool to plan a trade risk to reward visually. The indicator is very simple to use with minimum settings. Long or Short You can use the indicator for both long and short positions.
Lot Size Calculator You can also use this indicator as a lot size calculator. If you set the risk amount the indicator will calculate the lot size for you based on the stop loss line. You do not need to calculate the lot size manually.

Matrix Arrow Indicator MT4 est une tendance unique 10 en 1 suivant un indicateur multi-période 100% non repeint qui peut être utilisé sur tous les symboles/instruments: forex, matières premières, crypto-monnaies, indices, actions. Matrix Arrow Indicator MT4 déterminera la tendance actuelle à ses débuts, en rassemblant des informations et des données à partir d'un maximum de 10 indicateurs standard, qui sont: Indice de mouvement directionnel moyen (ADX) Indice de canal de matières premières (CC

Upper and Lower Reversal - Système de prévision précoce des moments d'inversion. Vous permet de trouver les points d’inflexion des prix aux limites des canaux de mouvement des prix supérieur et inférieur.
L'indicateur ne recolorera jamais ni ne changera la position des flèches de signal. Les flèches rouges sont un signal d'achat, les flèches bleues sont un signal de vente.
S'adapte à tous les délais et instruments de trading L'indicateur ne se redessine pas, il ne fonctionne que lorsque la bou

Special offer : ALL TOOLS , just $35 each! New tools will be $30 for the first week or the first 3 purchases ! Trading Tools Channel on MQL5 : Join my MQL5 channel to update the latest news from me SMC est une approche de trading qui aide les traders à identifier les zones de liquidité, les positions des ordres institutionnels et les points de retournement clés du marché. En utilisant les principes du SMC, les traders peuvent naviguer plus efficacement sur le marché, trouvant les m
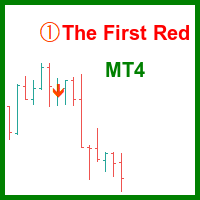
L'indicateur "The First Red", basé sur la stratégie créée par Dariusz Dargo, est conçu pour identifier et marquer les chandeliers sur le graphique qui répondent aux conditions de la stratégie "The First Red" et de ses extensions, telles que "Second Red", "First Green" et "Second Green". La stratégie se concentre sur l'analyse des extrêmes locaux et les signaux de l'oscillateur MACD. Premier chandelier rouge (First Red Candle): Un chandelier est marqué comme "First Red" lorsqu'il établit un max

This indicators automatically draws the Trend Channels for you once you've dropped it on a chart. It reduces the hustle of drawing and redrawing these levels every time you analysis prices on a chart. With it, all you have to do is dropped it on a chart, adjust the settings to your liking and let the indicator do the rest. Get an alternative version of this indicator here: https://youtu.be/lt7Wn_bfjPE For more free stuff visit: https://abctrading.xyz
Parameters 1) Which trend do you want t
FREE

Le prix actuel du produit est de 49$ pour une durée limitée. Le prochain prix de Market Structure sera de 99$. Découvrez Market Structure Break Out pour MT4 – Votre indicateur professionnel MSB et Zone Non Brisée. La version MT5 de ce produit est disponible ici : https ://www .mql5 .com /en /market /product /124690 Cet indicateur est continuellement mis à jour.
Nous nous efforçons de fournir des points d'entrée et de sortie hautement précis basés sur la structure du marché. Nous en sommes maint

ACHETEZ VENDEZ Indicateur de cassure + Confluence Qu'est-ce que la stratégie de cassure ? En termes de trading, une cassure signifie que le prix d'un actif financier, comme une action, se déplace en dehors de sa fourchette de négociation déterminée, qui est souvent indiquée par ses niveaux de support et de résistance. L'idée derrière le trading de cassures est que lorsque le prix sort enfin de la fourchette de négociation précédente, le mouvement de prix devrait continuer dans la même direction
COMPLETE VISUAL TRADING SYSTEM WITH THE BUY SELL SIGNALS - USING MULTI TIME FRAME TREND ANALYSIS
TREND STRENGTH POWER SIGNALS DASHBOARD.
TRADE INTRADAY, SHORT OR MEDIUM OR LONG TIME FRAME .
ALL THE SIGNALS WITH A MULTIPLE TIME FRAME TREND CONFLUENCE - INDICATES A STRONG MOVE AND CAN BE EASILY TRADED AS HIGH PROBABILITY TRADES.
COMPLE TRADING SYSTEM - WITH THE LOGICAL ENTRY , TARGETS AND STOP LOSS .
THE ALERTS ON THE DISPLAY SIDE OF THE ALERTS PANEL AREA , WILL INDICATE CLEARLY ALL THE ENTR

Révélez les Astuces de Trading avec les VWAPs Ancrés Automatiques : Les VWAPs Ancrés Automatiques sont vos compagnons de trading. Ces indicateurs repèrent les points de retournement clés du marché et les illustrent sur votre graphique à l'aide des lignes VWAP. Ceci est une révolution pour les traders qui utilisent des stratégies basées sur les VWAP ancrés. Comment Ça Marche ? Identification des Points Hauts : Si le prix le plus élevé de la bougie actuelle est inférieur au prix le plus élevé de l
The Controversial 5-Step System That Professional Traders Use To Unlock Trading Success!
Reversal Pro effectively combines price action, ideal location and reliable statistics in one smart algorithm. Understanding the market in this unique perspective allows you to recognize reversals professionally.
Discover The Secret Of Professional Traders
Get instant access www.mql5.com/en/blogs/post/716077 Copy & Paste what professional traders are doing right now!
How To Trade Step 1: Trade Setup Sta
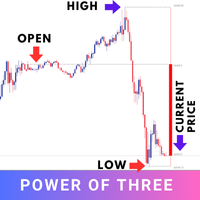
The "Power of Three" (PO3) is a concept developed by the Inner Circle Trader (ICT) to illustrate a three-stage approach used by smart money in the markets: Accumulation, Manipulation, and Distribution . ICT traders view this as a foundational pattern that can explain the formation of any candle on a price chart. In simple terms, this concept is effective for any time frame, as long as there's a defined start, highest point, lowest point, and end. MT5 - https://www.mql5.com/en/market/product/124
FREE
Welcome to the world of SMC (Smart Money Concepts) Trading, where we empower traders with the tools and knowledge to make smarter trading decisions. Our latest addition to our suite of trading tools is the SMC Trading Pro indicator, version 1.0. Key Features: Major Market Structure Identification with BODY break. Order Block must be in Major Swing ( not Small Swing ). Order Block with Fair Value Gap Detection. Order Block in Discount | Premium zone. Filter for only Bullish, Bearish or All Order
FREE

A trend indicator based on the Hull Moving Average (HMA) with two periods. The Hull Moving Average is an improved variant of the moving average, which shows the moment of trend reversal quite accurately. It is often used as a signal filter. Combination of two types of Hull Moving Averages makes a better use of these advantages: HMA with a slow period identifies the trend, while HMA with a fast period determines the short-term movements and signals in the trend direction.
Features The movement d
FREE
Данный индикатор отмечает участки разворота тренда, в точках разворота давая сигнал на вход в рынок в виде стрелок соответствующего цвета и направления движения в виде линий, а также звукового оповещения. Основан на закономерностях рынка FOREX, точных определениях текущего экстремума и нахождения свечных моделей на вершинах/низах рынка. Универсальный алгоритм помогает определить точки разворота указывая стрелками где осуществить вход в рынок. Дополнительно Индикатор не перерисовывается. Выводит

Ultimate Trend Finder (Multi Pair And Multi Time Frame) : ---LIMITED TIME OFFER: NEXT 25 CLIENTS ONLY ---46% OFF REGULAR PRICE AND 2 FREE BONUSES ---SEE BELOW FOR FULL DETAILS Institutional traders use moving averages more than any other indicator. As moving averages offer a quick
and clear indication of the institutional order flow. And serve as a critical component in the decision making
within numerous institutional trading rooms.
Viewing the market through the same lens as the inst
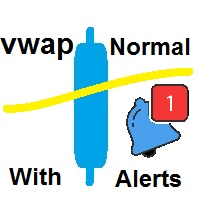
Cette VWAP est une VWAP simple, mais nous avons intégré des notifications qui vous informent lorsque le prix atteint ou traverse la ligne de la VWAP. Cet indicateur est un indicateur VWAP traditionnel pour MetaTrader 4 (MT4). Les paramètres par défaut sont ceux de la VWAP normale, mais vous avez la possibilité de modifier le calcul de la VWAP et, mieux encore : Lorsque le prix touche ou traverse la VWAP, vous en serez informé par des alertes, des notifications sur votre téléphone portable, des e
FREE

L'indicateur de base de l'offre et de la demande est un outil puissant conçu pour améliorer votre analyse du marché et vous aider à identifier les zones clés d'opportunité sur n'importe quel graphique. Avec une interface intuitive et facile à utiliser, cet indicateur Metatrader gratuit vous donne une vision claire des zones d'offre et de demande, vous permettant de prendre des décisions de trading plus informées et plus précises / Version MT5 gratuite Scanner du tableau de bord pour cet indicate
FREE

Ultimate MTF Support & Resistance - 5 Star Best Seller Beginner or Professional our best selling multi-timeframe Pivot Prof will enhance your trading and bring you great trade opportunities with the Support and Resistance levels that professionals use. Pivot trading is a simple effective method for entering and exiting the market at key levels and has been used by professionals for decades and works on all symbols: Forex, Crypto, Stocks, Indicies etc. Pivot Prof brings premium levels to the trad

Description Very precise patterns to detect: entry signals as well as breakout, support and resistance reversal patterns. It points out zones in which, with a high probability, institutional orders with the potential to change the price’s direction and keep moving towards it, have been placed. KEY LINKS: Indicator Manual – How to Install – Frequent Questions - All Products How is this indicator useful? It will allow you to trade on the order’s direction, once its direction has been id
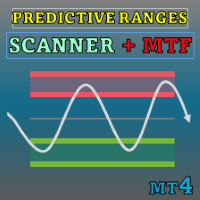
Special offer : ALL TOOLS , just $35 each! New tools will be $30 for the first week or the first 3 purchases ! Trading Tools Channel on MQL5 : Join my MQL5 channel to update the latest news from me Dans le paysage actuel du trading financier, où la volatilité est importante, l’identification précise des niveaux de support et de résistance est cruciale pour permettre aux traders de prendre des décisions éclairées. Predictive Ranges Scanner Multi-TF est un outil avancé conçu pour aid
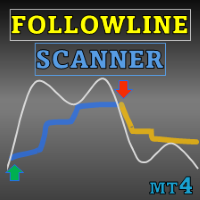
Special offer : ALL TOOLS , just $35 each! New tools will be $30 for the first week or the first 3 purchases ! Trading Tools Channel on MQL5 : Join my MQL5 channel to update the latest news from me Maximisez votre avantage commercial avec Follow Line avec Scanner, un indicateur avancé basé sur la volatilité conçu pour les traders sérieux. Cet outil combine la puissance des Bandes de Bollinger avec des paramètres personnalisables, offrant des informations précises sur les mouvements
FREE

RSI divergence indicator finds divergences between price chart and RSI indicator and informs you with alerts (popup, mobile notification or email). Its main use is to find trend reversals in the chart. Always use the divergence indicators with other technical assets like support resistance zones, candlestick patterns and price action to have a higher possibility to find trend reversals. Three confirmation type for RSI divergences: RSI line cross 50 level (doesn't repaint) Price returns to
FREE

M1 EASY SCALPER est un indicateur de scalping conçu spécifiquement pour l'unité de temps de 1 minute (M1), compatible avec toutes les paires de devises ou instruments disponibles sur votre terminal MT4. Bien sûr, il peut également être utilisé sur n'importe quelle autre unité de temps, mais il fonctionne particulièrement bien en M1 (ce qui est complexe !) pour le scalping. Note : si vous faites du scalping, assurez-vous d’avoir un compte adapté à cet effet. Évitez les comptes Cent ou Standard ca
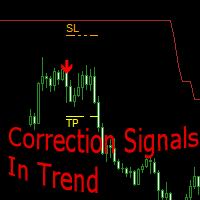
Correction Signals In Trend - un indicateur technique qui analyse la dynamique du marché, aide le trader à déterminer la direction de la tendance et à trouver des points pour ouvrir des ordres.
L'indicateur de suivi de tendance sous forme de lignes de support et de résistance montre une tendance à la hausse ou à la baisse.
Dans le sens de la tendance, après la fin de la correction, une recherche de signaux est effectuée. Les flèches indiquent les moments potentiels pour effectuer des opérations

Indicateur supérieur pour MT4 fournissant des signaux précis pour entrer dans un trade sans repeindre ! Il peut être appliqué à tous les actifs financiers : forex, cryptocurrencies, métaux, actions, indices.
La version MT5 est ici
Il fournira des signaux de trading assez précis et vous dira quand il est préférable d'ouvrir un trade et de le fermer.
Regardez la vidéo (6:22) avec un exemple de traitement d'un seul signal qui a rapporté à l'indicateur !
La plupart des traders améliorent leurs

MACD indicator in MetaTrader 4/5 looks different than MACD does in most other charting software. That is because the MetaTrader 4/5 version of MACD displays the MACD line as a histogram when it is traditionally displayed as a line. Additionally, the MetaTrader 4/5 version computes the Signal line using an SMA, while according to MACD definition it is supposed to be an EMA. The MetaTrader 4/5 version also does not compute a true MACD Histogram (the difference between the MACD/Signal lines). This
FREE

Êtes-vous fatigué de dessiner manuellement les niveaux de Fibonacci sur vos graphiques ? Êtes-vous à la recherche d'un moyen pratique et efficace d'identifier les principaux niveaux de support et de résistance dans votre trading ? Cherchez pas plus loin! Présentation de DrawFib Pro, l'indicateur ultime de MetaTrader 4 qui effectue automatiquement les niveaux d'ibonacci en s'appuyant sur vos graphiques et fournit des alertes en temps opportun lorsque ces niveaux sont dépassés. Avec Dr
FREE

The Grand Signal indicator is a unique tool that not only provides an understanding of market behavior but also precisely identifies trend entry points after intraday correction limits, with accuracy down to a five-minute candlestick! It includes individual settings for each currency pair. After purchasing, be sure to message me directly for instructions! Telegram: @Lapinsania or here in the Market! I

BUY INDICATOR AND GET EA FOR FREE AS A BONUS + SOME OTHER GIFTS! ITALO TREND INDICATOR is the best trend indicator on the market, the Indicator works on all time-frames and assets, indicator built after 7 years of experience on forex and many other markets. You know many trend indicators around the internet are not complete, does not help, and it's difficult to trade, but the Italo Trend Indicator is different , the Italo Trend Indicator shows the signal to buy or sell, to confirm the signal t
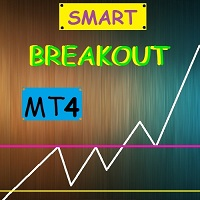
Smart Breakout Indicator determines support and resistance levels and also shows the breakout points of the levels in the form of a histogram.
The program contains two indicators in one: 1-support and resistance lines, 2-histogram indicator based on high price fluctuations. The indicator autonomously calculates the best support and resistance levels and also in the form of a histogram shows the best moments of the breakdown of the lines.
The histogram indicator is based on the action of pr

50% off. Original price: $60 Support and Resistance zones indicator for MT4 is a multi-timeframe panel and alert that finds support and resistance zones and pivot points for all timeframes of MetaTrader 4 and gives alert when price has interaction with them. Download demo version (works on GBPUSD, EURJPY and NZDUSD symbols) Read the full description of scanner parameters in the blog page . Many unique features in one indicator:
Integrating support and resistance zones and pivot points in one i
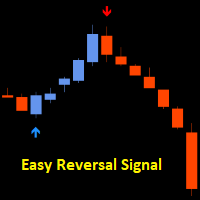
Easy Reversal Signal Indicator spots tops and bottom for catching new trends before they happen It shows entry signals with arrows Blue arrow = Buy entry Red Arrow = Sell entry Recommended timeframes are M1 and M5 but you can also use higher timeframes as well Best time to trade is London and New York session. I do not recommend trading the Asian session because due to the low volatility there can be more false signals. ENTRY RULES: The signals are non lagging and non repainting but you

Contact me for any queries or custom orders, if you want to use this in an EA.
Key Features: Pattern Recognition : Identifies Fair Value Gaps (FVGs) Spots Break of Structure (BOS) points Detects Change of Character (CHoCH) patterns Versatile Application : Optimized for candlestick charts Compatible with any chart type and financial instrument Real-Time and Historical Analysis : Works seamlessly with both real-time and historical data Allows for backtesting strategies and live market analysis Vi
FREE
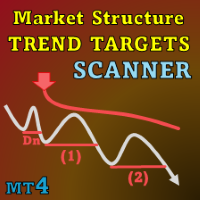
Special offer : ALL TOOLS , just $35 each! New tools will be $30 for the first week or the first 3 purchases ! Trading Tools Channel on MQL5 : Join my MQL5 channel to update the latest news from me I. Introduction
Market Structure Trend Targets Scanner est un outil puissant pour analyser les tendances du marché, identifier les points de rupture et gérer les risques grâce à un stop loss dynamique. En suivant les hauts et les bas précédents pour identifier les ruptures, cet outil ai

OVERVIEW
A Lorentzian Distance Classifier (LDC) is a Machine Learning classification algorithm capable of categorizing historical data from a multi-dimensional feature space. This indicator demonstrates how Lorentzian Classification can also be used to predict the direction of future price movements when used as the distance metric for a novel implementation of an Approximate Nearest Neighbors (ANN) algorithm. This indicator provide signal as buffer, so very easy for create EA from this indi
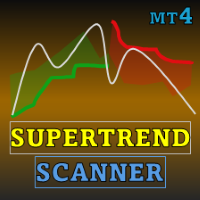
Special offer : ALL TOOLS , just $35 each! New tools will be $30 for the first week or the first 3 purchases ! Trading Tools Channel on MQL5 : Join my MQL5 channel to update the latest news from me Nous vous présentons le SuperTrend by Kivanc Ozbilgic with Scanner – un outil puissant et polyvalent conçu pour vous aider à anticiper les tendances du marché, avec des fonctionnalités personnalisables et des alertes en temps réel. Vous pouvez ajuster la méthode de calcul de l' ATR entr
FREE

Pivots Dashboard is the single most complete instruments set for Pivot Points trading currently available in the market. We have done a comprehensive research prior to the product design to make sure that this product meets every need of Pivot Point trading. Pivots Points are significant levels technical analysts can use to determine directional movement and potential support/resistance levels. Pivot Points are thus predictive or leading indicators. While the points were originally used by floor

L'algorithme trouve des zones de volatilité réduite basées sur l'indicateur UPD1 Trend Direction et construit le volume horizontal maximal basé sur l'indicateur UPD1 Volume Box . En règle générale, un fort mouvement de tendance se produit à la sortie de l'accumulation. Si le prix a quitté l'accumulation, il peut tester son volume horizontal maximal (POC). Smart alertes sont disponibles dans les paramètres.
Conditions d'entrée.
Paramètres de base. Bars Count – nombre de barres d'historique sur
FREE

What is the Volume Weighted Average Price (VWAP)? The volume weighted average price (VWAP) is a trading benchmark used by traders that gives the average price an instrument has traded at throughout the day, based on both volume and price. It is important because it provides traders with insight into both the trend and value of the instrument.
What is the Difference between VWAP and AVWAP? While VWAP is having as starting point the beggining of the day,week,month etc. in the AVWAP you can plac
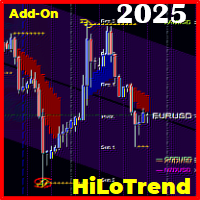
[Lancement à durée limitée, téléchargez dès que possible !] Avertissement : Ce produit « [#1] HiLoTrend CyberBot » est disponible en téléchargement gratuit en tant que l'un des produits complémentaires gratuits, en plus du produit gratuit « [#1] Oscillator CyberBot », dont le fonctionnement peut être observé dans la vidéo de présentation qui l'accompagne. En tant que produit complémentaire gratuit, il ne peut pas être activé indépendamment ; il n'est fonctionnel que lorsque le produit Ex
FREE

Consolidation Zone Indicator is a powerful tool designed for traders to identify and capitalize on consolidation patterns in the market. This innovative indicator detects consolidation areas and provides timely alerts when the price breaks above or below these zones, enabling traders to make informed trading decisions. MT5 Version : https://www.mql5.com/en/market/product/118748
Key Features:
1. Consolidation Detection : - Precise Identification : The Consolidation Zone Indicator accuratel
FREE
Special offer : ALL TOOLS , just $35 each! New tools will be $30 for the first week or the first 3 purchases ! Trading Tools Channel on MQL5 : Join my MQL5 channel to update the latest news from me Libérez la puissance de l'apprentissage automatique avancé avec le Machine Learning Adaptive SuperTrend , un indicateur de pointe conçu pour s'adapter en douceur aux conditions de marché changeantes. En intégrant le clustering par k-means à la méthodologie SuperTrend, cet indicateur perm

Bienvenue dans notre modèle de vague de prix MT4 -- (modèle ABCD) -- Le modèle ABCD est un modèle de trading puissant et largement utilisé dans le monde de l'analyse technique.
Il s'agit d'un modèle de prix harmonique que les commerçants utilisent pour identifier les opportunités potentielles d'achat et de vente sur le marché.
Avec le modèle ABCD, les traders peuvent anticiper les mouvements de prix potentiels et prendre des décisions éclairées sur le moment d'entrer et de sortir des t
FREE
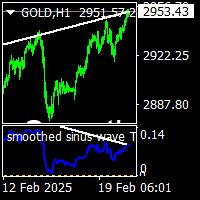
Smoothed Sinus wave Tv indicator is a extra ordinary oscillator.to find divergency. For mt4 and Tradingview pine script purchased people, after installed on terminal ,contact me on mql5 to get BONUS TradingView pinescript.
it works all pairs and all timeframes. suitable for experienced and beginner traders.. indicator works on toward of the prices... while sinus wave go up side that means prices will up. and while sinus wave go down that means prices is going down. it gives divegency when tre
Savez-vous pourquoi MetaTrader Market est le meilleur endroit pour vendre des stratégies de trading et des indicateurs techniques ? Pas besoin de publicité ou de protection logicielle, pas de problèmes de paiement. Tout est fourni dans le MetaTrader Market.
Vous manquez des opportunités de trading :
- Applications de trading gratuites
- Plus de 8 000 signaux à copier
- Actualités économiques pour explorer les marchés financiers
Inscription
Se connecter
Si vous n'avez pas de compte, veuillez vous inscrire
Autorisez l'utilisation de cookies pour vous connecter au site Web MQL5.com.
Veuillez activer les paramètres nécessaires dans votre navigateur, sinon vous ne pourrez pas vous connecter.