• 概要
  • レビュー
  • コメント (1)

InstaScalper Dashboard

Ever needed an instant 5 - 10 pips quickly?  We have developed a powerful solution for you. Important - Read description below! 


You can use InstaScalper as an entry tool on a smaller timeframe when you get higher timeframe signals here [https://www.mql5.com/en/market/product/85710] or as a standalone tool!


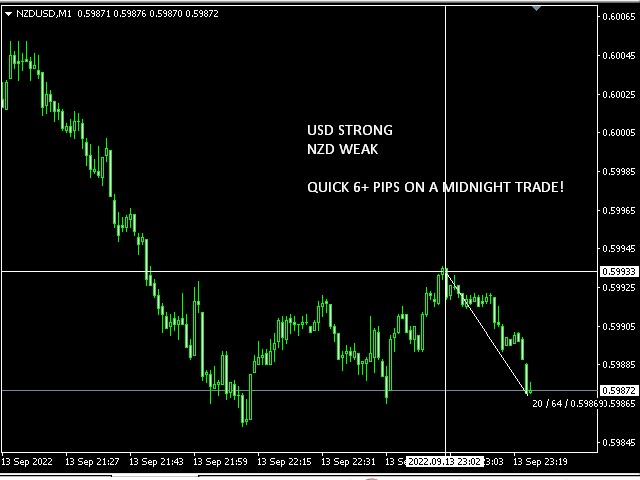
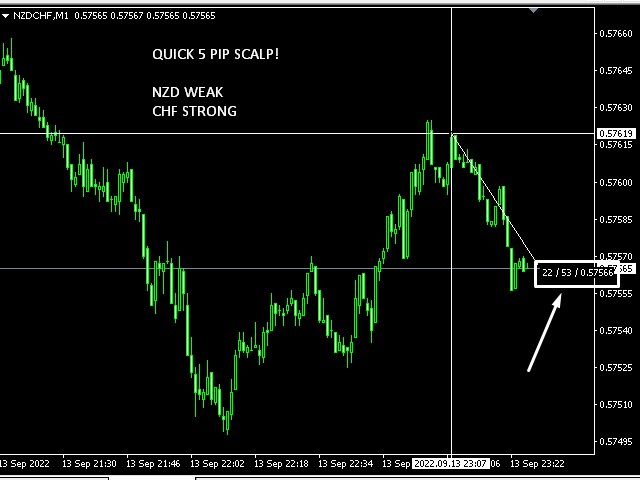
Introducing InstaScalper Dash. A true algorithmic beast GUARANTEED to give you a few pips at ANY time of the trading day, even just before market close!

Useful for both newbie and expert traders alike, all you need to do is simple. Pair a Strong Currency with a Weak Currency Average for an instant few pips and close the trade once the InstaScalper changes signals.

Trading has never been simpler. InstaScalper is compact and extremely lightweight, working on even the slowest PCs.


If you're familiar with any of our tools, you'll know that we use the multitimeframe trading approach. 

Use the InstaScalper on the M1 or M5 timeframe ONLY for the best entries.


おすすめのプロダクト
トレンドキャッチャー: アラートインジケーター付きのトレンドキャッチャーストラテジーは、市場トレンドやポテンシャルなエントリーポイントやエグジットポイントを特定するのに役立つ多目的な技術分析ツールです。動的なトレンドキャッチャーストラテジーを備えており、市場状況に適応してトレンドの方向を明確に視覚化します。トレーダーは、自身の好みやリスク許容度に合わせてパラメーターをカスタマイズできます。このインジケーターはトレンドの識別を支援し、ポテンシャルなリバーサルをシグナルし、トレイリングストップのメカニズムとして機能し、市場への迅速な対応のためのリアルタイムアラートを提供します。 特徴: - トレンドの識別:上昇トレンドと下降トレンドをシグナルします。 - トレンドのリバーサル:ローソク足の色が上昇から下降に変わった場合やその逆の場合に、ポテンシャルなリバーサルを警告します。 - リアルタイムアラート:新しいトレンドの識別に対するアラートを生成します。 推奨事項: - 通貨ペア:EURUSD、AUDUSD、XAUUSDなど... - タイムフレーム:H1。 - アカウン
FREE
BinaryScalping is a professional indicator for trading binary options and scalping. The algorithm of the indicator is based on the calculation of pivot points for each time period separately, the location of the price of the trading instrument relative to the pivot points is analyzed and the probability of a trading operation is calculated. The indicator has a built-in filter of trading signals based on the global trend. The indicator is installed in the usual way and works with any trading inst
Limitless MT4は、すべての初心者と経験豊富なトレーダーに適したユニバーサルインジケーターです。 すべての通貨ペア、暗号通貨、生の株式で動作します 無制限のMT4-構成済みで、追加の構成は不要 そして今、主なもの なぜ無制限のMT4なのか? 1再描画の完全な欠如 2トレーディングの最高のスペシャリストによる2年間のテスト 3正しい信号の精度が80%を超える 4ニュースリリース中の取引で好調 取引ルール 1買いシグナル-青い上向き矢印の出現 下向きの赤い矢印の外観を販売するシグナル シグナル後の次のローソク足で取引を開始するには2 3テイクプロフィット チャート上 М1-40ピップ М5-50ピップ М15-55-60ピップ 4ストップロスは利益をとる 5誤った信号をフィルタリングするために、 パラボリックSAR-トレンドとのトレードへの参入を除外する移動平均または同様のトレンドインジケーター。 
A scalping indicator based on mathematical patterns, which on average gives signals with relatively small SL, and also occasionally helps to catch big moves in the markets (more information in the video) This indicator has three main types of notifications: The first type warns of a possible/upcoming signal on the next bar The second type indicates the presence of a ready signal to enter the market/open a position The third type is for SL and TP levels - you will be notified every time price r
This indicator works on MT4 and is very easy to use. When you receive a signal from it, you wait for that candle with the signal to close and you enter your trade at the beginning of the next new candle . A red arrow means sell and a green arrow means buy. All arrows comes with Alert  like for easy identification of trade signal. Are you okay with that? 1 minute candle 1 minute expire
YOU CAN NOW DOWNLOAD FREE VERSIONS OF OUR PAID INDICATORS . IT'S OUR WAY OF GIVING BACK TO THE COMMUNITY ! >>>    GO HERE TO DOWNLOAD   The system is a free open source pine script originally published on TradingView by everget   . It was converted to Mt4 by Forex Robot Makers. This system is a  popular trend indicator based on ATR ( Average True Range ) , Moving Averages and the Donchian channel . System BackGround ATR The average true range is an indicator of the price volatility of an as
FREE
Trend PA
Mikhail Nazarenko
5 (3)
The Trend PA indicator uses   Price Action   and its own filtering algorithm to determine the trend. This approach helps to accurately determine entry points and the current trend on any timeframe. The indicator uses its own algorithm for analyzing price changes and Price Action. Which gives you the advantage of recognizing, without delay, a new nascent trend with fewer false positives. Trend filtering conditions can be selected in the settings individually for your trading style. The indicator
This Indicator is use the ZigZag to calculate the Upper and  Lower Bound and the uptrend and the downtrned. Red for downtrend, Green for uptrend and Yellow is for the horizontal trend this horizontal trend also bookmarked the upper limited and the lower limited the the price swings.  Or in simple the Support and the Resistance level. However, You may use the Heikin Ashi to confirm the trend of the buy sell signal above. I cannot guarantee the win rate, Nevertheless, you must study well the timef
The Smooth Price technical indicator is used for plotting a smoothed line as close to the price of the financial instrument as possible, and serves to eliminate its noise components. The indicator is part of the Monarch trading system, but here it is presented as an independent technical analysis tool. The indicator is based on the cluster digital filter , which, unlike the ClusterSMA , is applied directly to the price time series. Smooth Price does not redraw (except the very last, zero bar) an
Dear Traders this is my another tool called " Swing Master Indicator ". As the name above the indicator is designed to help you in swing trading by capturing the low and highs of the price. You may us this tool with any trading strategy and style from scalping to position trading. It is made for level of traders including newbies and advanced traders even prop-firms, hedge funds and banks to help them make sold market analysis. I create tools for serious traders who want to make a difference in
Owl smart levels
Sergey Ermolov
4.58 (55)
MT5版  |   FAQ Owl Smart Levels Indicator   は、 Bill Williams   の高度なフラクタル、市場の正しい波構造を構築する Valable ZigZag、エントリの正確なレベルをマークする Fibonacci レベルなどの一般的な市場分析ツールを含む 1 つのインジケーター内の完全な取引システムです。 利益を得るために市場と場所に。 戦略の詳細な説明 インジケータを操作するための指示 顧問-取引助手 プライベートユーザーチャット ->購入後に私に書いて、私はプライベートチャットにあなたを追加し、あなたはそこにすべてのボーナスをダウンロードすることができます 力はシンプルさにあります! Owl Smart Levels   取引システムは非常に使いやすいので、専門家にも、市場を勉強し始めて自分で取引戦略を選択し始めたばかりの人にも適しています。 戦略と指標に秘密の数式や計算方法が隠されているわけではなく、すべての戦略指標は公開されています。 Owl Smart Levels を使用すると、取引を開始するためのシグナルをすばやく確認し、
BinaryUniversal is a signal indicator for binary options and Forex. In its work, the indicator uses a complex algorithm for generating signals. Before forming a signal, the indicator analyzes volatility, candlestick patterns, important support and resistance levels. The indicator has the ability to adjust the accuracy of the signals, which makes it possible to apply this indicator for both aggressive and conservative trading. The indicator is set in the usual way, it works on any time period and
Discover the power of precision and efficiency in your trading with the " Super Auto Fibonacci " MT4 indicator. This cutting-edge tool is meticulously designed to enhance your technical analysis, providing you with invaluable insights to make informed trading decisions. Key Features: Automated Fibonacci Analysis: Say goodbye to the hassle of manual Fibonacci retracement and extension drawing. "Super Auto Fibonacci" instantly identifies and plots Fibonacci levels on your MT4 chart, saving you tim
FREE
GTAS FibTdi
Riviera Systems
3.2 (5)
GTAS FidTdi is a trend indicator using combination of volatility and potential retracement levels. This indicator was created by Bernard Prats Desclaux, proprietary trader and ex-hedge fund manager, founder of E-Winvest. Description The indicator is represented as a red or green envelope above or under prices. How to use Trend detecting When the envelope is green, the trend is bullish. When it is red, the trend is bearish. Trading Once a trade is opened, GTAS FibTdi shows retracement zones
FREE
Market Profile 3
Hussien Abdeltwab Hussien Ryad
4 (4)
Market Profile 3 MetaTrader 4 indicator  — is a classic Market Profile implementation that can show the price density over time, outlining the most important price levels, value area, and control value of a given trading session. This indicator can be attached to timeframes between M1 and D1 and will show the Market Profile for daily, weekly, monthly, or even intraday sessions. Lower timeframes offer higher precision. Higher timeframes are recommended for better visibility. It is also possible t
FREE
Instantly spot simple candlestick patterns with MSHT Price Pattern MSHT PRICE PATTERN can automatically detect more than 200 different candlestick patterns, including multi-candle patterns. This makes it easy for you to see if what you care about is present on a chart or not at a glance, and reduces the amount of time you have to stare at charts to check off items on your investment checklist. Candlestick Pattern Recognition is supported on charts, alerts, in scanners and smart checklists. A
Embark on the pinnacle of Binary Options evolution. Our indicator isn't just adaptive—it's relentless. Picture a ninja riding a serpent, shadowing its every move; that's how this tool trails the market trend, unwavering till the end. Built upon the foundational prowess of the Ichimoku indicator and honed with an array of fine-tuned oscillators, it epitomizes accuracy and precision. Dive deep without getting lost in the Ichimoku's intricacies—our indicator simplifies the process for you. Perhaps
Perfect for one minutes high trading and scalping. This indicator is very effective for trading on one minutes, in the hour. A combination of moving averages and STOCHASTICS calculation to produce a very convincing signal every hour. Blue colour signals a buy opportunity. Follow the X signs for possible buy points. The Blue average line serves as possible trend direction and support. Red colour signals a sell opportunity. Follow the X signs for possible sell points. The Red average line serves a
TrendPlus
Sivakumar Subbaiya
4.21 (14)
Trend Plus   Trendplus  Indicator   Time Frame: Suitable for any time frame.  Purpose: Trend Prediction. Blue and red candle indicate the buy and sell call respectively. Buy: When the blue candle is formed buy call is initiated. close the buy trades when the next red candle will formed.   Sell: When the Red candle is formed Sell call is initiated. close the Sell trades when the next blue candle will formed.   Happy trade!!
FREE
"The trend is your friend" is one of the best known sayings in investing, because capturing large trendy price movements can be extremely profitable. However, trading with the trend is often easier said than done, because many indicators are based on price reversals not trends. These aren't very effective at identifying trendy periods, or predicting whether trends will continue. We developed the Trendiness Index to help address this problem by indicating the strength and direction of price trend
Free automatic Fibonacci is an indicator that automatically plots a Fibonacci retracement based on the number of bars you select on the BarsToScan setting in the indicator. The Fibonacci is automatically updated in real time as new highest and lowest values appears amongst the selected bars. You can select which level values to be displayed in the indicator settings. You can also select the color of the levels thus enabling the trader to be able to attach the indicator several times with differe
FREE
This indicator draws Horizontal Support and Resistance automatically. It works with any symbol and any timeframe. Stronger Support Lines are displayed in thicker green horizontal lines. In the same way, Stronger Resistance lines are displayed with thicker red lines. Change the timeframe to display the Support and Resistance Lines of various timeframes.
回帰取引を意味する専門的かつ定量的なアプローチを実装する独自の指標。これは、価格が予測可能かつ測定可能な方法で迂回して平均に戻るという事実を利用しており、非定量的な取引戦略を大幅に上回る明確な出入りルールを可能にします。 [ Installation Guide | Update Guide | Troubleshooting | FAQ | All Products ] 明確な取引シグナル 驚くほど簡単に取引できます カスタマイズ可能な色とサイズ パフォーマンス統計を実装します ほとんどの取引戦略を上回ります 適切なSLおよびTPレベルを表示します 電子メール/音声/視覚アラートを実装します 使い方 インディケータは、より高い時間枠からの完全にカスタマイズ可能な移動平均の周りの標準偏差を測定し、トレンドフォローアプローチを使用して正確に取引を見つけます。取引は、現在のチャートの価格アクションに飛び込むことによって見つけられ、価格が選択したより高い時間枠から計算された平均価格帯に戻ったときに閉じられます。それがコード化される方法のために、指標は高ボラティリティと強いトレンドの
Bomb Bank シグナル: MetaTrader 4 の信頼度インジケーター Bomb Bank Signal は、金融市場で最も関連性の高いトレンドを特定するように設計された MetaTrader 4 の強力なインジケーターです。動きを正確に予測するツールをお探しなら、Bomb Bank が最適です。 仕組み: このインジケーターは、出来高分析、ローソク足終値、対称トレンドという 3 つの異なる方法を組み合わせて、売買の機会を検出してシグナルを送ります。 Bomb Bank は、買いの機会を特定するときは「爆弾」のようなものであり、売りシグナルを検出するときは「ドクロ」のようなものです。 ボムバンクはなぜ違うのですか? 完全な信頼性: Bomb Bank Signal は信号を削除しません。一度シグナルが発せられると、シグナルは残り続けるので、チャンスを逃すことはありません。 極めて高い精度: Bomb Bank は誤った信号を送信しません。リアルタイムで最新情報を更新し、市場の進化に合わせて調整しながら、以前のシグナルの透明性を維持します。 ライブアップデ
The indicator allows you to trade binary options. The recommended time frame is М1 and the expiration time is 1,2,3 minutes. The indicator suitable for auto and manual trading. A possible signal is specified as a arrows above/under a candle. You should wait until the candle closes! Arrows are not re-painted Trade sessions: TOKYO section (Half-end) Currency pairs: USD/JPY Working time frame: M1 Expiration time: 1,2,3 minutes. The indicator also shows good results when using the martingale strateg
FREE
The Penta-O is a 6-point retracement harmonacci pattern which usually precedes big market movements. Penta-O patterns can expand and repaint quite a bit. To make things easier this indicator implements a twist: it waits for a donchian breakout in the right direction before signaling the trade. The end result is an otherwise repainting indicator with a very reliable trading signal. The donchian breakout period is entered as an input. [ Installation Guide | Update Guide | Troubleshooting | FAQ | A
Candle EA MT4
Mansour Babasafary
4.43 (49)
This expert is based on patterns The main patterns of this specialist are candlestick patterns Detects trends with candlestick patterns It has a profit limit and a loss limit, so it has a low risk The best time frame to use this expert is M30 time frame The best currency pairs to use with this expert is the EURUSD, GBPUSD, AUDUSD, USDCAD currency pairs Attributes: Can be used in the EURUSD, GBPUSD, AUDUSD, USDCAD  currency pairs Can be used in M30, H1, H4 time frames Has profit limit an
This is a new strategy for SUPPLY DEMAND areas It is based on a calculation using the tick volume to detect the big price action in market for both bear /bull actions this smart volume action candles are used to determine the supply and demand areas prices in between main supply and demand lines indicate sideway market  up arrows will be shown when prices moves above the main supply and the secondary supply lines Down arrows will be shown when prices moves below the main demand and the secondary
Adjustable Fractal MT4 is a modification of Bill Williams' Fractals indicator. The fractal consists of a two sets of arrows - up (upper fractals) and down (lower fractals). Each fractal satisfies the following conditions: Upper fractal - maximum (high) of a signal bar exceeds or is equal to maximums of all bars from the range to the left and to the right; Lower fractal - minimum (low) of a signal bar is less or equal to minimums of all bars from the range to the left and to the right. Unlike a s
FREE
The indicator shows you buy/sell signals and does not repaint. It works well with almost all pairs, while the best ones are GBPUSD, XAUUSD and EURUSD. The product works better on H1 and H4. You can change the parameters in the inputs tab to get the best signals and the best trade results on each pair. You can enable/disable alerts when signal appears. The indicator is easy to use. Parameters barstrip & Sensitive: amount of bars to process the highest and lowest prices (relates to the internal
このプロダクトを購入した人は以下も購入しています
製品を購入する前に、以下の情報をお読みください。 Apollo Pips PLUS SP はユニークな製品です。これは、私の新しい「アポロ ピップス」インジケーターと、私のすべての取引インジケーターにアクセスできる「スーパー パック」ボーナスを手に入れたい人のためのものです。 Apollo Pips PLUS SP 製品を購入すると、実際には私の Apollo Pips インジケーターのまったく新しいバージョンを購入することになります。このバージョンのインジケーターには改良されたアルゴリズムと使いやすいパラメーターがあり、あらゆる市場およびあらゆる取引スタイルでインジケーターを使用する機会が得られます。 この製品の購入者は、私のスーパーボーナスとして、他のすべてのインジケーターにも無料でアクセスできます!私のすべての取引ツールにアクセスしたい場合は、この製品が最適です!:) しかし、これがすべてではありません!:) この製品のすべての購入者は、私の新しいインジケーターを無料で入手する資格もあります!:)新しい取引インジケーターを利用できるようになりました。私の特権のある「スーパー パッ
Gold Channel is a volatility-based indicator, developed with a specific timing algorithm for the XAUUSD pair, which consists of finding possible corrections in the market. This indicator shows two outer lines, an inner line (retracement line) and an arrow sign, where the theory of the channel is to help identify overbought and oversold conditions in the market. The market price will generally fall between the boundaries of the channel. If prices touch or move outside the channel it is a tra
PZ Day Trading
PZ TRADING SLU
3.67 (3)
このインディケータは、価格アクション分析とドンチャンチャネルのみを使用して、ジグザグ方式で価格の反転を検出します。再描画やバックペインティングを一切行わずに、短期取引向けに特別に設計されています。それは彼らの操作のタイミングを増やすことを目指している賢明なトレーダーにとって素晴らしいツールです。 [ インストールガイド | 更新ガイド | トラブルシューティング | よくある質問 | すべての製品 ] 驚くほど簡単に取引できます すべての時間枠で価値を提供します 自己分析統計を実装します 電子メール/音声/視覚アラートを実装します 可変長のブレイクアウトと混雑ゾーンに基づいて、インディケータは価格アクションのみを使用して取引を選択し、市場が非常に高速に行っていることに反応します。 過去のシグナルの潜在的な利益が表示されます この指標は、独自の品質とパフォーマンスを分析します 負けブレイクアウトは強調表示され、説明されます インジケータは、非バックペインティングおよび非再ペイントです この指標は、日中のトレーダーが単一の価格反転を見逃さないようにするのに役立ちます。ただし、す
Enigmera
Ivan Stefanov
5 (4)
エニグメラ:市場の中核 https://www.enigmera.com はじめに このインディケータと取引システムは、金融市場に対する驚くべきアプローチです。ENIGMERAは、フラクタルサイクルを使用して、サポートとレジスタンスレベルを正確に計算します。本格的な蓄積局面を示し、方向性と目標を示します。 トレンド中でも調整中でも機能するシステムです。 どのように作動するのか? ENIGMERAは、支持線・抵抗線、目標線、乖離線の3つのラインで構成されています。このシステムは、過去のデータを現在と未来に外挿する典型的な市場指標とは異なり、現在の完全な画像を提供します。支持線上にある場合、それは本当の支持を意味し、抵抗線上にある場合、それは本当の抵抗を意味する。ある水準が破られた場合、それはトレンドの変化を意味する。再描画はしない。 市場は常に進化しているため、ENIGMERAはその評価ツールを適応させ、定期的に戦略を修正しています。  これにより、すべてのシナリオが徹底的に評価されることが保証されます。この市場指標の独自性は、その能力を見れば明らかです。  ENIGM
トレンドトレーディング は、タイミングのプルバックとブレイクアウトにより、市場で起こっているトレンドから可能な限り利益を得るように設計された指標です。確立されたトレンドの中で価格が何をしているかを分析することにより、取引の機会を見つけます。 [ インストールガイド | 更新ガイド | トラブルシューティング | よくある質問 | すべての製品 ] 自信を持って効率的に金融市場を取引する むち打ちにならずに確立されたトレンドから利益を得る 収益性の高いプルバック、ブレイクアウト、早期の逆転を認識する この指標は、独自の品質とパフォーマンスを分析します 複数時間枠のダッシュボードを実装します インジケーターは再描画されていません 電子メール/音声/視覚アラートを実装します 確立されたトレンドは多くの取引機会を提供しますが、ほとんどのトレンド指標はそれらを完全に無視しています。インジケーターの解釈はかなり簡単です: (1) トレンドの変化 (2) トレンドの方向への後退 (3) トレンドの方向へのブレイクアウト 赤いダッシュ は下降トレンド中の修正です 青いダッシュ は上昇ト
最初のパルスレベルを反転 (RFI)     指示する     ロシア     -        utilizar con   el indicador の ESP 推奨事項 -   TPSpro トレンド プロフェッショナル版 -   MT5のバージョン 最も重要なことは、将来においても最も重要なことです。 機能のプリンシパル: ゾーンのほとんどは、ベンダーとコンプラドールによってアクティブ化されます。 状況を直感的に把握できるよう、初期の衝動を修正します。 LOGIC AI: MUESTRA zonas (círculos) parabuscar puntos de entrada cuando se activa una plantilla 視覚的に優れた視覚効果があり、最も重要な機能がすべて揃っていることに注意してください。 優れたニベレス/ゾーンの視覚化 (modo MTF) 世界で最も人気のある場所/ゾーンです。これを使用するのに最適な方法です (   TPSproTREND PRO   )。 アルゴリズム プロフェッショナル セパラド パソ ア パソ パラ オペラ それは
Connect Indicator is a tool used for connecting indicators between the MQL market and MT4. The connected indicators are made by our group and can be used for other applications, such as sending messages to the Line application or Telegram application. If you have any questions, please don't hesitate to ask us to receive support. Function and indicator buffer Buffer one is the high price of the previous candle. Buffer two is the high price of the previous candle. Usage To connect indicators to fu
Indicator : RealValueIndicator Description : RealValueIndicator is a powerful tool designed specifically for trading on the EURUSD pair. This indicator analyzes all EUR and USD pairs, calculates their real currency strength values, and displays them as a single realistic value to give you a head start on price. This indicator will tell you moves before they happen if you use it right. RealValueIndicator allows you to get a quick and accurate overview of the EURUSD currency pair tops and bottoms,
How to use Pair Trading Station Pair Trading Station is recommended for H1 time frame and you can use it for any currency pairs. To generate buy and sell signal, follow few steps below to apply Pair Trading Station to your MetaTrader terminal. When you load Pair Trading Station on your chart, Pair Trading station will assess available historical data in your MetaTrader platforms for each currency pair. On your chart, the amount of historical data available will be displayed for each currency pai
The indicator is designed to work on any trading platform. The program is based on proprietary algorithms and W.D.Ganna's mathematics, allowing you to calculate target levels of price movement based on three points with the highest degree of certainty. It is a great tool for stock trading. The indicator has three buttons: NEW - call up a triangle for calculation. DEL - delete the selected triangle. DELS - completely remove all constructions. The probability of achieving the goals is more than 80
Introduction to X3 Chart Pattern Scanner X3 Cherart Pattern Scanner is the non-repainting and non-lagging indicator detecting X3 chart patterns including Harmonic pattern, Elliott Wave pattern, X3 patterns, and Japanese Candlestick patterns. Historical patterns match with signal patterns. Hence, you can readily develop the solid trading strategy in your chart. More importantly, this superb pattern scanner can detect the optimal pattern of its kind. In addition, you can switch on and off individu
ECM Elite Channel is a volatility-based indicator, developed with a specific time algorithm, which consists of finding possible corrections in the market. This indicator shows two outer lines, an inner line (retracement line) and an arrow sign, where the channel theory is to help identify overbought and oversold conditions in the market. The market price will generally fall between the boundaries of the channel. If prices touch or move outside the channel, it's a trading opportunity. The
TrendMaestro
Stefano Frisetti
5 (3)
note: this indicator is for METATRADER4, if you want the version for METATRADER5 this is the link:  https://www.mql5.com/it/market/product/108106 TRENDMAESTRO ver 2.4 TRENDMAESTRO recognizes a new TREND in the bud, he never makes mistakes. The certainty of identifying a new TREND is priceless. DESCRIPTION TRENDMAESTRO identifies a new TREND in the bud, this indicator examines the volatility, volumes and momentum to identify the moment in which there is an explosion of one or more of these data a
This product is based on the methodologies of Gann, his follower Don E. Hall. The Indicator builds a working view grid, which is used to analyze graphics. The Pyrapoint tool, developed by Don Hall, is a grid based on the Pythagorean cube. In his calculations he uses the Gann Square 9 methodology and the relationship between Price and Time. This tool is used to predict changes in trend and overall market actions. More information about the method   HERE
3 Indicators in 1 indicator Strategy based on price action Made specifically for the best forex currency pairs Can be used in the best time frame of the market at a very reasonable price This indicator is basically 3 different indicatos . But we have combined these 3 indicators in 1 indicator so that you can use 3 indicators at the lowest price. All three strategies are based on price action. But based on different trends. Long term, medium term and short term Attributes : No repaintin
Max Payneは、矢印の形でシグナルを与える反転/トレンドシグナルインジケーターです。このインジケーターは、同じバーの終値でシグナルを出します。このインジケーターは、異なる期間でチャート上に複数回ドロップして、シグナルの2倍/3倍の確認を取得できます。 このインジケーターは、あらゆる取引スタイルに合わせて高度に調整できますが、再描画やバックペイントは一切行われません。購入後には、使用したテンプレートとともにスクリーンショットに表示される完全なシステムが表示されます。 ----------------- 取引方法: トレンドフィルター(購入後に得られるペイントレンド)が方向に一致している間、同じバーでトリプル確認が得られるまで待ちます 取引を開始し、買い取引の場合は金色の矢印 (テンプレート) より下、売り取引の場合は金色の矢印 (テンプレート) より上にストップロスを設定します。終了シグナルは最初の反対側の白い点のシグナル (テンプレート) です。 ----------------- パラメーター : 信号周期:矢印周期 フィルター: 信号フィルター 距離 : ローソクからの矢印
JULY OFFER 80% OFF next price for unlimited version will be 17000$. This is the only time you can get this institutional and professional indicator at this price for unlimited version. Don't dare to miss this. The tool I am about to introduce to you you can't compare it with other tools due to its strategy and accuracy level in predicting the next price directional movement . This tool is designed for serious traders who have decided to make a difference through trading. Be the next person to wi
The indicator " ZigZag on Trend " is an assistant in determining the direction of price movement, as well as a calculator of bars and points. It consists of a trend indicator, which follows the price direction by the trend line presented in the form of a zigzag and a counter calculating the number of bars traversed in the direction of the trend and the number of points on the vertical scale. (calculations are carried out by the opening of the bar) The indicator does not redraw. For convenience,
もちろんです。以下は、提供いただいたテキストの日本語への翻訳です: MT4用の天文学指標をご紹介します:究極の天体トレーディングコンパニオン トレーディング体験を天空の高みに高める準備はできていますか?私たちの革命的なMT4用の天文学指標をご紹介します。この革新的なツールは、複雑なアルゴリズムの力を借りて、類まれなる天文学的洞察と精密な計算を提供します。 あなたの指先で宇宙の情報を: 宝のような天文学的データが明らかになる包括的なパネルをご覧ください。惑星の地理的/太陽中心座標、太陽と地球の距離、星の大きさ、伸び、星座、黄道座標および赤道座標、さらには水平座標まで、それぞれが綿密に計算され美しく表示されています。指標によって生成される垂直線は時間値に対応し、トレーディングの旅に宇宙の視点を提供します。 惑星のラインと関係: グラフを飾る惑星のラインの魔法を体験し、スケールと角度をカスタマイズできます。直感的なコントロールパネルを介して各惑星のラインの表示を簡単に切り替えることができます。指定された時刻範囲内での合会、六分会、四分会、三分会、対会、逆行の指標で天体の関係の芸術を発見してく
MT5 Version SMT Divergences MT4 SMT Divergences is one of the most innovative indicators in the market. It offers the possibility of analyzing price divergences between 2 pairs. These divergences highlight and help to foresee what banks and institutions are planning to do. SMT divergences also provides you with a kill zones indicator and the possibility of filtering divergences occurring during these kill zones.  The strategy tester is limited in MT4. Contact the author to get your Demo Version
Contact us to receive a comprehensive user guide after purchasing. William Delbert Gann, commonly known as W.D. Gann, was an exceptional market analyst renowned for his unique trading style in the early 20th century.  His trading techniques were based on a blend of mathematics, geometry, astrology, and ancient mathematics. Gann believed that stock market movements followed specific patterns and cycles, rather than being random. His methodologies, celebrated for their accuracy and relevance, con
NOTE: PRICE WILL RISE VERY SOON. DON'T SKIP THIS OFFER! Dear traders I am glad to introduce the " Market Swing Scanner Board" indicator to you. This indicator was made mainly to be used in combination with the Market Swing Index Indicator. You use the  "Market Swing Scanner Board"  indicator to scan for trading opportunities on the  Market Swing Index Indicator . This tool is designed for serious traders who have decided to make a difference through trading. Be the next person to witness this st
This indicator is based on the mathematics of the great trader W.D. Ganna. With its help, you can easily find strong levels by analyzing swings to find the optimal entry point. The indicator works on all instruments and all timeframes. The indicator is fully manual and has control buttons. All you need to do is press the NEW button, a segment will appear, which you can place on any movement, swing or even 1 candle that you want to analyze. By placing the segment, press the OK button. A grid (th
The indicator of a Professional Trader is an arrow indicator for predicting the direction of price movement. I have been working on this indicator since 2014. You can use this indicator as your main indicator, use its entry signals, and use it as your only indicator to find entry points. About the product: Recommended TF [H4-D1-W1]   . The indicator predicts the direction of the next candle. Fits a variety of tools; Flexibility in settings for different instruments and intervals through the
TRANSACTION SPEEDは、大口注文がいつどこで市場に集積され、その恩恵を受けているかを示す最高品質の指標です。トレンドの変化を非常に早い段階で検知します。インジケーターであると同時にトレーディングシステムでもあります。そのコンセプトはユニークで、驚くほど収益性が高い。 FXでは、ティックボリュームはボリュームと呼ばれ、誤解を招きやすい。実際は、単位時間当たりの価格変動であり、事実上、取引速度(TRANSACTION SPEED)です。 このインジケーターは、FXにおける出来高の概念を完全に見直し、正しい方法で論理的に定義し、このロジックを適用することで、ユニークで正確なトップレベルの収益ツールになります。 スピードが上がれば、それはより大きな関心とそれに対応するエントリーとエグジットのサインです。 使い方は? このインジケーターは、市場の取引スピードを測定・比較するため、まず最初に行うべきことは以下の通りです。 比較を行う期間を選択することです。 通常、15日前が比較の出発点となります。 インジケータに日付を入力して実行する。 30分または1時間のタイムフレー
The Th3Eng Ninja indicator is based on an analysis of the right trend direction with perfect custom algorithms. It show the true direction and the best point of the trend. With Stop Loss point and Three Take Profit points. Also it provides a secondary entry points in dots arrows style. And Finally it draws a very helpful lines from entry level to TP1, TP2, TP3, SL levels or the reverse signal, and all current/old signals status. How to use the indicator No complicated steps ,   Just follow 2
Please send me Direct message on MQL5 CHAT after purchasing the Indicator for Training and Installation Support There are some additional files that is important to use with the Indicator . So be sure to contact me after purchasing the Indicator So that I can add you for training and support . If you find any difficulty with installation then send me Direct message here So that I can connect with you via Anydesk or Teamview for the product installation. " Smart Order Block Indicator " to find
Cyclical indicator for trading and predicting the direction of the market. Shows the cyclical behavior of the price in the form of an oscillator. Gives signals for opening deals when rebounding from the upper and lower boundaries of the oscillator. In the form of a histogram, it shows the smoothed strength of the trend. Will complement any trading strategy, from scalping to intraday. The indicator does not redraw. Suitable for use on all symbols/instruments. Suitable time frames for short-term
Full Forex Market View Dashboard
Opengates Success International
5 (2)
FULL FOREX MARKET VIEWダッシュボードインジケーター これは、トレーダーが市場で何が起こっているかを完全に把握できるようにするために作成されたカスタム指標です。 リアルタイム データを使用して市場にアクセスし、取引を成功させるために必要なあらゆる情報を表示します。 インストール: このインジケーターをウィンドウ チャートに添付する前に、MT4 のマーケット ウォッチ パネルに移動し、不要な通貨ペアまたは取引しないすべての通貨ペアを非表示にして、残りをそこに残します。 その理由は、FFMV ダッシュボードが MT4 の気配値表示に表示されるすべての通貨ペアを表示するためです。 最大 30 通貨ペア以下を表示できます。 MT4 の気配値表示でそれ以上だと、FFMV ダッシュボードのフォントと画像がぼやけて変形します。 正しく表示されません。 使用法:      個人取引の場合      バスケット取引の場合 (方法についてはスクリーンショットを参照してください)      複数注文取引にも使用可能      独自の取引システムなどから
Gann Signal is a very simple indicator at first glance, but hidden inside is many years of experience in studying W.D.Ganna methods. The indicator gives accurate BUY/SELL signals, without redrawing. The indicator is very easy to use. All you need to do is attach it to your chart and follow its recommendations. The indicator constantly analyzes the market for entry opportunities. When such an opportunity appears, the indicator gives a signal in the form of an arrow. I repeat, all signals are NOT
作者のその他のプロダクト
Ultimate Sniper Dashboard
Hispraise Chinedum Abraham
4.85 (27)
299ドルで割引中! 今後値上げの可能性あり! 下の説明を読んでください! 究極のスナイパーダッシュボードのための最高のエントリーシステム。究極のダイナミックレベル。(私の製品をチェックしてください) 究極のスナイパーダッシュボードはMT4多通貨テスト制限のため、ライブマーケットでのみ作動します。 究極のスナイパーダッシュボードをご紹介します。HA-Sniper、MA-Sniper、その他多くの特別なモードが含まれる最高の製品です。究極のスナイパーダッシュボードは絶対的な獣です! 初心者やエキスパートトレーダーにとって最高のソリューションです。もう二度と動きを見逃さない! シンプルさとピップを愛するトレーダーのために、特別な製品をご用意しました。シンプルでありながら、ダッシュボードは複数のカスタムアルゴリズムに基づき28の通貨ペアを監視し、すべての作業を行います。たった一つのチャートで、プロのように市場を読み解くことができます。もし、為替ペアが動き出したときに、その方向性を正確に特定することができれば、あなたの取引はどれほど改善されることでしょう。   当社のシ
このカスタムアルティメットスナイパーダッシュボードは、オリジナルのアルティメットスナイパーダッシュボードインジケーターをEAでアップグレードしたものです。最大98種類のアルゴリズムで動作し、使用する資産クラスのトレンドの本質を確実に捉えます。 数ヶ月に渡り、多くのお客様から頂いたご提案やアドバイスに直接お応えしたものです。   このカスタムバージョンは、完全にカスタマイズ可能です。 98の独立したカスタムアルゴリズムによって支えられています。 非常に素晴らしいビジュアルインターフェースなので、どのペアやタイムフレームでも、簡単かつ自信を持って市場全体の動向を追うことができます。 テレグラムにリアルタイムのアラートを送ることができます。 取引するペアに応じた独自のインデックスを作成することができます。 携帯電話にリアルタイムでアラートを送ることができるので、PCの前にいなくても動きがあることを知ることができます。 入力設定から8つの指標を設定することができます。 アラートを受信する指標と時間枠を設定することができます。 インターネット接続が検出されなかった場合、アラ
Downloads missing data for all currency pairs available in market watch. Very useful for backtesting EAs and strategies and downloading all history at once instead of individually. This products downloads data for the Ultimate Sniper Dashboard and can work with any other products. The indicator will run until all the historical data for the selected currency pairs have been downloaded. The indicator has multiple options: 1. Download data for single pair 2. Download for current pair only 3. Downl
FREE
HA Sniper Dashboard
Hispraise Chinedum Abraham
5 (2)
残り3枚だけで99! 次の価格249円! 任意の初心者や専門家のトレーダーのための最良のソリューション! 再び動きを見逃すことはありません!  シンプルさとピップを愛するトレーダーのために、私たちはあなたのための特別な製品を持っています。 自然の中でシンプルな、ダッシュボードは、私たちのカスタムHikenAshiベースのアルゴリズムで12通貨ペアを見てすべての作業を行います。 唯一のチャートを使用すると、プロのように市場を読むことができます。 ちょうどあなたが任意の外国為替ペアの方向を特定することができ、それが移動を開始したときに正確にする場合は、あなたの取引が改善するこ 私たちのシステムは、これらの高確率信号を見つけて、リアルタイムでユーザーに警告を送信するために構築されています。 遅れおよび偽りの約束無し、私達は私達の単語によって立ちません。 システムは、移動を見つけて、あなたに彼らが表示された瞬間を警告するために構築されています! あなたの高い確率の動きを見つけるために、バックグラウンドで作業しながら、あなたがそれを必要としないときにきれいなあな
MA Sniper Dashboard
Hispraise Chinedum Abraham
4 (1)
残り9枚だけで149枚! 次回価格199円!   私たちのMA-スナイパーダッシュボードはライブです! 代替ハ-スナイパーダッシュボードを探す(通販で購入)] https://www.mql5.com/en/market/product/85666 ] 任意の初心者や専門家のトレーダーのための最良のソリューション! 再び動きを見逃すことはありません!    シンプルさとピップを愛するトレーダーのために、私たちはあなたのための特別な製品を持っています。 自然の中でシンプルな、ダッシュボードは、私たちのカスタム移動平均ベースのアルゴリズムで28通貨ペアを見て、すべての作業を行います。 唯一のチャートを使用すると、プロのように市場を読むことができます。 ちょうどあなたが任意の外国為替ペアの方向を特定することができ、それが移動を開始したときに正確にする場合は、あなたの取引が改善するこ 私たちのシステムは、これらの高確率信号を見つけて、リアルタイムでユーザーに警告を送信するために構築されています。 遅れおよび偽りの約束無し、私達は私達の単語によって立ちません。 シス
This indicator changes all the open charts to one single currency pair.  This is useful when scanning multiple timeframes for setups and when backtesting strategies across multiple currency pairs. The image combines this indicator (Set Symbol For All Charts) with the ABHSyncScroller  and a Currency Picker.  IF you have this indicator and the ABHSyncScroller , send me a message and I will send you the Currency picker and a template for FREE. Simply add the indicator to one open chart. All th
Ultimate Dynamic Levels
Hispraise Chinedum Abraham
4.73 (11)
現在、ホリデーディスカウントで399ドル! 今後値上がりする可能性があります。以下の説明をお読みください。 Ultimate Dynamic Levelsの紹介 - Ultimate Sniper DashboardのBESTエントリーインジケーター! 極めてローリスクなタイムリーエントリーと高RR!!! アルティメットスナイパーダッシュボードはこちら。 初心者はもちろん、プロのトレーダーにとっても最も重要な能力は、いつどこで相場が転換するかを正確に判断し、いかに安全に参入し、利益を得て退場するかを見極めることです。 アルティメット・ダイナミック・レベルズ・インディケーターは、相場が転換する可能性が最も高い場所を簡単に教えてくれるので、極めてローリスクなトレードを自信を持って行うことができ、同時にチャートをクリーンでシンプルに保ちながら、$$$を稼ぐことができるのです! アルティメット・ダイナミック・レベルズ・インディケーターは、複数の時間枠で重要な隠れたレベルを一度に見つけるユニークで強力なアルゴリズムを持っています。また、他の典型的なSRインジケーターのように、レベ
最適な逆指値の見つけ方固定ストップロスや過去の高値や安値の下に置くといった通常の人気のあるストップロス手法を使うことは、いくつかの理由で不利になります。1. 1. ブローカーはすでにこれらの領域を知っているので、それを利用するのは簡単です。2. 2. 市場が大きくなったり小さくなったりすることがあるので、常に固定ストップロスを使用することはできません。また、市場からの利益を少なくするか、すぐにストップアウトされるように自分を過剰に露出させることになります。3. 3. すでに人気のあるストップロス手法を使用してストップロスを設定すると、他の多くの人があなたと同じようにストップロスを使用する可能性があります。あるブローカーは、あなたが同じようなストップロス価格を使用しているというだけで、あなたの取引を他のトレーダーからコピーされたものとみなすかもしれません。当社のツールでは、ATRを一部使用したカスタムアルゴリズムを作成し、リアルタイムで市場の幅を計算し、常に最適なポジションを提供します。薄い市場ではストップロスのサイズを小さくし、広がった市場ではストップロスのサイズを大きくして、市場があ
Optimal Trailing TP
Hispraise Chinedum Abraham
Optimal Trailing TP インジケータは、エントリーツールと利益確定ツールの両方とし て機能します。そのユニークなデザインにより、買いシグナルと売りシグナルを提供することができます。すでにポジションを持っている場合は、シグナルの矢印を無視することができます。ポジションを持っていない場合、矢印は、インジケータが設定されている時間枠または通貨ペアでその方向への動きを警告することができます。したがって、シグナル矢印を利用してエントリーし、反対側の矢印でエグジットすることもできますし、反対側のシグナルを利用して既存の取引を終了することもでき、利益を追うことができます。矢印は素晴らしいエントリーシグナルであり、印刷された後に再描画されたり、薄くなったり、どのような形でも変化することはありません。すべてのタイムフレームで機能し、スキャルパーとスイングトレーダーの両方に効果的です。たとえあなたが初心者トレーダーであっても、"小さな損失と大きな勝利 "というシンプルかつ非常に強力な原則に従うため、利益を上げることができます。それは、市場がトレンドにあるとき、市場の正しい方向にあなたを保つ
MTF Optimal Trailing TP インジケータは、Optimal Trailing Take Profit と全く同様に機能しますが、シグナルを矢印の代わりにバーで表示し、同時に2つの異なるタイムフレームで表示されます。 これは、エントリーツールとテイクプロフィットの両方として機能することができます。私たちは、このツールをエントリーツールとテイクプロフィットツールの両方として使用しています。   最適な使い方は以下の通りです。 アルティメット・スナイパー・ダッシュボードを使い、高い時間枠の動きを探す。 低い時間枠で行って、高い時間枠の方向だけにツールを使ってエントリーする。こうすることで、偽の動きをスキップして、市場から簡単にお金を稼ぐことができます。   このMTFバージョンは2つのタイムフレームを持ち、両方のタイムフレームのシグナルを同時に表示することができます。フルカスタマイズが可能で、入力設定からタイムフレームを設定することができます。 もう一つの使い方は、連続する2つのタイムフレームに同時に設定することです。例えば、1分足と5分足です。 例えば
このカスタムアルティメットスナイパーダッシュボードは、オリジナルのアルティメットスナイパーダッシュボードインジケーターをEAでアップグレードしたものです。最大98種類のアルゴリズムで動作し、使用する資産クラスのトレンドの本質を確実に捉えます。 数ヶ月に渡り、多くのお客様から頂いたご提案やアドバイスに直接お応えしたものです。   このカスタムバージョンは、完全にカスタマイズ可能です。 98の独立したカスタムアルゴリズムによって支えられています。 非常に素晴らしいビジュアルインターフェースなので、どのペアやタイムフレームでも、簡単かつ自信を持って市場全体の動向を追うことができます。 テレグラムにリアルタイムのアラートを送ることができます。 取引するペアに応じた独自のインデックスを作成することができます。 携帯電話にリアルタイムでアラートを送ることができるので、PCの前にいなくても動きがあることを知ることができます。 入力設定から8つの指標を設定することができます。 アラートを受信する指標と時間枠を設定することができます。 インターネット接続が検出されなかった場合、アラ
Click Trade Manager
Hispraise Chinedum Abraham
5 (1)
クリック・トレード・マネージャーは、これまでで最高の製品です! ビギナーからプロップファームのトレーダーまで、最高のソリューションです。 FTMO/MFFプロップファームまたは個人口座をドローダウン限界突破から保護します。EAは自動的にすべての取引を終了させるので、ドローダウンの限界に達することはありません。 ドローダウンリミットを超える可能性がある取引は警告されます。 利益目標が達成されると、自動的に取引を終了します。 ブローカーからマジックナンバーを隠すように設定することができます。 1クリックでリスクを計算し、SLとTPで取引を行うことができます。 ストップとリミットオーダーを1クリックで発注 1クリックで各取引に異なるSLとTPで複数のFibレベルの取引を設定。 パーシャルを取る、SLをBEに移動、すべてのオープントレードをクローズ、すべての保留中のオーダーをキーボード上のキーを押すだけで削除。 あらかじめ設定された時間にすべてのトレードをクローズします。 テレグラムに全トレードのアラートを送信します。 高度にカスタマイズ可能 - あなたの取引スタ
ワールストリートの「ウワナビー」になりすぎて、トレードを絶えず疑っていますか?それなら、水晶玉を置いて、「Current Support and Resistance」インジケーターを使って21世紀に歩み出しましょう!この素晴らしいインジケーターはあなたの信頼できるサイドキックになり、シェルロック・ホームズも羨むような深さで市場を分析します。 それだけでなく、このインジケーターは選択肢もたくさん持っています。1分足チャートで抵抗線とサポート線を見たいですか?できます。週足チャートも?できます。そして最高の部分は何でしょうか?カラースキームを選ぶことができます。だって、誰が毎日退屈な青と赤を見たがるでしょう?「Current Support and Resistance」インジケーターを使って、トレーディングにスタイルを加えましょう。 だから、ミスされた機会の日々をさようならして、収益的なトレードの世界にようこそ。「Current Support and Resistance」インジケーターを今すぐ手に入れて、あなたのトレーディングスキルと同じ速さであなたの口座が成長するのを見てください
Draw on chart MT4
Hispraise Chinedum Abraham
チャート上で描画するインジケーターをご紹介します:チャート上で創造力を解放しましょう! トレードチャートに注釈をつけるのに苦労して、分析を理解したりアイデアを効果的に伝えるのに苦労していませんか?それならお探しのものはこちらです!私たちは、チャート上で簡単に描画や注釈をすることができる画期的なツール、「チャート上で描画するインジケーター」をご紹介できることを喜んでいます。わずか数回のクリックやペンのストロークで、あなたのチャートに直接描画や注釈を追加できます。 私たちの革新的なチャート上で描画するインジケーターは、チャート体験を向上させ、あなたの創造力の可能性を引き出すことを目指しています。この強力なツールを手にすれば、思考を簡単に表現し、重要な水準を示し、パターンを強調表示し、トレード戦略を視覚的に表現することができます。経験豊富なトレーダー、テクニカルアナリスト、またはトレーディングの魅力的な世界を探求する初心者であっても、チャート上で描画するインジケーターは、チャートとの対話方法を根本から変える非常に価値のあるツールです。 主な特徴: 使いやすいインターフェース
現在、ホリデーディスカウントで399ドル! 今後値上がりする可能性があります。以下の説明をお読みください。  Ultimate Dynamic Levelsの紹介 - Ultimate Sniper DashboardのBESTエントリーインジケーター! 極めてローリスクなタイムリーエントリーと高RR!!! アルティメットスナイパーダッシュボードはこちら。 初心者はもちろん、プロのトレーダーにとっても最も重要な能力は、いつどこで相場が転換するかを正確に判断し、いかに安全に参入し、利益を得て退場するかを見極めることです。 アルティメット・ダイナミック・レベルズ・インディケーターは、相場が転換する可能性が最も高い場所を簡単に教えてくれるので、極めてローリスクなトレードを自信を持って行うことができ、同時にチャートをクリーンでシンプルに保ちながら、$$$を稼ぐことができるのです! アルティメット・ダイナミック・レベルズ・インディケーターは、複数の時間枠で重要な隠れたレベルを一度に見つけるユニークで強力なアルゴリズムを持っています。また、他の典型的なSRインジケーターのように、レ
クリック・トレード・マネージャーは、これまでで最高の製品です! ビギナーからプロップファームのトレーダーまで、最高のソリューションです。 FTMO/MFFプロップファームまたは個人口座をドローダウン限界突破から保護します。EAは自動的にすべての取引を終了させるので、ドローダウンの限界に達することはありません。 ドローダウンリミットを超える可能性がある取引は警告されます。 利益目標が達成されると、自動的に取引を終了します。 ブローカーからマジックナンバーを隠すように設定することができます。 1クリックでリスクを計算し、SLとTPで取引を行うことができます。 ストップとリミットオーダーを1クリックで発注 1クリックで各取引に異なるSLとTPで複数のFibレベルの取引を設定。 パーシャルを取る、SLをBEに移動、すべてのオープントレードをクローズ、すべての保留中のオーダーをキーボード上のキーを押すだけで削除。 あらかじめ設定された時間にすべてのトレードをクローズします。 テレグラムに全トレードのアラートを送信します。 高度にカスタマイズ可能 - あなたの取引スタ
Draw on chart MT5
Hispraise Chinedum Abraham
チャート上で描画するインジケーターをご紹介します:チャート上で創造力を解放しましょう! トレードチャートに注釈をつけるのに苦労して、分析を理解したりアイデアを効果的に伝えるのに苦労していませんか?それならお探しのものはこちらです!私たちは、チャート上で簡単に描画や注釈をすることができる画期的なツール、「チャート上で描画するインジケーター」をご紹介できることを喜んでいます。わずか数回のクリックやペンのストロークで、あなたのチャートに直接描画や注釈を追加できます。 私たちの革新的なチャート上で描画するインジケーターは、チャート体験を向上させ、あなたの創造力の可能性を引き出すことを目指しています。この強力なツールを手にすれば、思考を簡単に表現し、重要な水準を示し、パターンを強調表示し、トレード戦略を視覚的に表現することができます。経験豊富なトレーダー、テクニカルアナリスト、またはトレーディングの魅力的な世界を探求する初心者であっても、チャート上で描画するインジケーターは、チャートとの対話方法を根本から変える非常に価値のあるツールです。 主な特徴: 使いやすいインターフェース
フィルタ:
レビューなし
レビューに返信