Guarda i video tutorial del Market su YouTube
Come acquistare un Robot di Trading o un indicatore
Esegui il tuo EA
hosting virtuale
hosting virtuale
Prova un indicatore/robot di trading prima di acquistarlo
Vuoi guadagnare nel Market?
Come presentare un prodotto per venderlo con successo
Nuovi indicatori tecnici per MetaTrader 4 - 25

Love Trend indicator showing buy and sell areas. The indicator follows the price movement around the opening price. It also displays information about the trend following the breakout of the low and high. The indicator has a very simple but effective graphic: an orange dot is displayed above the open price, and a blue dot is displayed below the open price. The indicator also includes an audible alert and a pop-up window to alert you when the candle closes at these important levels. The indicator

The ICT Concepts indicator regroups core concepts highlighted by trader and educator "The Inner Circle Trader" (ICT) into an all-in-one toolkit. Features include Market Structure (MSS & BOS), Order Blocks, Imbalances, Buyside/Sellside Liquidity, Displacements, ICT Killzones, and New Week/Day Opening Gaps. It’s one kind of Smart money concepts. USAGE: Please read this document ! DETAILS Market Structure Market structure labels are constructed from price breaking a prior extreme

Forex indicator "Search for a reversal" is a technical tool designed for traders involved in scalping in the Forex currency market. Scalping is a trading strategy that aims to make small profits from frequent trades on short-term time frames. The "Search for a reversal" indicator helps traders identify the best entry and exit points in the market, taking into account short-term trends and price fluctuations. The main purpose of the "Search for a reversal" indicator is to provide traders with th
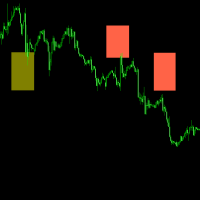
The indicator is very effective in currency exchange, for example EURUSD GBPUSD AUDUSD NZDUSD USDCHF USDCAD and it is very easy to identify the position of top and bottom. Suggest using it on the MT4 platform of SwissQuote Bank.
SwissQuote Link: https://trade.swissquote.ch/signup/public/form/full/fx/com/individual?lang=cn&partnerid=daf9af43-2f95-443e-86c5-89ce1ab2bd63#full/fx/com/individual/step1
Exness Link: https://one.exness.link/a/t2v0o2v0
With a little understanding of trading and the
FREE

Introducing Round Range 5, a versatile and dynamic indicator designed to optimize your trading strategies on MT4. Let's explore how this indicator can revolutionize your trading experience by adapting round number levels to suit the unique characteristics of each instrument.
In the fast-paced world of financial markets, round numbers play a crucial role. These price levels, ending with multiple zeros or other significant digits, often act as psychological barriers that influence market sentim
FREE

This indicator is based the principle of breakout candle. Every candle that breaks out from the cluster may not lead to a rally. There are various factors that determine how a breakout candle will behave. This indicator calculates all those factors to suggest BUY/SELL signal once a breakout happens. This is a universal indicator that can work for all kind of instruments eg stock, currency, oil, crypto etc. This also works in every timeframe. PARAMETERS ================= move = 20 strongCandle =

Introducing the Gold Multiply Funds EA - a revolutionary trading tool that is based on the powerful principle of compounding. MT4 Version : https://www.mql5.com/en/market/product/90177
MT5 Version : https://www.mql5.com/en/market/product/95784
Brief description EA for XAUSUD: AI & machine learning detect/respond to market trends with precision. Trading Strategy Advanced pattern recognition using AI and Machine learning for profitable trades 65-70% correct prediction accuracy in 10
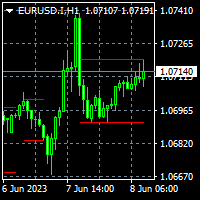
To get access to MT5 version please contact via private message. This indicator is not a standard indicator and you may get into trouble installing it. Please contact via private chat if you face trouble. This is exact conversion from TradingView: "Consolidation Zones - Live" by "LonesomeTheBlue". This is a light-load processing indicator. Updates are available only upon candle closure. Buffers are available for processing in EAs. It is a repaint indicator. So previous buffer values do not repre
Market screener: Spread and Swap, for selected Symbols. You can customize the list: set only the Symbols (currency pairs) that are needed. The number of Symbols is unlimited. The list can be sorted in ascending or descending order (Symbol name). The panel can be moved to any place on the chart. You can also minimize the panel. Displayed values: Current market price (BID); Spread size; Swap, for Long positions; Swap, for Short positions; Overall P/L of the entire account; My #1 Utility : includ

TrendXplorer indicator is designed to provide valuable insights into market trends, helping you navigate the dynamic world of trading with confidence. Key Features: Accurate Trend Analysis: TrendXplorer utilizes a special algorithm to analyze trends combined with price action. This enables easier trend detection and is less prone to change during price manipulation. Built-in Risk Calculator: Take control of your risk management with TrendXplorer's built-in risk calculator. This feature assesses

TruRange is a Next-Level trend and range detection created from algorithms based on price action. No other indicator apart from ATR is used in the computing of the main line indicator
It separates Trending and Ranging market conditions without any lag. It's good to separate mean reverting strategies from trending/breakout strategies.
Settings : Bars : number of bars to compute Sensitivity : a lower value will have longer range periods while a higer value will have more smaller ranging peri

Dynamic Price Volatility Indicator (DPVI)
The Dynamic Price Volatility Indicator (DPVI) is designed to provide traders with valuable insights into market volatility and potential price movements. It combines elements of volatility analysis and trend identification to assist traders in making informed trading decisions.
Features: Dynamic Volatility Bands: utilizes a proprietary algorithm to calculate dynamic volatility bands that adjust in real-time based on market conditions. These bands act
FREE
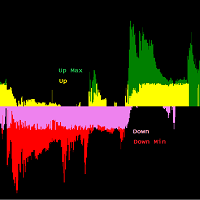
Trend Reversal Identifier es un indicador de análisis profundo que no repinta de alto rendimiento que sirve para detectar y confirmar Pullbacks, Soportes y Resistencias. También posee un alto valor para detectar divergencias al tener los movimientos alcista y bajistas dados por separado con mucha claridad. Debido a la estructura implícita del algoritmo es plenamente válido para cualquier par/periodo y no necesita configuración. Tenemos dos zonas principales: Zona Up y Zona Down, las cuales a s

Currency Strength Wizard è un indicatore molto potente che ti fornisce una soluzione all-in-one per un trading di successo. L'indicatore calcola la potenza di questa o quella coppia forex utilizzando i dati di tutte le valute su più intervalli di tempo. Questi dati sono rappresentati in una forma di indice di valuta facile da usare e linee elettriche di valuta che puoi utilizzare per vedere il potere di questa o quella valuta. Tutto ciò di cui hai bisogno è collegare l'indicatore al grafico che

TPSpro TRENDPRO - is a trend indicator that automatically analyzes the market and provides information about the trend and each of its changes, as well as giving signals for entering trades without redrawing! The indicator uses each candle, analyzing them separately. referring to different impulses - up or down impulse. Exact entry points into transactions for currencies, crypto, metals, stocks, indices! - Version MT5 DETAILED DESCRIPTION R ecommended to use with

Presentazione dell'indicatore Hull Crossover Alert per MT4, un potente strumento progettato per migliorare le tue decisioni di trading. Questo indicatore utilizza la media mobile dello scafo (HMA) e incorpora funzionalità avanzate per filtrare i falsi segnali e fornire avvisi rapidi e affidabili.
Con l'indicatore Hull Crossover Alert, puoi beneficiare delle caratteristiche uniche della media mobile dello scafo. La sua reattività alle variazioni di prezzo e la curva uniforme ti aiutan
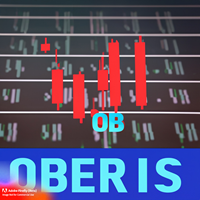
Vuoi migliorare il tuo trading con un indicatore di blocchi di ordini? I blocchi di ordini sono aree del mercato in cui si accumulano ordini di acquisto o vendita che possono causare cambiamenti di tendenza o forti movimenti. L'identificazione di questi blocchi di ordini può essere molto utile per trovare opportunità di ingresso e uscita, nonché per gestire rischi e profitti. Ma trovare questi blocchi di ordini manualmente può essere difficile e noioso. Ecco perché abbiamo creato Oberis, un indi

Pips forex - is a ready trading system . This indicator shows with arrows on the chart when and in what direction you need to open an order. If the arrow is green, then we open a buy deal, and if the arrow is red, then we open a sell deal. Everything is very simple and quite effective. TakeProfit set 15-25 points. StopLoss set at the level of points. When the dots move, we immediately override the StopLoss. Recommended timeframe for trading M1 and M5. This is a scalping strategy and works best
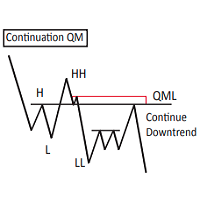
Custom Mapping Tool by Shredderline is an innovative MT4 indicator that simplifies the process of marking and mapping charts. With this tool, you no longer have to waste time rewriting repetitive words, rectangles, and trendline colors every time. New Feature V5.60:
Draw path - Same as the TV Path drawing mode, which is very useful for naked chart trader. You can draw zigzag, draw your patterns manually. Change style in indicator setting. Crop function disabled by default. Can be enabled and s
FREE
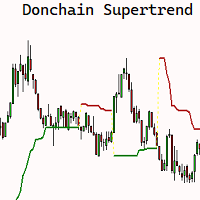
L'indicatore SuperChannel per MQL4 è un POTENTE strumento di ANALISI TECNICA progettato per aiutarti a prendere decisioni di trading informate. Basato sulla popolare TECNOLOGIA di indicatore SUPERTREND, questo indicatore offre un approccio UNICO Utilizzando MASSIMI e MINIMI a n periodi invece dell'Average True Range (ATR) per costruire la linea. L'indicatore SuperChannel ti consente di identificare facilmente le tendenze del mercato e di individuare i punti di ingresso e di uscita ottimali per l

The MAtrio indicator displays three moving averages on any timeframe at once with a period of 50-day, 100-day, 200-day. After attaching to the chart, it immediately displays three moving averages with the parameters of simple (SMA) moving average SmoothingType50 , simple (SMA) moving average SmoothingType100 , simple (SMA) moving average SmoothingType200 . Accordingly, with the price type ValuePrices50, ValuePrices100, ValuePrices200 , by default, the price is Close price everywhere. All parame
FREE

Welcome to the world of advanced trading with the RSI Multicurrency Scanner! Maximize your trading experience with our powerful MT4 indicator designed for seamless analysis and real-time insights. Key Features: Effortless RSI Scanning: Unlock the full potential of the RSI Multicurrency Scanner by effortlessly scanning multiple currency pairs. Receive instant alerts when specific Relative Strength Index (RSI) conditions are met, ensuring you stay ahead of market movements. Comprehensive Dashboar

"TOP G ARROWS" shows price reversal points designed for scalping and intraday trading.
Contains internal reversal filters (ATR, HHLL, RSI). Can be used on all time frames and trading instruments. Can be used on M1, M5, M15 time frames for scalping or M30, H1, H4 for intraday trading, Recommended for M30 and H1. The arrows are built on candle close (appears on previous bar at the open of the new candle)

If you have been anywhere near Forex forums or social media lately, you have no doubt been hearing people talk about Smart Money Concepts (SMC) trading. You may be wondering what SMC is, and whether it deserves all the hype. In this post, we will introduce Smart Money Concepts trading to you so you can make an informed decision about whether or not to give this strategy a try in your own trading. What is SMC Forex trading? Smart Money Concepts (SMC) is one of many forex trading methods. SMC

Automated Supply and Demand Trading Edge MT4 These videos demonstrate how we apply the supply and demand system to our latest trading review and market analysis. US Tech 100 Index Trade Setup time laps 12/6/2023. https://youtu.be/zHdjHnr3GNo https://youtu.be/JJanqcNzLGM , https://youtu.be/l70MIHaQQa4 , https://youtu.be/pg0oiT5_8y0 Enhance your Trading Strategy with the Supply and Demand Trading Edge MT4. Gain a competitive market advantage with the Supply and Demand Trading Edge MT4

The indicator has been designed to function on any time-frame and any pair. This regime filter will help the trader better evaluate whether the current market is trending, and in which direction. It quickly reacts to changes in market dynamics using a series of advanced calculations. The user is able to select whether the calculation remains standard, or if a further filter constraint is added to the calculation. A Yellow moving average of the signal has been included for the trader to smoot
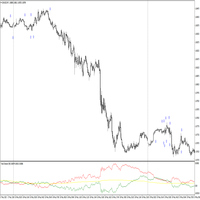
The indicator has been designed to function on any time-frame and any pair, although it is best suited for 5-minute charts. This trend filter will help the trader better evaluate whether the current market is trending, and in which direction. A dynamic filter threshold has been added to help the trader avoid choppy market conditions, and add greater confidence when entering, with an added functionality of plotting signal arrows on the chart to aid in detecting possibly entries. The Yellow in
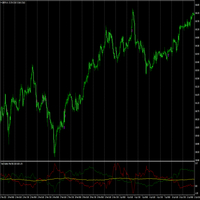
The indicator has been designed to function on any time-frame and any pair, although it is best suited for currency pairs on 5-minute charts, and used in conjunction with the Trend Direction Filter Indicator . This trend volatility filter will help the trader better evaluate whether the current market is trending, and in which direction. A dynamic filter threshold has been added to help the trader avoid choppy market conditions, and add greater confidence when entering, with an added functiona
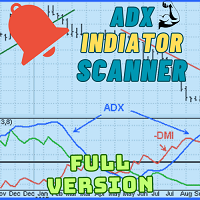
Welcome to advanced trading with the ADX Multicurrency Scanner! Elevate your trading experience with our powerful MT4 indicator, designed for seamless currency scanning and real-time insights. Key Features: Effortless Multicurrency Scanning: Unlock the full potential of the ADX Multicurrency Scanner by effortlessly scanning multiple currencies. Receive instant alerts when specific conditions are met, ensuring you stay ahead of the market and capitalize on every trading opportunity. Comprehensiv

Unleash the Power of Repetitive Market Price Levels (Markets often repeat structure ).
Are you tired of guessing the crucial support and resistance levels in your trading strategy? Do you want to enhance your decision-making process with reliable and accurate market insights? Look no further! We proudly present the interactive digital product designed to transform your trading experience – the Ultimate Support and Resistance Zones Indicator.
Unlock the Potential of Critically Watched Sup
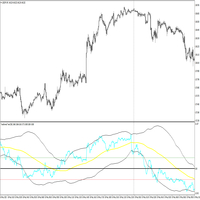
The indicator has been designed to function on any time-frame and any pair, although it is best suited for 5-minute charts. This price transformation will help the trader better evaluate whether the current market is trending, and in which direction. A dynamic filter has been added to help the trader avoid possibly entering against the trend. Two filter threshold lines may enable the trader to avoid choppy or flat market conditions. The Yellow indicator line is the filter and the Blue indica
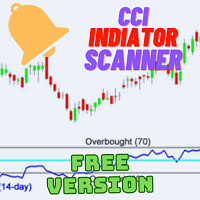
Introduction: Welcome to the world of advanced trading tools! Introducing the CCI Multicurrency Scanner, an exceptional MT4 indicator designed to revolutionize your trading experience. With its powerful features and comprehensive insights, this tool will empower you to make informed decisions and maximize your profitability. Features: Efficient Multicurrency Scanning: Our CCI Multicurrency Scanner swiftly scans multiple currencies based on your inputs. Receive instant alerts when specific condit
FREE
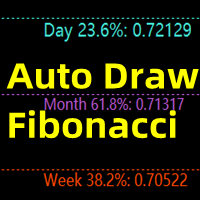
This indicator is mainly used to analyze future support and resistance levels for better trade analysis.
If the support level is effectively supported for many times, the market will break through the previous high point, and the effective trend breakout will be long.
After the down, the market cannot overshoot the pressure level for many times, and then goes down and breaks through the previous low price again, and the effective trend breaks through the short position.
When the marke

Thanks to this indicator, you can easily see the new ABCD harmonic patterns in the chart.
If the two price action lengths are equal, the system will give you a signal when it reaches the specified level.
You can set the limits as you wish. For example, You can get the signal of the price, which occurs in the Fibonaci 38.2 and 88.6 retracements, and then moves for the same length, at the level you specify. For example, it will alarm you when the price reaches 80% as a percentage.
In vertic
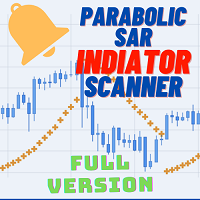
Welcome to the world of advanced trading with the Parabolic SAR Scanner Full! Maximize your trading experience with our powerful MT4 indicator designed for seamless analysis and real-time insights. Key Features: Effortless Parabolic SAR Scanning: Unlock the full potential of the Parabolic SAR Scanner Full by effortlessly scanning multiple currency pairs. Receive instant alerts when specific Parabolic SAR conditions are met, ensuring you stay ahead of market movements. Comprehensive Dashboard In
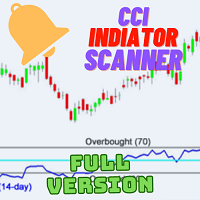
Welcome to the world of advanced trading with the CCI Multicurrency Scanner! Elevate your trading experience with our powerful MT4 indicator designed for seamless analysis and real-time insights. Key Features: Effortless CCI Scanning: Unlock the full potential of the CCI Multicurrency Scanner by effortlessly scanning multiple currency pairs. Receive instant alerts when specific Commodity Channel Index (CCI) conditions are met, ensuring you stay ahead of market movements. Comprehensive Dashboard

The Time Segmented Volume (TSV) is a technical indicator that measures the volume of a financial instrument within specific time segments. It helps traders identify buying and selling pressure based on volume analysis. The TSV indicator can be used as part of a trading strategy to generate trade signals and confirm market trends. Let's explore how to use the TSV indicator as a trading strategy. To begin, add the TSV indicator to your trading platform. The TSV is typically represented as a line o

The Chaikin Oscillator is a technical indicator developed by Marc Chaikin that combines price and volume data to measure the accumulation and distribution of a financial instrument. It aims to identify potential buying and selling opportunities in the market. The Chaikin Oscillator is calculated by subtracting a 10-day exponential moving average of the Accumulation Distribution Line (ADL) from a 3-day exponential moving average of the ADL. Here's how to use the Chaikin Oscillator indicator in tr

Indicator show best signals for buy and sell orders. Indicator uses only 2 inputs: DEMA Fast Period - fast double exponential moving average period DEMA Slow Period - slow double exponential moving average period Crossings of fast and slow double double exponential moving averages shows buy and sell signals, which are drawn as green and magenta arrows respectively.

Indicator show best signals for buy and sell orders. Indicator uses only 3 inputs: DEMA Fast Period - fast double exponential moving average period DEMA Slow Period - slow double exponential moving average period DEMA Trend Period - trend double exponential moving average period
Position of price according to trend double double exponential moving average and crossings of fast and slow double double exponential moving averages shows buy and sell signals, which are drawn as gree

Indicator show best signals for buy and sell orders. Indicator uses only 2 inputs: PEMA Bounce Period - bounce percentage exponential moving average period PEMA Confirm Period - confirm percentage exponential moving average period Positions of price according to bounce and confirm percentage exponential moving averages and directions of bounce and confirm percentage exponential moving average shows buy and sell signals, which are drawn as green and magenta arrows respectively.
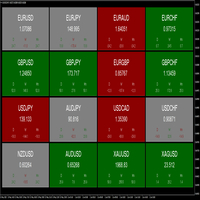
The dashboard indicator has been designed to quickly show the trader the price movements of various currency pairs. The user is able to select 3 different timeframes to analyse. When the pip difference for each respective timeframe is either positive or negative, the pair block will be coloured green or red respectively. This allows the trader to view which timeframes are in agreement, as well as the pip movements therein. A good visual tool to view multiple pairs and timeframes at once. T
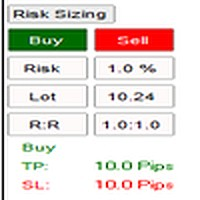
The indicator has been designed to function on any time-frame and any pair. The user is able to input their desired risk percentage per trade based on their account size, and choose whether they wish to calculate risk based on a limit order or market order. When initialised, a non-invasive button will appear on the left-hand side of the chart. Upon selection, a drop down will appear with a Buy and Sell button, these will in turn place movable lines on the chart that are used to appropriately
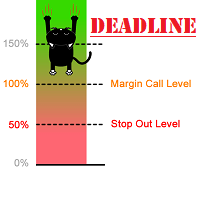
The indicator can display Stop Out, Free Margin and Margin Call lines on the chart. Y ou can also set your own line at the custom level.
Displaying these lines on the chart is especially useful for people who trade with high leverage or go all-in, where the risk is very high. You can adjust the line color, style, thickness and visibility ( for each one separately). The last parameter that can be changed is the refresh interval. If you have open orders on several stocks, the line levels will c

Discover PM - Your Ultimate Precision Forex Indicator for Informed Trading Decisions! In the fast-paced and ever-changing world of Forex trading, having a reliable and accurate indicator can make all the difference between success and missed opportunities. Say hello to PM, the revolutionary Precision Momentum indicator, engineered to empower traders with unparalleled insights into market dynamics, volatility, and trends. At the heart of PM's power lies its ability to precisely identify moments
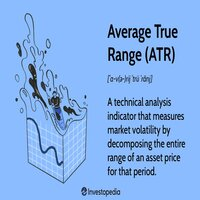
The "Wilder's Average True Range (ATR)" tool is used to measure the volatility of a financial instrument. It was developed by J. Welles Wilder Jr. and is commonly used by traders to assess the potential price range and volatility of an asset. The ATR indicator provides valuable information for setting stop loss levels, determining position sizes, and identifying potential breakouts. Here's how to use the "Wilder's Average True Range (ATR)" tool: Install the indicator: Add the ATR indicator to yo

Presentazione Quantum Breakout PRO , l'innovativo indicatore MQL5 che sta trasformando il modo in cui scambi le zone di breakout! Sviluppato da un team di trader esperti con un'esperienza di trading di oltre 13 anni, Quantum Breakout PRO è progettato per spingere il tuo viaggio di trading a nuovi livelli con la sua strategia innovativa e dinamica della zona di breakout.
Quantum Breakout Indicator ti fornirà frecce di segnalazione sulle zone di breakout con 5 zone target di prof

Il Catturatore di Tendenza:
La Strategia del Catturatore di Tendenza con Indicatore di Allarme è uno strumento versatile di analisi tecnica che aiuta i trader a identificare le tendenze di mercato e i potenziali punti di ingresso e uscita. Presenta una Strategia dinamica del Catturatore di Tendenza, adattandosi alle condizioni di mercato per una chiara rappresentazione visiva della direzione della tendenza. I trader possono personalizzare i parametri in base alle loro preferenze e tolleranza
FREE
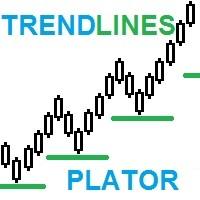
TrendLines Plator: Potenzia le tue Strategie di Trading con un Avanzato Indicatore di Proiezione delle Tendenze Esplora il potenziale del nostro indicatore innovativo! Con la capacità di analizzare e proiettare le linee di tendenza di time frame più ampi direttamente sul tuo intervallo di tempo attuale, offre un supporto strategico che cattura l'attenzione dei trader in generale. Questi punti diventano livelli strategici di supporto o resistenza per le tue operazioni, rafforzando la tua strategi

Tendenceris - Indicatore di Tendenza per MT4 Tendenceris - Migliora le tue abilità di trading! Con questo eccellente indicatore per MetaTrader 4, puoi monitorare le tendenze su diversi timeframe in tempo reale. Non perdere opportunità di trading! Caratteristiche principali: Monitoraggio e visualizzazione delle tendenze su diversi timeframe, da 1 minuto a 1 giorno. Interfaccia utente intuitiva che mostra chiaramente le informazioni di tendenza sul grafico. Aggiornamento in tempo reale per fornire
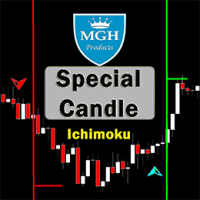
Candela speciale
Vuoi utilizzare uno dei migliori indicatori Forex con una strategia Ichimoku di successo? Puoi utilizzare questo fantastico indicatore che si basa sulla strategia Ichimoku.
La versione MT5 è qui
Prima strategia:
Questa strategia prevede l'individuazione di incroci forti simili che raramente si verificano.
I migliori time frame per questa strategia sono 30 minuti (30M) e 1 ora (H1).
I simboli appropriati per il time frame di 30 minuti includono:
• CAD/JPY
• CHF/JPY
•
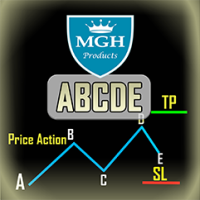
ABCDE indicator
This indicator is based on the primary abc patterns of price action (i.e. break, pullback, movement). These patterns resemble the rally base rally pattern, and a set of analyzes, such as trend analysis and divergence analysis, are checked to issue the accurate signal. It will provide pretty accurate trading signals and tell you when it's best to open and close a trade. It can be applied to any financial asset: forex, cryptocurrencies, metals, stocks, indices.
MT5 version is
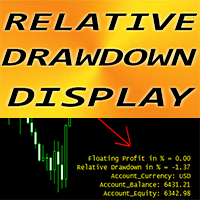
Forex Indicator "Relative Drawdown Display" for MT4 , Trading Support tool. This is MUST HAVE indicator for traders who use grid trading systems !!! Relative Drawdown Display indicator shows current Relative DD or Floating Profit in % on your account. PC and Mobile Alerts are built-in with adjustable Trigger level Indicator also indicates account Balance and Equity It is possible to locate indicator values in any corner of the chart : 0 - for top-left corner, 1 - top-right, 2 - bottom-le

Vi presentiamo l'indicatore Donchian Channels per MQL4, uno strumento potente di analisi tecnica progettato per aumentare il successo delle vostre operazioni. Questo indicatore è composto da quattro linee che rappresentano i limiti superiori e inferiori del movimento dei prezzi in un periodo specificato. Con l'indicatore Donchian Channels potete facilmente individuare potenziali rotture e inversioni di tendenza sul mercato. La linea superiore mostra il massimo più alto del periodo specificato, m

The Breaker Blocks with Signals indicator aims to highlight a complete methodology based on breaker blocks. Breakout signals between the price and breaker blocks are highlighted and premium/discount swing levels are included to provide potential take profit/stop loss levels.
This script also includes alerts for each signal highlighted.
SETTINGS
Breaker Blocks
Length: Sensitivity of the detected swings used to construct breaker blocks. Higher values will return longer te

An extremely convenient indicator that truly makes the process of making money on the exchange easy. It is based on the scientifically rigorous theory of the market developed by the author, the beginning of which is presented here . The full algorithm of this indicator operation is presented in the article . The indicator calculates the most probable price movement trajectory and displays it on the chart. Based on the predicted price movement trajectory

*This is tradingview bot converted to mql4*
The UT Bot Alert Indicator is an advanced technical analysis tool designed to help traders optimize their trading performance. This innovative indicator is based on the proven UT Bot system, which utilizes multiple indicators to deliver accurate signals that can help traders make better decisions. The UT Bot Alert Indicator provides a range of features that can help you stay on top of market trends and capitalize on opportunities. Here are some of i
FREE

Urgent reminder> Only 13 copies remaining for the price to double on all renting options. Get your copy Today!
Introduction Dear Traders, I am always working to come up with tools that may help you to become a better trader and investor. Due to my experience in trading and market analysis and trading software design and development, I am glad to introduce to you my other tool called " Amazing Entries Indicator ". The Indicator is designed in a way that it combines different strategy to provide

Smoothed oscillator based on basic DeMarker indicators. Shows the volatility of the price direction. Can be used to determine intraday entry and exit points from the market.
Suitable for use on all time frames and trading instruments. It is recommended to use on M5, M15 and M30.
The green line shows the price direction up, the blue line shows the price direction down. The red line is a smoothed representation of the price. Input parameters
Period - Period of the main indicator DeMarker
FREE

The standard RSI indicator is very helpful in identifying overbought or oversold areas during a flat, but gives a lot of false signals when the market is trending. For example: during an uptrend, the standard indicator often enters the "oversold" zone and extremely rarely (most often, when the trend has already ended) enters the "overbought" zone. This indicator takes into account the trend movement and, with the selected settings, can enter the zone opposite to the trend direction, giving a sig
FREE

A popular signal indicator marking buy/sell points. In this version, it is supplemented with optimal SL points. Recommended for use in conjunction with a trend indicator to filter signals. The indicator has only one adjustable parameter that determines its sensitivity, which greatly simplifies setting the indicator to the current market and the user's trading style. Indicator signals are given only after the full formation of the bar. The indicator can be used to trade any market. Its basic para
FREE
The indicator displays in the form of a histogram the difference between the current price and the price for the previous period. A similar method of market analysis is used in the classic Momentum indicator. At the same time, the presented indicator uses the primary data smoothing by the Laguerre filter, which allows maintaining the sensitivity of the indicator and minimizing the "noise". The indicator signals are: Histogram crossing 0. Change of signal line direction.
FREE
The indicator determines entry points basing on data of the Stochastic indicator. When the indicator crosses the zero line, the trend is changed. If the oscillator's value is 1.5 - the price grows, the trend remains; If the oscillator's value is 0.5 - the price grows, the trend is absent; If the oscillator's value is -1.5 - the price falls, the trend remains; If the oscillator's value is -0.5 - the price falls, the trend is absent; The best entry moment is crossing the High/Low of the bar where
FREE

Everything is very simple here. I have never understood indicators without external parameters. And the Awesome Oscillator is no exception. Now you can customize this indicator to suit your needs and strategies.
Reference: The Awesome Oscillator indicator shows the distance in points between two moving averages (fast and slow).
The AO_Robex indicator has in its parameters a change in the period of moving averages. The default parameters are the same as in the standard indicator.
FREE
The indicator identifies the strength of the trend based on the points where the RSI indicator exceeds the overbought and oversold levels. The indicator does not redraw. This indicator:
Suitable for all markets; Not redrawn; Intuitive and simple; It can be useful for both beginners and experienced traders; Allows you to identify market entry points where there is a high probability of a significant price movement sufficient for a successful transaction; Settings: Ind_Period (>1) - period of
FREE
The indicator identifies the strength of the trend based on the points where the WPR indicator exceeds the overbought and oversold levels. The indicator does not redraw. This indicator:
Suitable for all markets; Not redrawn; Intuitive and simple; It can be useful for both beginners and experienced traders; Allows you to identify market entry points where there is a high probability of a significant price movement sufficient for a successful transaction; Settings: Ind_Period (>1) - period of
FREE
The indicator identifies the strength of the trend based on the points where the CCI indicator exceeds the overbought and oversold levels. This indicator: Suitable for all markets; Not redrawn; Intuitive and simple; It can be useful for both beginners and experienced traders; Allows you to identify market entry points where there is a high probability of a significant price movement sufficient for a successful transaction; Settings: Ind_Period (>1) - period of the indicator; Price - price f
FREE

The standard RSI indicator is very helpful in identifying overbought or oversold areas during a flat, but gives a lot of false signals when the market is trending. For example: during an uptrend, the standard indicator often enters the "oversold" zone and extremely rarely (most often, when the trend has already ended) enters the "overbought" zone. This indicator takes into account the trend movement and, with the selected settings, can enter the zone opposite to the trend direction, giving a sig

*This is TradingView indicator converted to mql4*
The SuperTrend V indicator is a popular technical analysis tool used to identify trends and potential trend reversals in financial markets. It is based on the concept of the SuperTrend indicator but incorporates additional features and variations. The SuperTrend V indicator uses a combination of price action and volatility to determine the trend direction and generate trading signals. Here are the key components and features of the indicator:
FREE

Was: $69 Now: $34 Blahtech VWAP - Volume Weighted Average Price (VWAP) is the ratio of price to total volume. It provides an average price over a specified time interval. Links [ Install | Update | Documentation ] Feature Highlights
Configurable VWAP Line Sessions, intervals, anchored or continuous Previous day settlement line Standard Deviation bands Alerts at bar close or real time Automatic Broker or Tick volumes Significantly reduced CPU usage
Input Parameters
Expert Advis
Sai perché MetaTrader Market è il posto migliore per vendere strategie di trading e indicatori tecnici? Non c'è bisogno di pubblicità o di protezione del software, nessun problema di pagamento. Tutto ciò è fornito da MetaTrader Market.
Ti stai perdendo delle opportunità di trading:
- App di trading gratuite
- Oltre 8.000 segnali per il copy trading
- Notizie economiche per esplorare i mercati finanziari
Registrazione
Accedi
Se non hai un account, registrati
Consenti l'uso dei cookie per accedere al sito MQL5.com.
Abilita le impostazioni necessarie nel browser, altrimenti non sarà possibile accedere.