YouTubeにあるマーケットチュートリアルビデオをご覧ください
ロボットや指標を購入する
仮想ホスティングで
EAを実行
EAを実行
ロボットや指標を購入前にテストする
マーケットで収入を得る
販売のためにプロダクトをプレゼンテーションする方法
MetaTrader 4のための無料のテクニカル指標 - 14

please leave 5 stars to me A support level is a level where the price tends to find support as it falls. This means that the price is more likely to "bounce" off this level rather than break through it. However, once the price has breached this level, by an amount exceeding some noise, it is likely to continue falling until meeting another support level. A resistance level is the opposite of a support level. It is where the price tends to find resistance as it rises. Again, this means t
FREE
How To Trade
Execute your trades in 3 Easy Steps!
Step 1: Trade Setup Entry Buy in Signal Arrow color DodgerBlue. Entry Sell in Signal Arrow color RED. Success Rate ≥ 75% 100:25 Step 2: Set Stop Loss Stop loss BUY ----> You can set stop loss on Line RECTANGEL color DodgerBlue. Stop loss SELL ----> You can set stop loss on Line RECTANGEL color RED. Step 3: Set Take Profit Take profit BUY on RECTANGEL color RED. Take profit SELL on RECTANGEL color DodgerBlue. Strategy SIMPLE Day trading / Swing
FREE
MT5 Version Available Here: Coming soon...
Telegram Channel & Group : https://t.me/bluedigitsfx
V.I.P Group Access: Send Payment Proof of any of our Paid Products to our Inbox
Recommended Broker: https://eb4.app/BDFXOsprey * The Most User Friendly Symbol Changer on Metatrader ! Features
Change Timeframes in 1 click of a button on 1 chart. Change Between All Currency Pairs in 1 Click of a button on 1 chart. Ability to Turn Boxes to Current Candle Colors. Easily Identify the Trend from
FREE

There are time periods in the market, when trading is highly likely to be unprofitable. This indicator warns you about such non-trading situations and helps you preserve your money and time.
Parameters Remind about non-trading periods: Expiration week - remind about the expiration week Consumer index day - remind a day before the release of Consumer index day NON FARM - remind a day before the release of NON FARM Christmas - remind a day before Christmas New Year Days 25.12 - 15.01 - remind abo
FREE

Necessary for traders: tools and indicators Waves automatically calculate indicators, channel trend trading Perfect trend-wave automatic calculation channel calculation , MT4 Perfect trend-wave automatic calculation channel calculation , MT5 Local Trading copying Easy And Fast Copy , MT4 Easy And Fast Copy , MT5 Local Trading copying For DEMO Easy And Fast Copy , MT4 DEMO Easy And Fast Copy , MT5 DEMO
Strongly recommend trend indicators, automatic calculation of wave standard and MT5 ver
FREE

Chart Time Indicator is very simple and easy, but it can be very important to control the time before opening any manual trade. This indicator shows the time on the chart between 3 different options.
Input parameters Show Time : Select all the time options that you want to see. Local Time (Personal Computer Time), Server Time (Broker Time) or GMT Time. Recommendations: Use only one Chart Time Indicator for each chart.
FREE

Tired of using the same technical indicators? The "Tekno RSI" is an innovative tool designed to make the interpretation of the Relative Strength Index (RSI) more intuitive and accessible to traders of all levels. It displays the RSI as a 3-color histogram, providing a clear and intuitive visual representation of market conditions.
1)Key Features 3-Color Histogram: RSI is a versatile indicator providing insights into market direction and potential reversal points. However, when analyzing the cha
FREE

Necessary for traders: tools and indicators Waves automatically calculate indicators, channel trend trading Perfect trend-wave automatic calculation channel calculation , MT4 Perfect trend-wave automatic calculation channel calculation , MT5 Local Trading copying Easy And Fast Copy , MT4 Easy And Fast Copy , MT5 Local Trading copying For DEMO Easy And Fast Copy , MT4 DEMO Easy And Fast Copy , MT5 DEMO MACD is called Convergence and Divergence Moving Average, which is developed from the double e
FREE
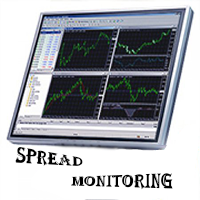
Spread Monitoring is a unique product for analyzing a spread. Unlike most similar indicators, Spread Monitoring uses ticks rather than bars allowing you to detect abnormal spread expansions. Features
Works on ticks rather than bars. Simple and easy indicator configuration. Works on all timeframes. Works on any financial instrument. No repainting.
Parameters
Total - number of displayed ticks. clrSpread - indicator line color.
FREE

UniversalFiboChannel is a universal indicator, it builds a trading channel according to Fibonacci levels. This indicator is a full-fledged channel trading strategy. The indicator is installed in the usual way and works with any trading tool. Options HelpBasisTF = "M: 43200; W: 10080; D1: 1440; H4: 240; H1: 60" is a hint for the BasisTF parameter
BasisTF = 1440 - base period for calculating Fibonacci levels DisplayDecimals = 5 - the number of decimal places of the price of the trading instrumen
FREE

Moving Average Cloud draws 4 MAs on chart simultaneously in histogram style. Indicator uses 4 MAs: slow sma & ema 200 and fast sma & ema 50. the range between 2 slows MAs and Fasts, represented by histograms on the MAs boundaries - creating kind of "cloud" that can be traded by all kind of MA strategies like support & resistance or other... Change of color of the same histogram points to momentum changing.
Combined with other market analysis, can greatly improve trading results.
FREE

The Bollinger Bands Stop New indicator is a trend indicator designed to improve profitability in Forex trading. It is based on the popular Bollinger Bands indicator and offers many features that can improve your trend trading strategies.
It draws a line on the chart that can be used as a guide to where to place a stop loss or as a trend indicator. The green line represents an uptrend, while the orange line represents a downtrend.
The MTF (multi-time frame) feature allows traders to receive tr
FREE
Highly configurable Bollinger Bands indicator. Features: Highly customizable alert functions (at levels, crosses, direction changes via email, push, sound, popup) Multi timeframe ability Color customization (at levels, crosses, direction changes) Linear interpolation option Works on strategy tester in multi timeframe mode (at weekend without ticks also) Parameters:
Bollinger Bands Timeframe: You can set the lower/higher timeframes for Bollinger Bands. Bollinger Bands Bar Shift: Y ou can set
FREE

FTUイディオテック このインジケーターはMT4プラットフォーム用で、単独で使用できますが、他のインジケーターや戦略と組み合わせるのが最適です。 macd、adxなどの様々なインジケーターを組み合わせて矢印を描き、エントリーやトレンド転換を示唆 YouTube で短い紹介ビデオをご覧ください: https://youtu.be/lCRJ3mFNyOQ インジケーターの特徴: 矢印の販売と購入 視覚と音による警告 トレンド継続 / 早期トレンド転換シグナル 新機能: 履歴内のバーの数を制限する バーから矢印までの距離を変更する 使用法: このインジケーターは、ほとんどの資産グループ、外国為替、商品、指数などで使用できます。 すべてのタイムフレーム、再描画なし、高速読み込み 私の FTU Predictor と組み合わせると、確実に優位性が得られます。 いくつかのアドバイス: 資金管理と規律が鍵であり、単一の戦略や指標が成功をもたらすことはありません。損失は発生するものであり、それをどのように回復するかを理解することが重要です。小さな勝ったり負けたりして、市場に恩返しすることがすべての日
FREE

+ 2 bonus strategies! Alerts! I recommend watching my advisor - Night Zen EA The indicator combines the most popular moving average strategies: Simple moving average crossover. Moving average crossover relative to the position of the slower moving average. 2 bonus strategies : The crossing of the fast moving average with the calculation of the opening prices of the slow moving average with the calculation of the closing prices taking into account the slower moving average. (The settings for th
FREE
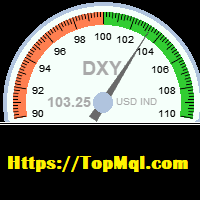
This indicator is used to calculate the dollar index according to the formula of currency pairs(EURUSD ,GBPUSD,USDJPY,USDSEK,USDCHF,USDCAD)Even if the broker does not have the dollar symbol. this Indicator displays the dollar index chart in a separate window at the bottom of the chart. It also displays the current dollar index graphically. In this indicator, it is possible to set the minimum and maximum value of the indicator as well as its size scale on the chart as an input parameter, and it
FREE

The "Trend Edges" indicator determines whether the trend is rising or falling. It is suitable for any time frame (tested on DAX).
The indicator should be treated like Bollinger Bands, meaning that if it breaks out upwards, you can buy with a stop loss below the lower edge.
Find a trending pair, index or CFD. Additionally :
-Sound alert on trend change.
-Alert Notification
-Alert Notification on your mobile phone Check my other indicator "Trend Edges histogram"
FREE

Pivot levels is indicator showing 7 pivot levels. It is adjusted for major use, including: all standard time frames
choice of periods to show three popular calculation formulas (typical, median, weighted) 9 level Camarilla pivot
pivot day shift choice of properties for lines and labels choice of showing alerts when crossing pivot lines Parameters: ----------Main parameters----------- Timeframe - time frame for pivot levels
Number of periods to show - displays pivot levels for number of periods
FREE

Mega Alert Level Indicator: A Simple Yet Valuable Tool The Mega Alert Level indicator provides sound, informational, push, and email notifications when the price of a currency pair touches or approaches standard support and resistance levels, as well as any other objects on the chart you select. Features: Notifications: Customize notifications to your preference—choose between Email, Popup, or Push. All settings are displayed in the upper right corner of the chart. Ease of Use: Simply attach th
FREE
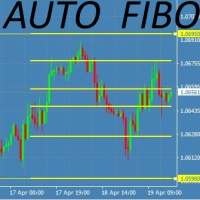
This Fibonacci Indicator is showing fibo retracement lines on chart for EA trading same as the default tool from Metatrader's menu, except this one is fully automatic and changes along with the chart (with modes B and C, then mode A is always fixed by set levels)
AND it also offers the line levels for the Expert Advisors to read (buffers) , so you can set your trades based on crossover\crossunder on those fibo lines.
You can choose from 3 modes for selecting the max HIGH and min LOW limit,
and
FREE
Highly configurable Accumulation and Distribution (AD) indicator. Features: Highly customizable alert functions (at levels, crosses, direction changes via email, push, sound, popup) Multi timeframe ability Color customization (at levels, crosses, direction changes) Linear interpolation and histogram mode options Works on strategy tester in multi timeframe mode (at weekend without ticks also) Adjustable Levels Parameters:
Ad Timeframe: You can set the lower/higher timeframes for Ad. Ad Bar Shif
FREE

This indicator will show week and monthhigh low, very useful to understand the market sentiment. To trade within the range/ break out. Low- can act as support- can used for pull back or break out High- can act as resistance- can used for pull back or break out Breakout strategy refers to the day trading technique that provides traders with multiple opportunities to go either long or short . The main idea is to identify the trend in its most juicy state followed by a trending move.
FREE

The Multi Trendlines indicator automatically draws the dominant trendlines on the current chart. The indicator looks for the 5 best Up trends and the 5 best Down trends as at the current price, drawing each trendline if filter conditions are met. The trendlines are named "Trendline"+[Direction]+Symbol()+TrendlineSequenceNumber For example: The second Up trendline on a EURUSD chart would be named "TrendlineUpEURUSD2". To get its current value would be: ObjectGet("TrendlineUpEURUSD2",OBJPROP_PRI
FREE

Whether you are a scalper or daily trader, you will always look for bullish / bearish engulfing candles. This can be a bit tricky and stressful when you try to visually identify the engulfing candles on the chart. Not only that, you might be trading on the M15 time frame but the engulfing candle is forming or has already formed in the H4 time frame. This indicator is made to do that on your behalf. You can trade on any time frame and see Engulfing candles of another time frame, this means that y
FREE

*This is tradingview indicator converted to mql4*
The Chandelier Exit Indicator is a popular technical analysis tool developed by Chuck LeBeau. It is designed to help traders identify potential exit points for their trades based on market volatility and the concept of trailing stops. The Chandelier Exit Indicator consists of three main components: Average True Range (ATR): The indicator utilizes the Average True Range, which measures market volatility. The ATR calculates the average range betwe
FREE

7年の歳月を経て、私のインジケーターとエキスパートアドバイザー(EA)を無料で公開することにしました。
役立つと感じたら、 5つ星の評価でサポートしてください!あなたのフィードバックが私を動かし、無料ツールの提供を続けさせます。 私の他の無料ツールも こちら からご覧ください。
_________________________________ 「RSI with Bands」インジケーター - より良い取引判断 「RSI with Bands」インジケーターは、クラシックなRSIにシンプルなバンドを組み合わせ、売買のタイミングをより明確に示します。市場でのエントリーとエグジットの最適なタイミングを見極めるように設計されています。 主な利点: 精密な過買い・過売り分析 : バンドを加えることでRSIを強化し、市場の極端な状態を明確にし、誤ったシグナルの一般的な落とし穴を避けます。 明確なシグナル : 価格が高すぎるか低すぎるかを簡単に見極め、取引の判断ができます。 タイミングの改善 : 通常のRSIに追加情報を加えるバンドによって、取引の適切な瞬間
FREE

The BB Arrows MTF indicator is based on the Bollinger Bands indicator. Represents input signals in the form of arrows. All signals are generated on the current bar. In 2 modes, Signals are not redrawn (Exception of very sharp jumps)! All signals in MTF mode correspond to signals of the period specified in MTF. It is maximally simplified to use both for trading with only one indicator and for using the indicator as part of your trading systems. A feature of the indicator is that the indicator ti
FREE

The Spots Indicator can be used for Entering and Exiting your trades based on the common candlestick patterns such as: engulfing, hanging man, doji etc. It is designed to publish desktop and mobile notification every time a signal is triggered. However, it is worth noting that this indicator is recommended to be used with other indicator for confirming the entries. It is best to use it with the Investment Castle Trend Lines indicator and the Supply and Demand indicator
FREE
AC Pivot Panel – Your Ultimate Pivot Trading Tool The AC Pivot Panel is a powerful yet user-friendly pivot point indicator designed to help traders identify key support and resistance levels with ease. Whether you’re a beginner or an experienced trader, this indicator simplifies pivot trading and enhances your decision-making process. Key Features : Interactive Selection Panel : Easily adjust pivot settings directly on the chart with a compact and intuitive panel. Multiple Pivot Methods : C
FREE

Nermal Round Levels is an indicator of round numbers in the form of a grid drawing horizontal lines. You can use it in many ways ... as it could be activating for an expert advisor to enter the market, confirmation of entry for your strategy, entrance area, mark areas of important levels, possible rebounds and others. Place it in your chart and verify as the price respects those round levels.
Inputs GridSpace linecolor lineStyle
FREE

This indicator uses Moving Average to detect markets trend. It's a very useful tool for manual trading. If line is Midnight Blue, indicator detect up trend. If line is Dark Violet, indicator detect down trend. The readings are very simple to use and understand. Indicator works best on H1 timeframe. You can use this indicator with FollowLine to have more accurate signals.
You can to get source code from here .
Parameters BarsCount —How many bars used to show the line. MAperiods —Period of Movin
FREE

Small free indicator to detect certain chart patterns, shoulder head shoulder / reverse, triple top / bottom, cup, flags and others... I designed it a while ago, it detects figures in m1, m5, m15, m30 and h1.
I hope it will be useful to you because I don't trade much with this indicator, I have a few others that I will try to put online quickly maybe you will find it useful, good Trade friends.
FREE
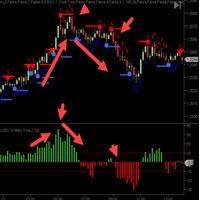
CycleTraderProクローズ強度値インジケーターは 、新しいバーのOPENからそのバーのCLOSEまでの距離を測定します。 入力 - 長さ= 10デフォルト これらの値を合計して長さ設定に戻します。 最初の小節がプラス10ティックで、その次の小節がマイナス7ティックだった場合、これは+3を登録します。 Close Strength Valueを交換するには2つの方法があります。 買い、より高い最高値、より高い最低値を得るために、最低高値と最低安値の方向、およびその逆の取引。 2.指標が色の方向で中央のゼロ点を横切ったときに取引します。赤=売り/緑=買い。 Close Strengthは過去の動きを表示するヒストグラムチャートも表示し、市場が停止または後退するまでにどれだけの距離に到達できるかを確認します。
FREE

ADR 20 mostra l'intervallo medio di pips di una coppia Forex, misurato su un numero di 20 giorni . I traders possono utilizzarlo per visualizzare la potenziale azione dei prezzi al di fuori del movimento medio giornaliero.
Quando l'ADR è al di sopra della media, significa che la volatilità giornaliera è superiore al normale, il che implica che la coppia di valute potrebbe estendersi oltre la sua norma.
L'ADR è utile anche per il trading di inversioni intraday. Ad esempio, se una coppia di valu
FREE
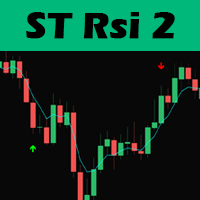
Hello traders, this trading strategy is based on the the Larry Connors RSI-2 strategy, We begin with a 200 periods EMA to find the direction of the market. This is important because we only trade in the main trend direction.
We then look for pull backs using the RSI with a period of 2 to get entry signals. Trades are then exited using the 5 EMA.
Lot size should be calculated using 1% of 1 the ATR value and positions can be added as long as the entry criterion is met.
TRADING IS RISKY AND I D
FREE

This indicator integrates the Bollinger Band strategy in calculation with a volume-over-MA
calculation to further narrow down "Areas of Interest" levels for a potential re-test zone to the right of the chart.
We added a Moving Average calculation for a multi-level cloud and further broke down more conditions to highlight both
volume flow crossover on the High and Extreme High MA's and also high and extreme high volume spikes on set period average
without bull\bear conditions. Original Bull/Bear
FREE

The "MACD Trend Follower" is an indicator based on the MACD oscillator. It serves to spot the trend direction by giving it a fixed color until the trend changes (the trend direction colors are customizable). The default MACD settings for the indicator has been changed to adapt to the fast moving Forex market, but they can be changed to suit the trader.
Recommended settings for the indicator : - MACD Fast EMA : 8 Periods. - MACD Slow EMA : 13 Periods. - MACD SMA : 5 Periods.
Indicator inputs :
FREE

The Visual Result Calculator Indicator is a powerful tool designed to enhance your trading experience on the MetaTrader platform. This intuitive and user-friendly indicator allows you to visualize potential profits or losses on a trading chart, helping you make better-informed decisions and manage your trades with precision. The Indicator displays a dynamic line on the trading chart, representing the potential profit or loss of a trade based on the start and end of the line. Simply click and
FREE

MT4 CCIダッシュボードスキャナーは、さまざまな時間枠と商品にわたるコモディティチャネル指数(CCI)レベルを追跡し、新しいシグナルが検出されるとリアルタイムでアラートを提供します。ユーザーフレンドリーで、コンピュータの処理能力に優しく、どのコンピュータでもスムーズに動作します。 主な機能: 自動インスツルメントグルーピング: スキャナーは、マーケットウォッチリストからすべてのインスツルメントを収集し、カテゴリ(メジャー、マイナー、エキゾチック、その他)に整理します。設定の簡単なチェックボックスインターフェースを使用して、スキャンするインスツルメントを簡単に選択できます。 カスタマイズ可能な時間枠選択: 設定ページから、9つの異なる時間枠のいずれかを選択してスキャンできます。選択されたすべての時間枠はダッシュボードに表示され、新しいシグナル通知が各時間枠ごとに送信されます。 簡単なCCI設定: CCIの設定(期間や適用価格)を調整し、買い/売りレベルを設定できます。現在のキャンドルまたは最近のクローズドキャンドルに基づいてスキャンするかを選択することも可能です。 色のカスタマイズ:
FREE

Just INDY is a simple, and easy to use trend and reversal indicator. It will continuously monitor the movement of the price actions searching for new trends establishing or strong reversals at extreme overbought, and oversold levels.
Parameters Signal Perios
Sent Notification Please Test it with Strategy Tester and see how it work.
Happy Trading...
FREE
Индикатор предназначен для разметки ,фибо уровней и фибо зон.Также есть возможность удаления и редактирования уровней на текущем графике. При установке нескольких индикаторов (FIBO-ZONES)на график,не забывайте менять имя в поле (NAME).В утилите также есть возможность менять цвет зон, толщину линий и стиль линий уровней фибо. При установке индикатора ,зоны выстраиваются автоматически.
FREE
Check out other great products from https://www.mql5.com/en/users/augustinekamatu/seller
This indicator is the best so far at estimating reversal points especially on high time frames. It does not repaint and is based on a combination of moving averages computed using custom functions. No inputs required, it is simple plug and play. The principles used ensure that it can be used on CFDs, Commodities and Stock with incredibly great results. With proper money management and portfolio balancing
FREE

The Awesome Oscillator (AO) Signal Candle Indicator is an indicator used to measure market momentum. Awesome Oscillator (AO) Signal Candle Indicator will change bar's color when set overbought or oversold levels reach. Colored Candles, based on Awesome Oscillator (AO) Signal.
-If the indicator is above zero, the market is bullish. -If the indicator is below zero, the market is bearish. -If the market is bullish, you can take a stand with green candle signals. -If the market is bearish,
FREE

When prices breakout resistance levels are combined with Larry Williams' Percent Range oscillator "WPR" breaks out its historical resistance levels then higher chances emerges to record farther prices. It's strongly encouraged to confirm price breakout with oscillator breakout since they have comparable effects to price breaking support and resistance levels; certainly short trades will have the same perception. Concept is based on find swing levels which based on number of bars by each side to
FREE
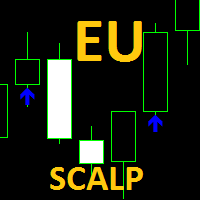
アラート付きのスキャルピングインジケーター:
EU頭皮インジケーターは2つのワーキングセットの組み合わせです。1つは価格変動の方向に逆らって機能するように事前設定されており、2つ目は価格変動またはブレイクアウトが発生する確率に基づいて価格変動の方向に取り組んでいます。重要な貿易レベル。
デフォルト設定は、EurUsdペアM5タイムフレーム用に最適化されています。その他の設定は、最初のコメントの「コメント」セクションにあります。
期待される結果と取引レベルの値を取得したい場合は、チャートにロットziseの推奨事項が表示されます。トレードレベルも線としてチャートに描かれます。
インジケーターは、価格がアクティブな取引レベルの1つに達したときにアラートを送信するように事前設定されており、矢印は買い(青)または売り(赤)を示し、注文を閉じる必要がある場合も示します。注文アラートは、新しいろうそくが表示され、最後のろうそくの本体によって取引レベルが破られた場合にのみアクティブになります。
この指標のように機能するエキスパートアドバイザーは、私の売り手プロファイルにあり、さらなる最適化
FREE

Introducing Round Range 5, a versatile and dynamic indicator designed to optimize your trading strategies on MT4. Let's explore how this indicator can revolutionize your trading experience by adapting round number levels to suit the unique characteristics of each instrument.
In the fast-paced world of financial markets, round numbers play a crucial role. These price levels, ending with multiple zeros or other significant digits, often act as psychological barriers that influence market sentime
FREE

Simple indicator that shows external ( outside ) bars. In certain cases, external bars can be seen as strong trend bars instead of range bars. This can be observed when a with-trend external bar occurs at a reversal from a strong trend. It will help you notice more easily different patterns like - Inside-outside-inside, Inside- Inside -inside, outside - Inside -outside, etc. Works perfectly with my other free indicators Internal bar and Shadows
Inputs: How many history bars to calculate on loa
FREE

The indicator shows the Fibonaccia golden ratio levels and the price balance line Has three different sensitivity options Allows you to visually navigate what state the market is in and where trend reversals are possible Works on all timeframes, on any currency pairs, metals and cryptocurrencies Can be used when working with binary options Distinctive features Based on the golden Fibonacci value; Determines the balance line of price equilibrium Has three different sensitivity settings; Simple an
FREE
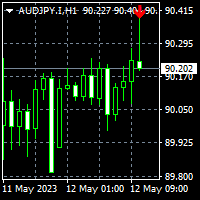
To get access to MT5 version please click here . This is the exact conversion from TradingView: "Hammer & ShootingStar Candle Detector" by "MoriFX". This is a light-load processing and non-repaint indicator. All input options are available. Buffers are available for processing in EAs. You can message in private chat for further changes you need. Thanks.
FREE

Introduction and Description
Colored candlesticks showing the trend based on two moving averages and the slope of the slow moving average. A trend is the overall direction of a market or an asset's price. In technical analysis, trends are identified by trendlines or price action that highlight when the price is making higher swing highs and higher swing lows for an uptrend, or lower swing lows and lower swing highs for a downtrend. Many traders opt to trade in the same direction as a trend, whil
FREE

Live Pivots Indicator Time Frame: Suitable for any time frame. but recommended time frame 30M and above. Purpose of this indicator: Trend Prediction. Buy: When the candle crossed above the golden pivot line its buy call, TP1-R1, TP2-R2, TP3-R3. SELL: When the candle crossed Below the golden pivot line its sell call, TP1-S1, TP2-S2, TP3-S3. Happy trade....
FREE
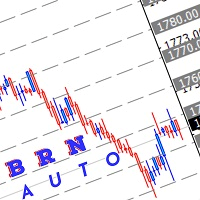
Use this indicator to draw multiple horizontal line to nearest round number Range for round number can be adjust manually depend how user want to use it Selection of colour also can be adjust manually Hope this indicator can help somebody in their trading.
How to use this: Mostly I use this indicator for break, retest and entry. example:- current price XAUUSD :1740.00 which mean the closest level are 1750.00 and 1730.00 Wait for price to break this level. then wait for retracement if price maki
FREE

Quantum Swing 1. What is Quantum Swing The indicator calculates and displays future price levels based on quantum mathematics with high accuracy of probability and direction. Levels are displayed in the form of zones for making trading decisions; they clearly define a narrow price range for placing orders with a minimum stop-loss and maximum take-profit. The indicator displays future trading zones on different timeframes H1, H4, D, W. Quantum oscillations are also displayed without reference to
FREE
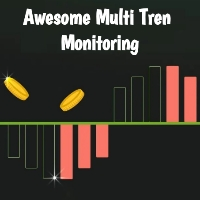
Introducing our innovative indicator, designed with a multi-time frame trend monitoring system! This powerful tool combines several trend signals into one easy-to-use reference signal in the panel, complete with alert features to keep you informed. To maximize its effectiveness, make sure to master the Fibo Musang candle break retest technique—it will greatly enhance your trading experience. For entries, simply keep an eye on the signal in the top left corner. This will guide you in identifying
FREE

万能线段划分指标简介: 万能线段划分是依照两根相互缠绕的均线,依金死叉为标准,将金死叉两边的高低点进行连接开成线段划分。本指标可以设定不同参数多级别叠加使用。 万能分段的原理: 在任意一组均线组成的均线系统中,均线之间的相互缠绕,形成的金死叉是有位次关系的。这点,作者在这里算是首次对外公开这个秘密。上图的均线系统中,走势处于一个较大级别的振荡行情中,均线之间相互缠绕比较频繁,金死叉的数量较多,所以,情况比较复杂。 我们知道,均线可按其周期大小进行位次排序。上图均线依照周期从小到大排序为:MA10,MA30,MA60,MA144,MA233,依照这组均线的位次关系,将每相邻两根均线金死叉做上标注。如:MA10&MA30金死叉标注为“1”,MA30&MA60金死叉标注为“2”,MA60&MA144金死叉标注为“3”,MA144&MA233金死叉标注为“4”。我们将两相邻均线金死叉完全标注完毕后,发现图上还有部份金死叉并未被标注到,这些未被标注到的金死叉全部是非相邻均线之间发生的金死叉。我们依照以上方法,可以识别出均线组之间金死叉的级别位次关系。市场行情的发展是依照此级别位次关系,从小到大
FREE

Identification of support and resistance areas
A useful indicator for traders
completely free
Can be used in all symbols
Can be used in all time frames
It has three different trends: short term, medium term, long term
Settings:
Clr1,2: You can change the color of the lines
Type Trend: You can determine the trend
Message me for questions, criticism and suggestions
FREE

The indicator allows you to trade binary options. The recommended time frame is М1 and the expiration time is 1,2,3 minutes. The indicator suitable for auto and manual trading. A possible signal is specified as a arrows above/under a candle. You should wait until the candle closes! Arrows are not re-painted Trade sessions: TOKYO section (Half-end) Currency pairs: USD/JPY Working time frame: M1 Expiration time: 1,2,3 minutes. The indicator also shows good results when using the martingale strateg
FREE

This indicator displays each bar's volume in points as a histogram. The second version of the indicator. Now it is represented as an oscillator. It is more informative and functional. At that it does not load the main chart. GitHub It displays: bar's volume in points as a histogram (buffer 0) average value of the volume for the whole period (buffer 1) bars upper than the client average value with another color (buffer 2) average value of the amount of bars set by a user (buffer 3) Also: setting
FREE

This powerful tool helps you to easily access Fibonacci tools at different times and in different markets. This tool has the ability to send signals based on Fibonacci as well as setting alarms to be aware of broken Fibonacci levels. Among the capabilities of this tool are the following:
Identifies market trends Fibonacci auto design If Fibonacci levels are broken, it sends a message Send Fibonacci signal
Manuals: After selecting the target market, run the tool In the input settings according
FREE

Информационная панель, которая выставляет уровни покупки продажи и цели для профита на текущий день. Уровни рисуются согласно движению валюты за вчерашний день. Панель вмещает в себя информацию о валютной паре, тенденции на рынке, время до закрытия бара, управление капиталом, рекомендуемый лот, профит в пунктах, а также уровни для покупки и продажи инструмента. Для заключения сделок использовать только отложенные ордера на пробой. Входные параметры Lots - установить текущий лот Risk - риск в про
FREE

The Bolliger Bands On-Off let you control the indicator using the keyboard or a button . You can choose if you want the indicator always shown or always hided while switching among different time frames or financial instruments . ---> This indicator is part of Combo Indicator OnOff
The Bollinger Bands identify the degree of real-time volatility for a financial instruments . A lower amplitude corresponds to a low volatility, conversely a greater bandwidth corresponds to high volatility. Na
FREE

Indicator Description If you need to know future volatility for trading, this indicator is what you need! With the Predictor of the ATR you trading system will be more perfect. This indicator predicts future volatility, and does it quite well. Prediction accuracy is up to 95% at a distance of up to 5 bars into the future (on the period H1). The average forecast accuracy is about 85%, the number of predicted bars is limited by your imagination only. There are five methods used for prediction. The
FREE

Check the Trend Power This indicator is designed to identify the POWER of trend. This is NOT define bullish or bearish trend. It is quite easy to look at the power when the indicator line turns Green the trend are strong when the indicator line turns Red the trend are Weak strategy for trade is : Open possition only when the power go Green Exit possition when the power change to Red
FREE

Forex trading support timer: - This is an indicator that supports a trader's trading process. - Before placing a BUY or SELL order, it is advisable to observe what the current time is like, to get the best position when trading. Function of indicator: - Display information about candle closing time of different timeframes (M1,M5,M15,H1), best used when Scalping. - Show market spreads. - Show TimeZone Trading. - Displays the remaining time of a session.
FREE

このインジケーターは、トレンドの方向とトレンドの転換を示します。 Ganesha Trend Viewerは、GOLD(XAUUSD)専用に設計されたトレンドフォローのインジケーターですが、その他のあらゆる金融商品で使用することもできます。 インジケーターは後で描画し直すようなことはしていません。 推奨する時間足(Timeframe)はH1です。 Ganesha Trend Viewer は、すべてのMeta Traderでサポートされるシンボルで使用できます。 (通貨、金属、暗号通貨、株式、インデックス..)
パラメタ設定
MA Short Period ----- 移動平均 短期間 MA Long Period ----- 移動平均 長期間 Alerts ON ----- アラートオン Mobile Notification On ----- モバイル通知オン
FREE

The indicator is based on a single Moving Average of a user-defined period. By analyzing the price movement of the price relative to this MA, and also by tracking all updates of the price Highs and Lows over the same period as the MA period, the indicator draws its own picture of the trend, avoiding the ever-breaking MA lines. Therefore, if the trend goes up, the line will also point upwards and will not change its direction even on small retracements, allowing to capture almost the entire trend
FREE

This is an unconventional version of the Heiken Ashi Smoothed indicator implemented as lines rather than a histogram. Unlike a usual histogram, the indicator draws the readings of the two moving averages in the form of colored lines.
Example If the candle crosses two indicator lines upwards, a trend is assumed to be changing from bearish to bullish. If the candle crosses two indicator lines downwards, a trend is assumed to be changing from bullish to bearish. The indicator is good at displaying
FREE
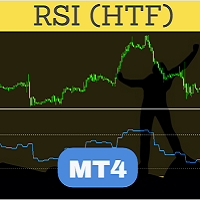
Perfected RSI (Relative Strength Index) HTF (Higher Time Frame) is perhaps the most advanced and reliable HTF indicator. Highly optimized in terms of execution, the indicator comes with standard settings of the RSI indicator which is supplied with the MT4 platform. Place the indicator on the chart, any timeframe. You may select a higher time frame in indicator inputs. The same indicator can be used on a chart multiple times to draw RSI from multiple timeframes or for different RSI period values
FREE

T-Explorer is a Real Time Optimized MetaTrader 4 tool that provides tradable information based on the 10 of the most popular and reliable technical indicators in many timeframes. Our machine learning models calculate the optimum rules and configuration for each indicator in order to provide high probability signals of success. Users are able to customize T-Explorer by selecting suitable timeframes and mode ( FAST, MEDIUM, SLOW ) for the indicators to be used. T-Explorer aggregates and combines o
FREE

RaysFX Stochastic L'indicatore RaysFX Stochastic è un indicatore personalizzato per la piattaforma MetaTrader 4.
Caratteristiche principali:
-Indicatori separati: L'indicatore viene visualizzato in una finestra separata sotto il grafico principale. -Livelli dell'indicatore: L'indicatore ha due livelli predefiniti, 20 e 80, che possono essere utilizzati come livelli di ipervenduto e ipercomprato. -Buffer dell'indicatore: L'indicatore utilizza quattro buffer per calcolare e memorizzare i suoi
FREE
MetaTraderマーケットは、他に類のない自動売買ロボットやテクニカル指標の販売場所です。
MQL5.community ユーザーメモを読んで、取引シグナルのコピー、フリーランサーによるカスタムアプリの開発、支払いシステムを経由した自動支払い、MQL5Cloud Networkなど、当社がトレーダーに対して提供するユニークなサービスについて詳しくご覧ください。
取引の機会を逃しています。
- 無料取引アプリ
- 8千を超えるシグナルをコピー
- 金融ニュースで金融マーケットを探索
新規登録
ログイン