Guarda i video tutorial del Market su YouTube
Come acquistare un Robot di Trading o un indicatore
Esegui il tuo EA
hosting virtuale
hosting virtuale
Prova un indicatore/robot di trading prima di acquistarlo
Vuoi guadagnare nel Market?
Come presentare un prodotto per venderlo con successo
Indicatori tecnici gratuiti per MetaTrader 4 - 14

This indicator demonstrates that the price change of financial instruments is NOT a random walk process, as advocated by the "Random Walk Hypothesis", and as popularised by the bestselling book "A Random Walk Down Wall Street". I wish that were the case! It is shown here that the real situation with price change is actually much worse than a random walk process! Deceptive market psychology, and the bulls-bears tug of war, stack up the odds against traders in all instruments, and all time frame
FREE

First of all, it is worth highlighting here that this Trading Indicator is Non Repainting, Non Redrawing and Non Lagging, which makes it ideal for manual trading. Never repaint and recalculate Once an arrow appears it never disappears, the signal comes at the opening of the new candle You will now be more profitable with this indicator You can do swing trading or scalping trading The indicator helps you identify the trend Can be optimized across all pairs and time frames Blue arrow is for buyin
FREE

This is an implementation of the market cycle indicator described by Raghee Horner in the book "Forex Trading for Maximum Profit" . The current state of the market can be determined by analyzing the inclination angle of the exponential moving average (EMA) running on a period of 34 bars. If the EMA inclination is defined as the direction of the hour hand on the dial from 12 to 2 hours, then an uptrend is considered to be present; from 2 to 4 hours, the market consolidates; from 4 to 6 hours, a d
FREE

This oscillator has become one of the main tools of most professional traders. The indicator includes a classical MACD ( Moving Average Convergence/Divergence ) line, a signal line, as well as a MACD histogram. Exponential moving averages are used in the calculation. The indicator also provides the ability to enable signals on identification of divergences between the price graph and the indicator. Divergences are identified using three patterns: classic, hidden and extended divergences.
Indic
FREE

Strong and weak Pairs is a trend following indicator to help you choosing the pairs to trade based on the currency score. Strong and weak Pairs is comparing currencies position to the moving average for all major pairs then display the position score from Zero (0) to Seven (7) with two lines on the chart. 7 is the strongest currency and zero is the weakest currency. Additionally there is a dashboard displaying all the currencies score to choose the pair you will trade. Strong and Weak Indicator
FREE

This indicator is designed for binary options. Based on proprietary divergence of the CCI indicator. A sell signal: A down arrow appears on the chart. A buy signal: An up arrow appears on the chart.
Input parameters History - the number of bars in history for calculation Period CCI - period of the CCI technical indicator Up border - overbought limit for calculation of the divergence Down border - oversold limit for calculation of the divergence Price - price for the indicator calculation Alert
FREE
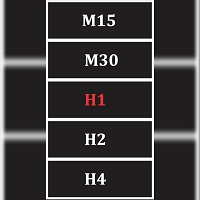
Seamlessly switch between 13 (9 mt4 default and 4 popular custom) time frame with this tool. Real ease of switching between default and custom time frames. Note indicator does not create custom time frame chart data, it only enables you to switch to and from them. Creating a custom time frame can be done using the default mt4 period converter script attached to a lesser default mt4 time frame. Example attach period converter on M1 and set period multiplier to 10 to have a custom M10 chart.
FREE

Идея индикатора очень проста и скорее всего пригодится тем, кто используют линейный график для технического анализа. Что-бы устранить "неровности" (-: линейного графика и был написан этот индикатор. Линия графика соединяет цены закрытия свечей, как и в классическом линейном графике, но игнорирует цены, которые шли в направлении линии и новый экстремум возникает только тогда, когда цена закрытия последней свечи явно ниже или выше предыдущего значения. Это облегчает визуальное восприятие при поиск
FREE

Download directly the indicator file here. (if you can't open on MT4) MACD Indicator is one of the most popular momentum indicators among users. Searching and detecting MACD signals by the eye may not be easy. Scan Full Charts Dashboard Indicator with simple user interface and search customization panel saves time and scans all charts for MACD signals search and notifies the user with high accuracy. After finding the signal, the user was aware of the result by alerts and notifications. This ind
FREE

Th3Eng Panda trend is a powerful indicator that works perfectly for scalping trades as well as swing trades. Th3Eng Panda trend is not just an indicator, but a very good trend filter. You can setup it on H4/H1 to Find the main trend and start scalping on M5/m15/m30 Time Frames. Works with all pairs and all Time Frames.
Inputs:
Section #1 History : Maximum number or bars to draw the last signals. (Default 5000) Draw Candles : Draw red candle when sell signal and green when buy signal. (tr
FREE

Le medie mobili cambiano in movimento. L'indicatore seleziona automaticamente il periodo per calcolare le medie mobili. Maggiore è il movimento direzionale, maggiore è il periodo di media. Quando la tendenza rallenta, il periodo delle medie mobili diminuisce e diventano più veloci. Ciò consente una risposta più rapida al cambiamento di tendenza.
L'indicatore funziona bene in una tendenza o in un punto di inversione di tendenza. In verde indicatore può essere usato al contrario, ad esempio qu
FREE

ATR Accelerator Indicator informs you about strong price movements based on the ATR Indicator. This Indicator works for all Timeframes and Symbols, the strength of movements can be configured.
Important: Get informed about new Products, join our MQL Channel: https://www.mql5.com/en/channels/etradro
Useage This Indicator works for all Timeframes and Symbols, the strength of movements can be configured. Features works on all timeframes and forex pairs or indices. Alert and Notify function
FREE

Versuss è uno strumento speciale. L'indicatore può creare nuovi strumenti per la tua analisi. Puoi confrontare qualsiasi coppia di strumenti sulla tua piattaforma.
Esempio 1 Se stai negoziando USDJPY, la tua analisi può includere anche SP500 e NIKKEI225. Con Versuss, puoi confrontare come un indice si muove rispetto all'altro e poi confrontarlo con la coppia USDJPY.
Se il mercato valutario segue i movimenti degli indici, puoi ottenere una previsione chiara su ciò che accadrà e prendere
FREE

The "Trend Edges" indicator determines whether the trend is rising or falling. It is suitable for any time frame (tested on DAX).
The indicator should be treated like Bollinger Bands, meaning that if it breaks out upwards, you can buy with a stop loss below the lower edge.
Find a trending pair, index or CFD. Additionally :
-Sound alert on trend change.
-Alert Notification
-Alert Notification on your mobile phone Check my other indicator "Trend Edges histogram"
FREE
Indicador Gratuito desarrollado por Mr Beast Inversiones Mr Beast : Gestión de riesgo profesional. Brindo a la comunidad la entrada a productos de M Beast. Echar un vistazo a mis señales y expert advisors. Descuentos de hasta 70% Diclaimer: La negociación en Forex, CFD y Opciones conlleva un riesgo de pérdida sustancial y no es adecuada para todos los inversores. El alto grado de apalancamiento puede actuar en su contra y también en su favor, Antes de decidirse a operar en productos tan apalanca
FREE

This indicator will show yesterday and today high low, very useful to understand the market sentiment. To trade within the range/ break out. Previous day low- can act as support- can used for pull back or break out Previous day high- can act as resistance- can used for pull back or break out The previous day high low breakout strategy refers to the day trading technique that provides traders with multiple opportunities to go either long or short . The main idea is to identify the trend in its m
FREE

PLEASE HELP REVIEW/ SUPPORT/ SHARE THIS OTHER INDICATOR HERE https://www.mql5.com/en/market/product/51637 AS YOU DOWNLOAD THIS ONE FOR FREE. THANKS.
A. This pivot indicator shows the days Pivot Price. Yellow line is pivot point. Blue line is resistance and red line is support. B. It also shows Resistance R0.5, R1, R1.5, R2, R2.5, and R3 C.It also shows support S0.5, S1, S1.5, S2, S2.5, and S3 INPUT: Under input you will see 3 Variables 1.ExtFomula. Here you can set your preferred exit at a
FREE

Индикатор "Buy Sell zones x2" основан на принципе "остановка/разворот после сильного движения". Поэтому, как только обнаруживается сильное безоткатное движение, сразу после остановки - рисуется зона покупок/продаж. Зоны отрабатывают красиво. Или цена ретестит зону и улетает в космос, или пробивает зону насквозь и зона отрабатывается с другой стороны так же красиво. Работает на всех таймфреймах.
Лучше всего выглядит и отрабатывает на Н1.
Может использоваться как: индикатор зон, где лучше
FREE

Screener Breakout Congestion: Vi è mai capitato di perdere un'opportunità di trading perché non stavate osservando il grafico di quel mercato in quello specifico time frame? Ecco questo screener vi aiuterà a identificare i breakout delle congestioni nei mercati che volete seguire nei diversi time frame richiesti. Una volta identificati i mercati (forex, indici, CFDs) e i diversi time frame (1M, 5M, 15M, 30M, 1H, 4H, Daily), lo screener è rappresentato da diversi bottoni che cambiano colore quand
FREE

the AK CAP toolbox free to use;
it includes the same indicators we use for our daily trading and we think the simpler the better. Lightweight indicator for use on all timeframes. that includes VWAP with vwap value indicator on top right. 3 EMA: FAST, MEDIUM, SLOW the candle timer to show how much time left in a candle.
colors and positions are fully customizable.
enjoy
FREE

Aroon and Moving Average A combination of Supertrend and Moving Average to create a converging trade setup Input parameters: signal mode: set it to true if you want to plug it into STAT (Signal Tester and Trader) arrow shift: distance between fast EMA line to arrow on chart turn on price line filter turn on moving average signal for converging setup aroon period MA period MA averaging method MA pricing method upper level limit (Aroon) lower level limit (A roon ) You can find the best setting
FREE

FREE FOR A LIMITED TIME ONLY!!! The Ultimate Indicator For Trading Trend This indicator clearly shows you the strength of the market in one direction or the other, which means that you can trade knowing you are either with or against the market. When used in conjunction with the +3R principles you are sure to have some serious results. The +3R Principles Routine - This is when you trade and how often Rules - This is the rule you follow Risk:Reward - This is the percentage amount of your accoun
FREE
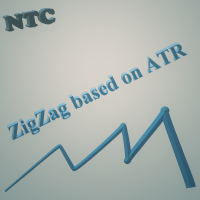
Description
The base of this indicator is an ZigZag algorithm based on ATR and Fibo retracement. This indicator is not redrawing in sense that the ZigZag's last shoulder is formed right after the appropriate conditions occur on the market. The shoulder doesn't change its direction afterwards (can only continue). Note: An indicator with advanced possibilities is also available.
Indicator input parameters
The input parameters allow to change the sensitivity of the ZigZag. ATR period ATR mul
FREE

Suitable for multi time frame market direction prediction. Green and red color indicate the buy and sell call respectively. Green indicator is denote buy call and Red indicator denote the sell call. push notification is available to send instant message to you when green or red indicator will be appear. you have to activate the option at the time of mapping this indicator to you chart
FREE
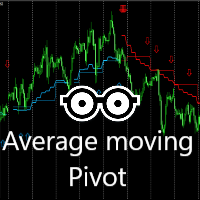
This indicator is very effective for trading everyday. A combination of moving averages and 2X Pivots calculation to produce a very convincing signal everyday. Blue colour signals a buy opportunity. Follow the arrows for possible buy points. The Blue pivots and average line, serves as possible support. Red colour signals a sell opportunity. Follow the arrows for possible sell points. The Red pivots and average line, serves as possible resistance. Best use on the 15 minutes, 30 minutes or 1 hour
FREE

TrendFinder VolumeI are Colored candlesticks showing the trend based on Volume and Slope of Trend
This indicator will give you the color change on the next bar on the confirmation candle and will never repaint Lime Green = Possible Buy (Volume up), Teal Green = Bullish Weak (Volume Decreasing), Red = Possible Sell (Volume up) , Orange = Bearish Weak (Volume Decreasing)
TrendFinder Volume is optimize to trade on any market and to be used trending and None trending markets. For best results us
FREE

When prices breakout resistance levels are combined with Larry Williams' Percent Range oscillator "WPR" breaks out its historical resistance levels then higher chances emerges to record farther prices. It's strongly encouraged to confirm price breakout with oscillator breakout since they have comparable effects to price breaking support and resistance levels; certainly short trades will have the same perception. Concept is based on find swing levels which based on number of bars by each side to
FREE

Indicator for the 4th strategy of the Pipsurfer EA. This indicator will allow the user to visually see the points of entry for strategy 4 of Pipsurfer. In the settings you will be able to adjust the parameters to mix and match to your trading style and find the settings that you want to either trade manually or tune the EA to do. Strategy 4 uses a market structure trend continuation approach to trading and looks for confirmed highs in downtrends and confirmed lows in uptrends to find great trend
FREE

MACD is well known indicator that still can be use for prediction where price will go next few minutes, hours or even weekly With colored bar of Macd, your eyes can easily catch when color is changed based what market price movement to find any early trend on market. here is the parameter of the indicator: TF_MACD , default is 1 Hour , this mean you can see clearly MACD of 1 Hour TimeFrame on Lower TimeFrame. InpPrice , default is Price Close , this is original MACD parameter from Metaquotes st
FREE
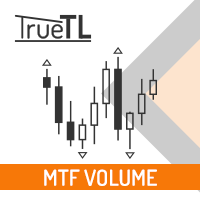
Highly configurable Volume indicator.
Features: Highly customizable alert functions (at levels, crosses, direction changes via email, push, sound, popup) Multi timeframe ability Color customization (at levels, crosses, direction changes) Linear interpolation and histogram mode options Works on strategy tester in multi timeframe mode (at weekend without ticks also) Parameters:
Volume Timeframe: You can set the lower/higher timeframes for Volume. Volume Bar Shift: you can set the offset of th
FREE

The Direction Line indicator shows you if the current market is in a up trend or uf ut's in a down trend. The sensitivity of the trend calculation ist customizable. You can adjust it till it fit's your strategy. Even as a beginner is this indicator easy to use and you'll see every trend.
Key Features of Direction Line Real-time trend calculations of all time frames Graphical Interface Identical calculation for all time frames Customizable trend sensivity No repainting
Settings / Inputs
Sen
FREE
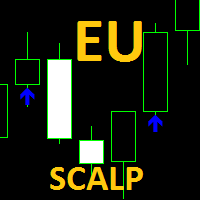
Indicatore di scalping con avvisi:
L'indicatore EU Scalp è una combinazione di due set di lavoro, il primo è preimpostato per funzionare contro la direzione del movimento del prezzo e il secondo sta lavorando sulla direzione del movimento del prezzo, in base alla probabilità di oscillazioni o breakout dei prezzi che si verificano a importanti livelli commerciali.
Le impostazioni predefinite sono ottimizzate per la coppia EurUsd M5 Timeframe, ulteriori impostazioni possono essere trovate nel
FREE

Relative Strength Index Cross [RSI Cross] A combination of 2 RSI to create a crossover trading setup Input parameters: signal mode: set it to true if you want to plug it into STAT (Signal Tester and Trader) arrow shift: distance between fast EMA line to arrow on chart price line filter fast RSI period slow RSI period RSI price method price upper level price lower level You can find the best setting for 4 hour EURUSD on this video
FREE

please leave 5 stars to me A support level is a level where the price tends to find support as it falls. This means that the price is more likely to "bounce" off this level rather than break through it. However, once the price has breached this level, by an amount exceeding some noise, it is likely to continue falling until meeting another support level. A resistance level is the opposite of a support level. It is where the price tends to find resistance as it rises. Again, this means t
FREE

EMA Separation plots 2 exponential moving averages, and a fill between them. The fill is colored differently according to an uptrend (short period EMA above long period EMA), or a downtrend (short period EMA below long period EMA). This is a small tool to help visualize the difference between long and short period averages. We hope you enjoy! EMA Separation can also be paired with our free EMA Separation Coefficient
Parameters Short period (Default=10): # bars used to calculate short period EM
FREE

The Moving Averages On-Off let you control the indicator using the keyboard or a button . You can choose if you want the indicator always shown or always hided while switching among different time frames or financial instruments . ---> This indicator is part of Combo Indicator OnOff
It's possible to use three Moving Averages , defined as Short , Medium , Long or Raimbow MA 5,10,20,50,100,200.
Input MOVING AVERAGES
You can customize the price type used for calculation : close,
FREE

This indicator is the translated version of Kıvanç ÖZBİLGİÇ's PMAX Indicator, developed on the Matriks Data Terminal, into the MQL4 language. It is a trend-following indicator and quite successful. Its usage will be free and unlimited for a lifetime. You can click on my profile to access the MQL5 version of this indicator. You can also get your programming requests for MQL4 and MQL5 languages done at İpek Bilgisayar with an invoiced service. You can reach İpek Bilgisayar at www.ipekbilgisayar.or
FREE
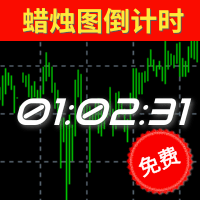
倒计时指标功能介绍 类别
解释
备注
预计结束倒计时 计算当前周期蜡烛图的结束时间(可应用于所有周期),其考虑了蜡烛图可能会因为日常休市而提前结束的情况; 如果该蜡烛图包含多个休市和开市的情况下,以最后的休市或者蜡烛图收盘时间为准。 值得特别注意的是:本指标并没有将平台额外公布的节假日休市、修改休市或者开市时间等因素纳入考虑范围,它仅仅是基于MT4所公开的交易时间做计算,无法100%确保本品种的收盘或者开盘时间无误 ,故使用者需提前明确该品种交易时间情况。
预计开盘倒计时 仅限于状态为"休市中"的提示,根据MT4上公开显示开市时间进行预估大约还有多久时间开盘; 和预计结束倒计时类似,并没有将额外公布的时间纳入考量。由于W1和MN1周期中包含多次的开盘和收盘,所以该两周期无休市提示。
【状态】 颜色 状态 备注 绿色 正常 一切正常 黄色 服务器无报价 服务器实际上传送到MT4并非是毫无中断的,可能是1分钟之内出现多次,甚至是连续较长的时间无报价,取决于您所处的网络延迟、服务器的情况等等。
本品种已有X秒无报价 MT4上并不是所有的品种的报价都是最新的,有可能某
FREE

This indicator helps you to Scan symbols which are in the Market Watch Window (in demo Max 15 Symbol) and filter out trends with alerts. It works based on the most popular indicator "Bollinger Bands" which is used by many traders for trading: When box color changes to " Green " or " Red " color, it indicates you for trend change for long and short entry. And also you will get alerted on screen. When it changes to " Green ", it indicates you that trend is going upwards, and you can take the long
FREE

AIS MT4 INDICATOR 5 ALL INCLLUSIVE SET
!!!!!!!!!!!!!!!!!!!!!!!!!!!!!!!!!!!!!!!!!!!!!!!!!!!!!!!!!!!
!
! ATTENTION ! LIMITATION OF FREE OFFER PERIOD IS IMPLICIT !
!
! CONFIRMATION 2024-08-20 20:00 !
!
!!!!!!!!!!!!!!!!!!!!!!!!!!!!!!!!!!!!!!!!!!!!!!!!!!!!!!!!!!!
GUIDE
CHAPTER 1 IMPORTANT INFORMATION <1> THIS INDICATOR IS ONE OF THE SERIES OF NEW AIS INDICATORS AIS MT4 INDICATOR 1 =ADVANCED CLASSIC= AIS MT4 INDICATOR 2 =MULTIFRAMES= AIS MT4 INDICATOR 3 =LIN
FREE
I create this this Free Indicator to help you to plot your BUY / SELL Average and BEP level in your chart. Just drag to your chart, and you can see the level and plan better to your trade. It's usefull if you have averaging position or even hedging position, so you can plan your trade better and no need to calculate manually again. Use it for free, and please leave comment if you feel this usefull.
FREE

The selective pin bar is designed to identify reversals. To use the selective pin bar effectively, traders typically look for Strong Rejection: The tail of the pin bar should extend significantly beyond the surrounding price action. It indicates that there was a sharp rejection of higher or lower prices during the trading period. A strong rejection suggests that the market sentiment may be changing.
FREE

RSI Scanner, Multiple Symbols and Timeframes, Graphical User Interface An indicator that scans multiple symbols added from the market watch and timeframes and displays result in a graphical panel. Features: Multi symbol Multi timeframe Alerts and Notifications Live Monitoring Sorting modes One click to change symbol and timeframe Inputs for RSI and scanner settings
FREE

EMA Separation Coefficient reflects the separation between short-term and long-term exponential moving average trend resistance, as well as the direction of the current movement. Pay attention to potential crossover points when the coefficient approaches zero, this may indicate an upcoming breakout or reversal. Wait for confirmation of the trend before entering the trade, and exit when the coefficient forms a max (for calls) or a min (for puts). This is a small tool to help visualize the differe
FREE

Esse indicador mede o 1º Canal de referencia e a 1º Zona Neutra * configurar o canal macro para verificar a frequencia MAIOR H1 H4 1D * configurar o canal micro para verificar a frequencia Menor 1M 5M 15M Como instalar o Indicador fimathe. E uma pré mentoria tem uma estrategia Secreta bonus nesse video . assitao o video para enteder as logicas que podemos iniciar com esse indicador.
https://www.youtube.com/playlist?list=PLxg54MWVGlJzzKuaEntFbyI4ospQi3Kw2
FREE

The indicator still has a few bugs but is ready for testing.
This is my first indicator that determines entry and exit points. The entry point is based on breaking the peaks determined by a channel indicating highs and lows (invisible channels). TP1 is a probable target at which most positions can be closed. The channel determining the opening and closing of positions is based on different assumptions. The red stop loss line is determined based on lows and highs.
The stop loss can be adjusted
FREE

Trendfinder SMA With Zone and Alert are Colored candlesticks showing the trend based on two SMA as Signal and two SMA as a Buy and Sell Zone and the slope of the slow moving average. This indicator will give you the color change on the next bar on the confirmation candle and will provide alert on Buy and sell signal, when it enters the buy and sell zone and when the market test the buy or sell zones as support or resistance and will never repaint . This indicator has the following: 2 SMA for th
FREE

The indicator shows the difference between Open and Close prices. The indicator in a separate window shows the difference between the Opene price of the current bar with the Close price of the previous bar. The panel in the upper left corner shows the difference between the Open and Close prices of the current bar.
Parameters Count_Bars - number of bars to display the indicator data. If 0, the number is displayed on all available bars; display - enable numerical values; _fontsize - indicator f
FREE

Check out other great products from https://www.mql5.com/en/users/augustinekamatu/seller
This indicator is the best so far at determining the currency strength of each pair. It provides stable values and is highly adaptive to market changes. It is a great tool to add to your arsenal to make sure you are on the right side of the trend at all times. No inputs required, it is simple plug and play. A Winning Trading Strategy This article describes the components and logic needed to develop a tr
FREE

BuySell Volume is an indicator that approximates Buy and Sell volumes based on price movement. Input Description: applied_model: Choose the applied model. In low reversal mode, price is considered receive low bearish pressure during bullish candle's creation (high bearish pressure on high reversal model. In other words, Bullish Marubozu candles has really high Buy Volumes in low reversal model than in high reversal one.
Output Description: Buy and Sell Volume: Determines how many Buy and Sell v
FREE

The Fibonacci indicator automatically displays the Fibonacci retracement levels, representing significant support and resistance. The range for calculating the indicator can be taken from the previous day, week, month, year or user-specified session.
Levels 100 % (High) of the range from the previous session. 0 % (Low) of the range from the previous session. 76,4 % of the range from the previous session. 61,8 % of the range from the previous session. 50 % of the range from the previo
FREE
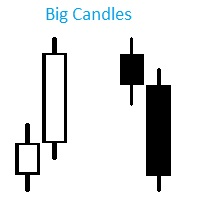
Индикатор Big Candles показывает кратное превышение размера свечи относительно среднего показателя рассчитанного за определенный период. Индикатор отмечает размер свечи на графике в пипсах и сигнализирует о появлении “большой” свечи. Описание параметров: HistoryBars - Количество баров для отображения индикатора countN - Период расчета среднего размера свечи f actor - Во сколько раз длина свечи превышает средннее значение, для отображения сигнала
FREE

Questo indicatore modifica continuamente il colore dei bordi e dei corpi delle candele, nonché il colore dei volumi in tempo reale. L'indicatore è facile da usare. La tavolozza dei colori è varia. Questo prodotto è una soluzione grafica, quindi è difficile descrivere ciò che fa tramite testo, è più facile vederlo scaricandolo, inoltre il prodotto è gratuito. L'indicatore è adatto ai blogger che vogliono creare una bella immagine di un grafico per l'editing video o ai trader che vogliono rendere
FREE

The StrikePin indicator is a technical, analytical tool designed to identify trend reversals and find optimal market entries. The StrikePin indicator is based on the pin bar pattern, which is the Price Action reversal pattern.
An entry signal, in a trending market, can offer a very high-probability entry and a good risk to reward scenario.
Be careful: the indicator is repainting since it is looking for highest high and lowest lows. You should avoid to use it in experts but you can use it
FREE

QuantumAlert Stoch Navigator is a free indicator available for MT4/MT5 platforms, its work is to provide "alerts" when the market is inside "overbought and oversold" regions in the form of "buy or sell" signals. This indicator comes with many customization options mentioned in the parameter section below, user can customise these parameters as needful. Join our MQL5 group , where we share important news and updates. You are also welcome to join our private channel as well, contact me for the p
FREE

Индикатор отображает различными цветами на фоне графика три торговые сессии. Открытие - закрытие Лондон, Нью Йорк, Токио по умолчанию. Применение Для успешной торговли важно знать начало и конец торговых сессий с наибольшей ликвидностью, так как именно в это время цена делает самые большие движения.
Особенности Настройки по умолчанию - торговые сессии по Лондону, Нью Йорку, Токио. Возможность выставить свои рамки тоговых сессий Алерт при открытии сессии Показ открытия дня по GMT Настройки для
FREE

Простой, но полезный индикатор для контроля волатильности при внутридневной торговле. Индикатор наносит на текущий график уровни средней волатильности (ATR) за указанное количество дней. На текущем торговом дне уровни динамические и перемещаются в зависимости от минимума и максимума цены текущего дня в режиме "реального времени". Во входных параметрах мы задаем: - количество дней для расчета и отрисовки уровней среднего АТР - цвет линий уровней среднего АТР - толщину линий уровней среднего АТР
FREE

A classic indicator with advanced features for more accurate display of the market situation. All settings of all moving averages are available, such as the moving average type and the priced used in its calculation. It is also possible to change the appearance of the indicator - line or histogram. Additional parameters provide the ability of fine tuning.
Distinctive features Does not redraw. Additional parameters for fine tuning. Displayed as a line or as a histogram. Works on all timeframes
FREE

This indicator displays each bar's volume in points as a histogram. The second version of the indicator. Now it is represented as an oscillator. It is more informative and functional. At that it does not load the main chart. GitHub It displays: bar's volume in points as a histogram (buffer 0) average value of the volume for the whole period (buffer 1) bars upper than the client average value with another color (buffer 2) average value of the amount of bars set by a user (buffer 3) Also: setting
FREE

Free Scalping is a comprehensive manual system developed for the most efficient trading at any market conditions and time scale.
The system is based on two main blocks:
1. The block of trend determination that calculates dynamic support and resistance. The function of auto-optimization is available for this block.
2. The block of price deviation from its median based on the big set of regressions to get the statistically-valid result. Entry rules For buys:
1. The trend goes up
2. The pr
FREE

The GTAS BSI is an indicator designed to provide the trend direction and buy/sell signals, using combination of momentum indicators. This indicator was created by Bernard Prats Desclaux, proprietary trader and ex-hedge fund manager, founder of E-Winvest.
Description The BSI indicator is represented as a histogram under the price chart. +100 (green) value indicates a bullish trend. -100 (red) value indicates a bearish trend. When the BSI turns to +100 (green), it gives a potential buy signal. W
FREE

Having to check constantly if your CCI has reached a specific level can be tedious and draining at times, especially if you have to monitor different asset classes at a time. The Alert CCI indicator will assist in this task, ensuring that you get the most with little effort. When the CCI values get to a specified level, the alerts will go off, on the chart, on the MT4 phone app or via email (You can receive text messages to your phone if you activate texts on your Gmail account). The indicator d
FREE

Traders Dynamic Index (TDI) Signal Input parameters: signal mode: set it to true if you want to plug it into STAT (Signal Tester and Trader) arrow shift: distance between fast EMA line to arrow on chart middle band filter price line filter RSI period RSI price method Volatility period MA period 1 MA period 2 Averaging method You can find the best setting for 4 hour EURUSD on this video
FREE

The SuPrEs indicator indicates the distance to the next horizontal line whose name begins with the configured prefix (see Options).
usage Draw support & resistance in the chart and let the indicator warn you, as soon as a configured distance is undershot. Use the prefix to provide alarms for other lines as well as standard lines (see screenshot with pivot indicator).
Display of the indicator The indicator displays the distance to the next line above and below the current (Bid) price. Not mor
FREE

This indicator graphically displays profit ($),risk/reward and % of risk according SL&TP Open orders on Current Symbol. when you open orders on current symbol and set StoplLoss and TakeProfit this indicator automatically calculate Risk/Reward and calculate %risk Of Equity Account that your order get stop Loss. If you trade on several symbols at the same time, you can install the indicator on each one separately and see the relevant calculations on each one.
FREE

This indicator is one of the useful tools for traders who trade on currency pairs and based on the strength of each currency they can make a correct decision or confirmation in the positions. It has been calculated for all the minor currency pairs supported by the broker and displays the values of the major currencies. These currencies are displayed horizontally or vertically according to the trader's config when executing the indicator. One of the trading strategies that can be used is to cho
FREE

Average daily range, Projection levels, Multi time-frame ADR bands shows levels based on the selected time-frame. Levels can be used as projections for potential targets, breakouts or reversals depending on the context in which the tool is used. Features:- Multi time-frame(default = daily) Two coloring modes(trend based or zone based) Color transparency
FREE

SuperTrend AM is an indicator that allows you to open a position at the very beginning of a significant price movement. The second most important quality of the indicator is the ability to follow the trend as long as possible in order to obtain all potential profits while minimizing potential losses. This indicator does not repaint or not recalculate. A version of this indicator with advanced settings and signal notifications is SuperTrend 3 AM .
Signal of the indicator: red arrow appearing a
FREE

Индикатор реализован для определения классического канала движения цены, который используется на крупных биржевых площадках. Не перерисовывается Синий уровень - это уровень поддержки Красный уровень - это уровень сопротивления Белый уровень - является Pivot-уровнем Настройки Period_SEC - ввод значения периода . Примечание: Индикатор определяет уровни только на пятизначных котировках! Метод торговли: Открытие позиций осуществляется от уровней , именно на их значениях происходит отскок цены
FREE

Description I think, almost all traders dream about non-lagging MA. I have realized that dream in my indicator. It allows forecasting future MA values! The indicator can be used in four different ways: The first one - forecast for the desired amount of bars. Thus, you are able to evaluate future price behavior. The second one - generating non-lagging "averages". That can be implemented by moving MA back by the half of the averaging period and setting the forecast the necessary amount of bars ahe
FREE
Scopri come acquistare un robot di trading dal MetaTrader Market, il negozio di applicazioni per la piattaforma MetaTrader.
Il sistema di pagamento di MQL5.community supporta le transazioni tramite PayPal, carte bancarie e gli altri sistemi di pagamento più diffusi. Per essere pienamente soddisfatto, ti consigliamo vivamente di testare il robot di trading prima di acquistarlo.
Ti stai perdendo delle opportunità di trading:
- App di trading gratuite
- Oltre 8.000 segnali per il copy trading
- Notizie economiche per esplorare i mercati finanziari
Registrazione
Accedi
Se non hai un account, registrati
Consenti l'uso dei cookie per accedere al sito MQL5.com.
Abilita le impostazioni necessarie nel browser, altrimenti non sarà possibile accedere.