YouTubeにあるマーケットチュートリアルビデオをご覧ください
ロボットや指標を購入する
仮想ホスティングで
EAを実行
EAを実行
ロボットや指標を購入前にテストする
マーケットで収入を得る
販売のためにプロダクトをプレゼンテーションする方法
MetaTrader 4のための無料のテクニカル指標 - 17

7年の時を経て、私の独自のインディケーターとEA(エキスパートアドバイザー)を無料で公開することにしました。
役立つと感じたら、 5つ星の評価でサポートをお願いします!あなたのフィードバックが無料ツールを提供し続ける動機となります。 他の無料ツールも こちら からご覧ください
_________________________________ フォレックス市場のボラティリティ分析を強化するATRバンド付きインディケーター MQL5で開発されたATRバンド付きインディケーターをご紹介します。この革新的なツールは、平均真のレンジ(ATR)をカスタマイズ可能な上下のバンドと統合し、市場のボラティリティについて詳細な理解を提供します。 主な特徴: ボラティリティの測定 : 市場のボラティリティを正確に測定するためにATRを使用し、市場状況に関する重要な洞察を提供します。 カスタマイズ可能なバンド : ボラティリティの極値と市場のトレンドを視覚化するための調整可能な上下のバンドを特徴としています。 ブレイクアウトとコンソリデーションの検出 : 戦略的な取引決
FREE

The indicator searches for and displays Doji candlesticks on the chart and signals the appearance of such a candle. The direction of the signal depends on the direction of the previous candles, as the Doji signals a reversal or correction. In addition to the possibility of signaling, the power of the reversal is graphically shown (the more green, the more likely growth, the more red, the price will fall). In the indicator settings, you can change the parameters of the Doji candlestick, the closu
FREE

STOCHASTIC Dashboard Panel This indicator helps you to scan symbols which are in the Market Watch window and filter out a trend according to STOCHASTIC .
In technical analysis of securities trading, the stochastic oscillator is a momentum indicator that uses support and resistance levels. Dr. George Lane developed this indicator in the late 1950s.[1] The term stochastic refers to the point of a current price in relation to its price range over a period of time.[2] This method attempts to pre
FREE

Esse indicador mede o 1º Canal de referencia e a 1º Zona Neutra * configurar o canal macro para verificar a frequencia MAIOR H1 H4 1D * configurar o canal micro para verificar a frequencia Menor 1M 5M 15M Como instalar o Indicador fimathe. E uma pré mentoria tem uma estrategia Secreta bonus nesse video . assitao o video para enteder as logicas que podemos iniciar com esse indicador.
https://www.youtube.com/playlist?list=PLxg54MWVGlJzzKuaEntFbyI4ospQi3Kw2
FREE

Cross MA Optimiser – Fine-Tune Your Moving Average Strategies in MT4! In the fast-moving world of trading, moving average crossovers are a proven method for identifying trends and trade entry points. However, using the wrong settings can lead to missed opportunities and inefficient strategies. Cross MA Optimiser takes the guesswork out of moving average optimization by automating and fine-tuning your crossover parameters for maximum trading accuracy. Whether you trade with Simple Moving Aver
FREE

This indicator displays each bar's volume in points as a histogram. The second version of the indicator. Now it is represented as an oscillator. It is more informative and functional. At that it does not load the main chart. GitHub It displays: bar's volume in points as a histogram (buffer 0) average value of the volume for the whole period (buffer 1) bars upper than the client average value with another color (buffer 2) average value of the amount of bars set by a user (buffer 3) Also: setting
FREE

Indicator defines the buy and sell arrows with high performance and consistent results . Automatic analysis of market opportunities ; Identifies a direction of a trend; Suitable for trend trading or following the trend;
This is FREE demo version of the indicator and works only on "EURUSD M5".
Forex Trend Commander full version: All details about the indicator here : Works in all symbols + free Multi Currency Scanner + free SPECIAL BONUS .
FREE
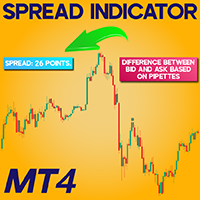
Spread Indicator download For Meta Trader 4
The Spread Indicator on MetaTrader 4 (MT4) serves to reveal the real-time gap between the Bid and Ask values. This variance, calculated in points (pipettes), appears clearly at the upper-left section of the chart window. «Indicator Installation & User Guide»
MT4 Indicator Installation | Spread Indicator Download for MT5 | ALL Products By TradingFinderLab | Best MT4 Indicator: Refined Order Block Indicator for MT4 | Best MT4 Utility: Trade
FREE
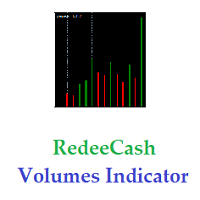
Version History : Date Version Changes 6/20/2022 1.00 Initial release 6/21/2022 1.10 Add global variables for Minimum (SYMBOL_volume_min) and Maximum (SYMBOL_volume_max) History Volumes Description : RedeeCash Volumes Indicator is the Volumes indicator that you have come to trust for market entry and exit with the added benefit of exposing key metrics as global variables. Including global variables in an indicator permits easier interaction with expert advisors (EA) and scripts. When attaching
FREE
Optimal Trailing TP インジケータは、エントリーツールと利益確定ツールの両方とし て機能します。そのユニークなデザインにより、買いシグナルと売りシグナルを提供することができます。すでにポジションを持っている場合は、シグナルの矢印を無視することができます。ポジションを持っていない場合、矢印は、インジケータが設定されている時間枠または通貨ペアでその方向への動きを警告することができます。したがって、シグナル矢印を利用してエントリーし、反対側の矢印でエグジットすることもできますし、反対側のシグナルを利用して既存の取引を終了することもでき、利益を追うことができます。矢印は素晴らしいエントリーシグナルであり、印刷された後に再描画されたり、薄くなったり、どのような形でも変化することはありません。すべてのタイムフレームで機能し、スキャルパーとスイングトレーダーの両方に効果的です。たとえあなたが初心者トレーダーであっても、"小さな損失と大きな勝利 "というシンプルかつ非常に強力な原則に従うため、利益を上げることができます。それは、市場がトレンドにあるとき、市場の正しい方向にあなたを保つ
FREE
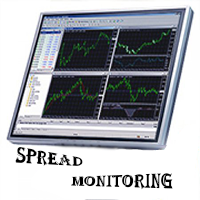
Spread Monitoring is a unique product for analyzing a spread. Unlike most similar indicators, Spread Monitoring uses ticks rather than bars allowing you to detect abnormal spread expansions. Features
Works on ticks rather than bars. Simple and easy indicator configuration. Works on all timeframes. Works on any financial instrument. No repainting.
Parameters
Total - number of displayed ticks. clrSpread - indicator line color.
FREE

こちら のMQL5コミュニティのKoala Trading Solutionチャンネルに参加して、最新のシグナルやKoalaのすべての製品に関するニュースを入手しましょう。参加リンクは以下にあります: https://www.mql5.com/en/channels/koalatradingsolution 説明 :
外国為替市場(PSAR)で専門的で人気のあるインジケーターの1つに基づいた新しい無料インジケーターをご紹介します。このインジケーターは元のパラボリックSARインジケーターの新しい変更です。プロSARインジケーターでは、ドットと価格チャートのクロスオーバーを見ることができます。クロスオーバーはシグナルではありませんが、動きの終わりの可能性について話します。新しい青いドットで購入を開始し、最初の青いドットの1 atr前にストップロスを配置し、最後にドットが価格チャートを横切るとすぐに終了できます。
売買シグナルを開く方法は? 最初の青い点によるオープンバイトレードと最初の赤いドットによるオープンセルトレード
正しいストップロスはどこにありますか? 安全なストップロ
FREE

Detailed post explained:
https://www.mql5.com/en/blogs/post/759269
This is a slope indicator for Bollinger Bands indicator. It provides slopes for BB top band, center band (main) and Lower Band. You can also set a threshold value for Center line to control Red/Green slope histogram lines. Settings:
You can choose which line you need the slope and Threshold Alerts for in Drop down.
Slope Thresholds: for Alerts. Please note that Alerts only happen when Threshold is crossed. e.g.: If Threshold
FREE

Supreme Direction is an indicator based on market volatility , the indicator draws a a two lined channel with 2 colors above and below price , this indicator does not repaint or back-paint and signal is not delayed. how to use : long above purple line , short below golden line. Parameters : channel period ========================================================
FREE

RaysFX EMA Crossover Scopri i potenziali punti di inversione del mercato con l’indicatore di Crossover EMA di RaysFX. Questo indicatore utilizza una combinazione di due medie mobili esponenziali (EMA) - una più veloce e una più lenta - per identificare i possibili punti di ingresso e uscita. Caratteristiche principali : Due EMA : Utilizza una EMA più veloce e una più lenta per catturare i movimenti di mercato a breve e lungo termine. Segnali di crossover : Genera un segnale quando l’EMA più v
FREE

Commodity Channel Index and Moving Average [CCI MA] A combination of CCI and MA to create a crossover trading setup Input parameters: signal mode: set it to true if you want to plug it into STAT (Signal Tester and Trader) arrow shift: distance between fast EMA line to arrow on chart price line filter CCI period CCI price method Moving average period Averaging method upper level lower level You can find the best setting for 4 hour EURUSD on this video
FREE

TH3ENG CURRENCY STRENGTH SCANNER The best currency strength reader based on more than 4 excellent modes, based on Price action and Volume with various algorithms. This indicator reads all pairs data to measure and find the best results of all currencies and arrange it in a separated dashboard panel.
You can find the strongest currency and the weakest currency, then trade on them pair. NOT COPLICATED NOT REPAINTING NOT LAGING
Input Parameters
=== SYSTEM SETTING === Calc. Mode ==> Calculation m
FREE

MQLTA Candle Timer is an indicator that can show you the details about a symbol/pair and alert you before the close of a candle. Used in swing trading and not only, it can help your strategies knowing and be ready before the close of a candle.
How does it work Simply add the indicator to the chart and set the notifications options. You can load a minimalistic interface or a full interface. The alert will be sent once per candle.
Parameters All the parameters, that you can see in the picture, a
FREE
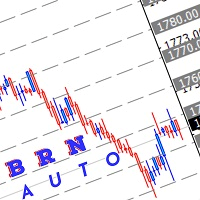
Use this indicator to draw multiple horizontal line to nearest round number Range for round number can be adjust manually depend how user want to use it Selection of colour also can be adjust manually Hope this indicator can help somebody in their trading.
How to use this: Mostly I use this indicator for break, retest and entry. example:- current price XAUUSD :1740.00 which mean the closest level are 1750.00 and 1730.00 Wait for price to break this level. then wait for retracement if price maki
FREE

StarBody è un indicatore istogramma che rappresenta la dimensione delle candele in relazione al loro volume ed evidenzia quelle più grandi delle precedenti. La formula per il calcolo dell'altezza dell'istogramma è semplice quanto efficace: Ampiezza * Volume La grafica indicherà tutte le candele più estese delle precedenti in base alle impostazioni scelte.
L'indicatore può essere utile, a volte indispensabile, nelle strategie che prevedono lo sfruttamento della continuazione del trend. Le strate
FREE

LotSize Indicator Discover the appropriate lot size to use in your trades based on the available margin. This indicator provides valuable information for risk management. If the indicator shows a value of 0, it means that your balance or available margin is insufficient for trading. It is important to maintain adequate margin levels for safe trading practices. This indicator is exclusively designed for the MT4 platform, a popular and reliable trading platform in the market. With the LotSize Indi
FREE

A powerful trend analysis tool for traders of all levels Super Trend Analyzer is a technical analysis tool that uses the Relative Strength Index (RSI) and Moving Average (MA) indicators to identify trends in the market. It is a versatile tool that can be used by traders of all levels of experience.
How does it work An uptrend begins when the main trend line and the auxiliary trend line cross from below and the lower minor oscillator is on the rise. A downtrend begins when the main trend line an
FREE

Indicador "Trade Zones: Supply and Demand Opportunities" para MetaTrader: Eleva tu Trading con Precisión Estratégica El indicador "Trade Zones: Supply and Demand Opportunities" es una herramienta revolucionaria diseñada para potenciar la toma de decisiones de los traders al identificar claramente las zonas de oportunidad basadas en los principios fundamentales de oferta y demanda. Este indicador, compatible con MetaTrader, proporciona una visión intuitiva de las áreas críticas del mercado donde
FREE

Draws Daily, Weekly and Monthly pivots and the respective supports and resistances levels (S1, S2, S3, R1, R2, R3). Ideal for placing stop losses and/or using as a break-out strategy. Features Unlike other pivot indicators in market you get very clean charts. Pivot levels are plotted irrespective of timeframe, on which you trade, i.e. M1, M5, M15, M30, H1,H4 or Daily timeframes. Pivot levels do not change when you change timeframe. Fully customizable options. If you are looking at Fibonacci
FREE

Percentage Profit/Loss Indicator for MetaTrader 4 The Percentage Profit/Loss Indicator for MetaTrader 4 (MT4) displays the percentage impact of open trades’ profit or loss in relation to the account balance. It provides a clear overview of how current open trades influence the overall account balance. Functionality Calculates the total profit or loss from all open orders. Computes the profit or loss percentage as follows: Profit Percentage = (Total Open Orders Profit or Loss / Account Balance)
FREE

The indicator shows the Fibonaccia golden ratio levels and the price balance line Has three different sensitivity options Allows you to visually navigate what state the market is in and where trend reversals are possible Works on all timeframes, on any currency pairs, metals and cryptocurrencies Can be used when working with binary options Distinctive features Based on the golden Fibonacci value; Determines the balance line of price equilibrium Has three different sensitivity settings; Simple an
FREE
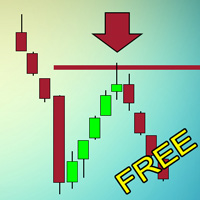
Индикатор, который ищет качественные точки входа в рынок и отображает их в виде стрелок. Действует по сложному алгоритму. Сначала ищет на графике специальные уровни, которые обязательно должны быть пробиты импульсом. Если цена возвращается к этому уровню в виде свечи с длинной тенью и маленьким телом и касается уровня только тенью - возникает точка входа. Не перерисовывается! Лучше всего выглядит и отрабатывает на Н1.
Может использоваться как: Индикатор уровней, где цена будет останавливат
FREE

この指標は、他のチャート指標に関連するチャネルを作成します: 指標 + ATR および指標 - ATR .価格がベースラインから上がりすぎていないかどうかを知るのに役立ちます。 ATR レベルは乗数で調整できます。 このバージョンは、MT4 の制限の一部を回避するために、対応する MT5 よりも複雑です。ベースラインの name 、 パラメーター (コンマで区切られた文字列)、および buffer を導入する必要があります。ベースラインに必要なすべての値が 1 つ のバッファーのみに含まれていることを確認してください (または、複数のインスタンスを配置する必要がある場合があります)。
ベースラインの文字列パラメータ はサポート されていません。導入された値に関係なく、デフォルト値が常に使用されます。 列挙子の場合は、その位置を使用します (ほとんどの場合、0 から始まります)。たとえば、MA モードの場合: sma=0;絵馬=1;スマ=2; lwma=3
利点として、このインジケーターは元のベースラインも表示するため、3 つの線すべてが同じインジケーターに表示されます。特別な名
FREE

The ' Average Bar Chart ' indicator was created to showcase the traditional Heiken Ashi calculation as an exotic charting style. This indicator is known for reducing chart noise for a smoother price action. A dditional indicators are recommended
Key Features Candlesticks for OHLC are removed from the chart. Average bars may be shown as complete bars without tails. All functionality and features of this exotic chart are inputs.
Input Parameters Chart Timeframe = PERIOD_CURRENT; - period to set
FREE
D1 Free Fibo Channels with support and resistences...
Become a constantly profitable 5-star forex trader!
We offer a few indicators to support you understand and analyse the market! With our strategies you will improve your trading system and bacome an expert...
We have indicators for trend direction, market direction and others.. for multi-time frames and that covers all majors or your favorite trading symbols! Some of them offer a customizable calculation parameters... or Graph features!
FREE

QuantumAlert CCI Navigator is a free indicator available for MT4/MT5 platforms, its work is to provide "alerts" when the market is inside "overbought and oversold" regions in the form of "buy or sell" signals. This indicator comes with many customization options mentioned in the parameter section below, user can customise these parameters as needful. Join our MQL5 group , where we share important news and updates. You are also welcome to join our private channel as well, contact me for the pri
FREE

Check out other great products from https://www.mql5.com/en/users/augustinekamatu/seller
This indicator finds the entry points based on divergences of common indicators and does not repaint . The principles used ensure that it can be used on CFDs, Commodities and Stock with incredibly great results. With proper money management and portfolio balancing the Indicator can be applied to any trading strategy to generate consistent profits. A Winning Trading Strategy This article describes the com
FREE
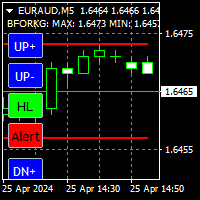
Very useful indicator, you won't be able to be without it. Essential for scalping. It shows rebound levels, top and bottom, forming a fork that surrounds the price. Each level has two blue controls associated to change it, has one green control for rebound mode: High/Low or Open/Close, and has a red breakage alert control. Features: -T wo independent modes of operation: High/Low, Open/Close. -When one level is broken it shows the next one in the same direction. -The levels closest to the pric
FREE

The indicator allows you to trade binary options. The recommended time frame is М1 and the expiration time is 1 minute. The indicator suitable for auto and manual trading. A possible signal is specified as a arrows above/under a candle. You should wait until the candle closes! Arrows are not re-painted Trade sessions: TOKYO section (Half end) and LONDON section (First half) Currency pairs: EUR/USD Working time frame: M1 Expiration time: 1 minute. The indicator also shows good results when using
FREE

Fractals ST Patterns is a modification of Bill Williams' Fractals indicator. Unlike a standard Fractals indicator, Fractals ST Patterns allows setting any number of bars to find a fractal. This simple indicator corresponds to the parameters specified in the ST Patterns Strategy ( https://stpatterns.com/ ) . Structural Target patterns are the market itself, which is consistently divided into components. For the formation of ST Patterns , no trend lines, geometric proportions of the model itself,
FREE

This indicator draws regular bullish and bearish divergences in real-time onto the charts. The algorithm to detect those divergences is based on my 10+ years experience of detecting divergences visually. The divergences are drawn as green and red rectangles on the charts. You can even do forward testing in the visual mode of the strategy tester. This FREE Version is restricted to EURUSD and GBPUSD. The full version without restrictions is here: https://www.mql5.com/en/market/product/42732
Param
FREE

パンダオシレーターは、スキャルピングのために設計された新しい著者の指標です。
標準的な、専有用具の全範囲の読書に基づいて信号を与える表示器。
パンダ発振器の主な特長: 分析関数
これは、任意の通貨ペアと時間枠で使用することができます; インジケーターは再描画されません; それは他の指標に大きな追加です; グラフィカルな機能
チャート上の最小位置数を占めています; 柔軟性のあるチンキ; 簡単に学ぶことができます; パンダオシレーターはで構成されています。..
青い線はRSIインジケータです; オレンジ色のラインは、T3RSIに基づく統合RSIインジケータです; 点線はボリンジャーバンドの境界である(図参照)。 6) 青い線はボリンジャーバンドの中央線です; パンダ発振器の主な特長
フィルタリングのための指標のセットを持っています; 指標自体は、いつ市場に参入する必要があるかを示しています;
パンダオシレーターの基本設定: RSI期間-RSIの青い線を設定する;
バンド期間-点線の調整;
MA期間-移動平均の設定;
バンド偏差-バンド偏差;
バンド
FREE

SmartChanelFree is a universal indicator for all types of markets. This indicator should have in its arsenal every trader, since it represents a classic approach to analyzing the price of a trading instrument and is a ready-made trading strategy. The indicator forms the upper, average price movement limit. Attention !!! This version of the indicator is trial and works only on the chart with the period M1. The full version of the indicator can be found at: https://www.mql5.com/en/market/product/
FREE

The standard RSI indicator is very helpful in identifying overbought or oversold areas during a flat, but gives a lot of false signals when the market is trending. For example: during an uptrend, the standard indicator often enters the "oversold" zone and extremely rarely (most often, when the trend has already ended) enters the "overbought" zone. This indicator takes into account the trend movement and, with the selected settings, can enter the zone opposite to the trend direction, giving a sig
FREE

CCI Trend Finder indicator with different colors at levels 0, 100 and -100. The cross is a signal for "123 Exit" as presented by MPlay and used in Woodies CCI system. This exit signal is effective especially in short-term breakout trades, because it prevents early exiting at small corrections. This indicator is great for having it as an extra tool for your analysis.
FREE
FREE Spread indicator for MetaTrader 4 this indicator includes: -average spread -current spread -minimum spread -maximum spread
If you are interested in my products I recommend you visit my page where you can find: Experts Advisors: https://www.mql5.com/it/market/product/119456?source=Site+Profile indicators: https://www.mql5.com/it/market/product/120038?source=Site+Profile
I hope the spread indicator will be useful to you.
https://www.mql5.com/it/users/kappa05
FREE
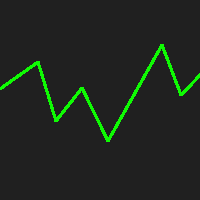
This indicator displays the historical spread values on the chart. This is an extremely useful tool for watching the spread rise and fall, allowing you to enter the market at just the right time. This indicator will help you stay out of the market when the spread begins to rise and help you get into the market as the spread begins to fall again.
ON SALE FOR FREE, GET IT FREE FOR A LIMITED TIME ONLY
FREE

This indicator includes various types of moving averages. The indicator contains the following set of moving averages: CA (Cumulative Moving Average) MIN (Minimum for the period) MAX (Maximum for the period) SMA (Simple Moving Average) EMA (Exponential Moving Average) DMA (Double exponential moving average) TMA (Triple exponential moving average) LWMA (Linear Weighted Moving Average) SMM (Simple Moving Median) SMMA (Smoothed Moving Average) HMA (Hull Moving Average) NoLagMa The list of moving av
FREE

Информационная панель, которая выставляет уровни покупки продажи и цели для профита на текущий день. Уровни рисуются согласно движению валюты за вчерашний день. Панель вмещает в себя информацию о валютной паре, тенденции на рынке, время до закрытия бара, управление капиталом, рекомендуемый лот, профит в пунктах, а также уровни для покупки и продажи инструмента. Для заключения сделок использовать только отложенные ордера на пробой. Входные параметры Lots - установить текущий лот Risk - риск в про
FREE

TickChartOscillator is an indicator that displays a symbol's tick chart in an oscillator subwindow. It offers flexible customization options, including: · The ability to hide the price line in the oscillator. · The option to specify a different symbol for tick chart display. If the "Symbol" parameter is left blank, the tick chart will be shown for the current symbol where the indicator is applied. This tool is perfect for traders who want to view tick dynamics in an oscillator format and u
FREE

バランスエントリー by VArmadA
シンプルでありながら強力なフラクタルベースの支持/抵抗インジケータ
1H以上のタイムフレームで動作し、すべての主要なペアでテストされています。シグナルに注意してください。長いか短いエントリを示す矢印。
それはどのように動作します。
矢印は、サポート/レジスタンスを反転させたことを示しています。上矢印はロングを意味します - 下矢印はショート取引を示しています。
インストラクション.
- インジケータロング/インジケータショート:与えられたインジケータの矢印の色を選択します。
- 抵抗レベルを表示します。エントリーシグナルを決定するために使用される抵抗レベルを視覚化します。
- サポートレベルを表示します。エントリーシグナルを決定するために使用されるサポートレベルを視覚化します。
FREE

When prices breakout resistance levels are combined with Larry Williams' Percentage Range "WPR" oscillator breaks out its historical resistance levels then probability emerges to record farther prices. It's strongly encouraged to confirm price breakout with oscillator breakout since they have comparable effects to price breaking support and resistance levels; surely, short trades will have the same perception. Concept is based on find swing levels which based on number of bars by each side
FREE

Introduction and Description
Colored candlesticks showing the trend based on two moving averages and the slope of the slow moving average. A trend is the overall direction of a market or an asset's price. In technical analysis, trends are identified by trendlines or price action that highlight when the price is making higher swing highs and higher swing lows for an uptrend, or lower swing lows and lower swing highs for a downtrend. Many traders opt to trade in the same direction as a trend, whil
FREE

This indicator shows the strength of each currency compared to the US dollar by calculating the rate of change in price over a specified time period. When you open the indicator, you'll see a list of different currencies on the price chart. Each currency will have a numerical value indicating its strength level compared to the US dollar, where: If the value is higher than the US dollar, it will be displayed in green, meaning that currency is stronger than the dollar. If the value is lower than
FREE

This indicator compares the price changes during the specified period for the current symbol and other reference symbol. It allows to analyze the similar movements of highly correlated symbols, such as XAUUSD and XAGUSD, and find their occasional convergences and divergences for trading opportunities. The indicator displays the following buffers: light-green thick line - price changes of the current symbol for TimeGap bars; light-blue thin line - price changes of the reference symbol ( LeadSymbo
FREE

取引を強化し、新しいRSIスキャナーのバージョンでさらなる興奮を追加しましょう! 自動的なインストゥルメントのグループ化 : スキャナーは、マーケットウォッチからすべてのインストゥルメントを自動的に収集し、主要(Majors)、副次(Minors)、エキゾチック(Exotics)、その他(Others)の4つのカテゴリに整理します。 カスタマイズ可能な信号選択 : 設定ページで、信号をスキャンしたいインストゥルメントを選択できます。 柔軟な時間枠の選択 : 信号を監視したい時間枠を指定することもできます。 RSIパラメータの設定 : RSIパラメータ(期間と適用価格)を簡単に設定し、売買レベルを定義できます。現在のキャンドルデータを使用するか、キャンドルが閉じるのを待ってから信号を処理するかを選択できます。 個別のカラーカスタマイズ : 前景、背景、買い矢印、売り矢印の色をカスタマイズできます。スキャナーは、各要素の色を自動的に調整して、視覚的に魅力的なインターフェースを作成します。 矢印タイプの選択 : 好みに合わせてさまざまな矢印タイプを選択できます。 リアルタイムアラート : 選
FREE

EMA Separation plots 2 exponential moving averages, and a fill between them. The fill is colored differently according to an uptrend (short period EMA above long period EMA), or a downtrend (short period EMA below long period EMA). This is a small tool to help visualize the difference between long and short period averages. We hope you enjoy! EMA Separation can also be paired with our free EMA Separation Coefficient
Parameters Short period (Default=10): # bars used to calculate short period EMA
FREE

Traditional RSI is one of the most popular and must-known indicator that every traders would use. In this combination, we use two RSI period with smoothed factor to smooth the RSI lines for better results. Besides, bottom of Indicator is the Trend-filter display in different colors in order to let Traders identify the trends much easier Grey : Sideway market Light-Blue : Weak UP-Trend Blue : Strong UP-Trend Light-Red : Weak DOWN-Trend Red : Strong DOWN-Trend Signal: Blue-Arrow
FREE
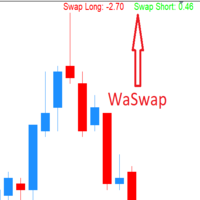
WaSwap MT4 Indicator shows the current Swap Long and current Swap Short with color.
* Set the Swap Threshold and the color to identify when the current swap is below or above the Spread Threshold.
* Set X axis and Y axis and chose the Corner and the Anchor to position the Swap Label on the chart.
* Write the font and the font size for more confort.
* Activate alert if the current Swap Long or the current Swap Short is below the swap threshold.
* The user will never swing with a negative sw
FREE
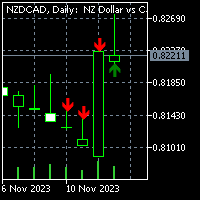
For MT5 version please click here . Introduction Most traders use candle patterns as a confirmation tool before entering a trade. As you know there are lots of candle patterns out there. However I realized most of them can be generalized in simple rules. So I developed my own candle pattern(Although I cannot say for sure this is mine). pattern description The pattern consists of three consecutive candles. This is true for most of the patterns out there (considering there is a confirmation nec
FREE

Th3Eng HistoMaster indicator Free Histogram Indicator to detect the current trend direction. The indicator is based on CCI indicator. Also draw arrows when it detect the trend is strong buy or strong sell, with Alerting system (Popup with sound, Email alerting and mobile notification). Also draws a dashboard shows all Time-Frames' current signal.
Requirements
works with all pairs, stocks, CFDs and crypto currencies. works with all Spreads works with all Account types works on all Time-Frames
FREE
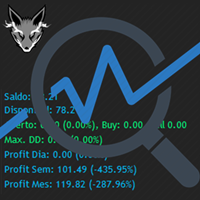
Track your overall trades! Monitor New Fox is an excellent indicator, which displays your current profits, being them monthly, weekly, and daily, that is, all profits obtained when you opened the mt4. Our brand new Monitor New Fox indicator is able to unlock all advanced features of MetaTrader 4. This indicator can graph with simple data key meta trader account data (Balance, Equity, Free Margin, Current Profit/Loss, Profit/Loss total, amount of open position(s) and size, etc.) and all this in a
FREE

This indicator provides trading signals based on the polarity of the dynamical parameters of two digital signals. The dynamical parameters (momentum-acceleration) are derived by applying a high quality momentum oscillator, MTEMA LPD ( see Top Gun Oscillators ) to two digital signals. The MTEMA momentum oscillator is first applied to the price itself. Then, a rectification procedure is applied to the price based on the signals from the momentum oscillator yielding a rectified price signal. This s
FREE

The Trend Finding Channels indicator was developed to help you determine the trend direction by drawing channels on the graphical screen. It draws all channels that can be trending autonomously. It helps you determine the direction of your trend. This indicator makes it easy for you to implement your strategies. The indicator has Down trend lines and Up trend lines. You can determine the price direction according to the multiplicity of the trend lines. For example , if the Down trend lines s
FREE

The median indicator is a type of technical analysis tool commonly used in forex trading. It is based on calculating the median price of a currency pair over a specific period of time. The median price is the middle value between the high and low prices. Compared to the widely used moving average (MA) indicator, the median indicator offers a unique perspective on the market. Here are some advantages of using the median indicator: Robustness to outliers: The median is less affected by extreme pr
FREE
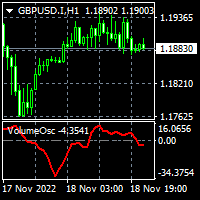
To download MT5 version please click here . The Volume Oscillator measures volume by analyzing the relationship between two Moving Averages. The Volume Oscillator indicator subtracts a fast MA from slow MA. The fast and slow MA periods are configurable via input tab. Volume indicators are an ingredient of trading systems to avoid entry in thin liquidity markets. Having set a threshold on Volume Oscillator you can avoid entering chop. Buffers are available to access via EA.
FREE
The indicator determines overbought/oversold zones on various timeframes. Arrows show market trend in various time sessions: if the market leaves the overbought zone, the arrow will indicate an ascending trend (arrow up), if the market leaves the oversold zone, the arrow will indicate a descending trend (arrow down). Situation on the timeframe, where the indicator is located, is displayed in the lower right window. Information on the market location (overbought or oversold zone), as well as the
FREE

A flexible 2-Line MACD indicator The default MACD indicator inside MT4, limits you to using the MACD with a fast-EMA, slow-EMA, and signal-SMA. This MACD indicator allows you to set your own MA-Method choices for these 3 components, separately! You can select from SMA-EMA-SMMA-LWMA, and can even use a separate method for each 3 fast-slow-signal periods. A more featured version is available with colored candles+conditions, full alerts+conditions, line coloring, DEMA and TEMA options; MACD MAX
Fe
FREE
This indicator is used to measure bullish and bearish candles on each time frame and I provide notifications for reminders
Indikator ini digunakan untuk mengukur bullish dan bearish candle pada setiap time frame dan saya berikan notifikasi untuk pengingat
This indicator is used to measure bullish and bearish candles on each time frame and I provide notifications for reminders
FREE
Индикатор Free Pro Level предназначен для автоматического построения уровней поддержки и сопротивления. Преимущества индикатора: подходит как для опытных трейдеров, так и для новичков; простота в использовании; уровни не перерисовываются; вероятность реакции цены при касании уровня более 80%; бесплатный. Индикатор Free Pro Level имеет всего 5 пунктов входных параметров: Минимальная длина свечи в пунктах по 5 знаку - основной параметр, на основании которого происходит анализ и поиск уровней по
FREE

QuantumAlert RSI Navigator is a free indicator available for MT4/MT5 platforms, its work is to provide "alerts" when the market is inside "overbought and oversold" regions in the form of "buy or sell" signals. This indicator comes with many customization options mentioned in the parameter section below, user can customise these parameters as needful. Join our MQL5 group , where we share important news and updates. You are also welcome to join our private channel as well, contact me for the pri
FREE

Dynamic MA Trend Zone – Dynamic Moving Average Trend Zone
The Dynamic MA Trend Zone is a visually compelling indicator that dynamically tracks changes in market trends. By displaying moving averages on three different price levels (close, high, and low), it creates a color-coded trend zone that clearly indicates the trend’s direction and strength.
Features and Functions:
- Trend Direction Color Coding: The indicator automatically color-codes the trend zones based on whether the candle’s clos
FREE
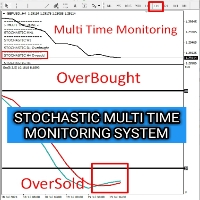
I’m thrilled to present the Stochastic Indicator, designed for multi-time frame monitoring! This tool allows you to effortlessly track Overbought and Oversold conditions in real-time, all on a single screen. My goal is for this indicator to support you in your analysis and help you capture those perfect trading moments using your own strategies. If you find this indicator helpful, I’d greatly appreciate your support by liking my channel and giving it a 5-star rating! Your feedback inspires me to
FREE
The purpose of this new version of the MT4 standard indicator provided in your platform is to display in a sub-window multiple timeframes of the same indicator. See the example shown in the picture below. But the display isn’t like a simple MTF indicator. This is the real display of the indicator on its timeframe. Here's the options available in the FFx indicator: Select the timeframes to be displayed (M1 to Monthly) Define the width (number of bars) for each timeframe box Alert pop up/sound/ema
FREE

Moving Average Rainbow Stack: Free: Single Currency & Single Timeframe MA Stack Very useful for finding current and higher timeframe trends. Best suited for long term trend based trading. Use fewer MAs for quick scalping. And not suitable during low volatility. Only use during high volatility and steady trending markets. Use this to enhance your existing Trend based strategies to find best trends.
Read detailed description https://abiroid.com/product/abiroid-ma-stack Available MTF and Scanner v
FREE
MetaTraderマーケットは、他に類のない自動売買ロボットやテクニカル指標の販売場所です。
MQL5.community ユーザーメモを読んで、取引シグナルのコピー、フリーランサーによるカスタムアプリの開発、支払いシステムを経由した自動支払い、MQL5Cloud Networkなど、当社がトレーダーに対して提供するユニークなサービスについて詳しくご覧ください。
取引の機会を逃しています。
- 無料取引アプリ
- 8千を超えるシグナルをコピー
- 金融ニュースで金融マーケットを探索
新規登録
ログイン