Guarda i video tutorial del Market su YouTube
Come acquistare un Robot di Trading o un indicatore
Esegui il tuo EA
hosting virtuale
hosting virtuale
Prova un indicatore/robot di trading prima di acquistarlo
Vuoi guadagnare nel Market?
Come presentare un prodotto per venderlo con successo
Expert Advisors e Indicatori per MetaTrader 5 - 61

RSI Robot Easy This fully configurable robot has the purpose of executing orders using the RSI indicator as a base. It is possible to choose whether the entries will happen when entering the overbought areas and / or when leaving the oversold area. It is possible to configure stoploss and takeprofit, as well as the maximum number of orders at a time.
Aurélio Machado.
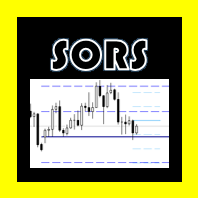
THE SORS COMPLEXES
This indicator is designed to draw the SORS lines on the graph, these are the modern way of calculating market points that it usually respects, they are comprised of supports and resistance, but unlike the classics, these are calculated from volatility endogenous and standard deviation,
In the configuration you can change the color of each level linear and hide the ones that are not needed.
A = Annual. M = Monthly. W = Weekly D = Daily.

Per favore lascia una valutazione di 5 stelle se ti piace questo strumento gratuito! Grazie mille :) La collezione Expert Advisor "Risk Management Assistant" è una suite completa di strumenti progettati per migliorare le strategie di trading gestendo efficacemente il rischio in varie condizioni di mercato. Questa raccolta comprende tre componenti chiave: consulenti esperti di media, commutazione e copertura, ciascuno dei quali offre vantaggi distinti su misura per diversi scenari di trading.
Q
FREE
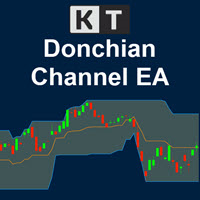
Il KT Donchian Channel Robot adotta una strategia efficace combinando la rottura del canale Donchian, la direzione dell’EMA e la misurazione della volatilità tramite l’ATR. Ingresso Long: Rottura banda superiore + EMA in salita + Volatilità in aumento. Ingresso Short: Rottura banda inferiore + EMA in discesa + Volatilità in calo.
Caratteristiche Funziona con qualsiasi broker o tipo di conto, senza problemi di compatibilità. Ogni trade è protetto da stop loss e take profit. Non utilizza tecniche

A Fibonacci Panel tool to facilitate your trading with Fibonacci indicator. Simple and easy to use! Magnificent Design (Adjustable) Sound Effects (This will make trading much more fun) Five Fibonacci Levels (freehand movable) Acoustic and graphic signals (adjustable for each level) Integrated narrow trading panel also with risk and money management If you need silence while trading, you can deactivate the sounds in the settings.
Parameter
Language English Magic number Commentary (for all posi
FREE

GoldRushX - Il Robot di Trading che Non Puoi Perdere Presentiamo GoldRushX, il tuo nuovo partner automatizzato per massimizzare i profitti sul mercato finanziario. Sviluppato basandosi su algoritmi robusti e convertito direttamente da Pine Script, GoldRushX è una soluzione completa per i trader che cercano efficienza, precisione e un avanzato controllo del rischio. Caratteristiche Principali: Bande di Bollinger e Medie Mobili: Con un calcolo preciso delle Bande di Bollinger, questo robot identif
This is a simple indicator that shows the spread in points. It is useful for those like trade scalper, in addition to be customizable.
Functions:
Color - I don't need to explain :) Font type - I don't need to explain :) Font size - I don't need to explain :) First text - text in front of spread number Second text - aditional text after the spread number. Corner - specify the corner where the spread will be written. Horizontal distance - horizontal distance from the edge. Vertical distance - ve
FREE
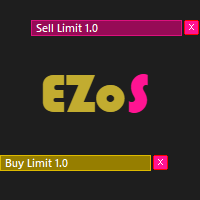
Easy Order Send help you to put your order on the chart using shortcuts keys like (SHIFT or CTRL). To send a order, hold CTRL or SHIFT and press left click mouse. It's a Beta version with features below: 1 - Send Buy and Sell order with SHIFT AND CTRL
2 - Cancel Button to your order
3 - Cancel Button to your position
4 - Move your order
5 - Monitor your Profit after trade on.
FREE

This indicator works by plotting fractals on the chart as arrows that can be used as buy or sell signals. It is a great tool for both new and experienced traders as it provides a clear visual representation of the market and helps traders identify fractals. Although it repaints, it can be used quite effectively in conjunction with other tools to filter trading strategies.
We use this indicator in this way in our Royal Fractals EA, which you can purchase on the MQL5 Market: https://www.mql5.com
FREE

Indicatore di monitoraggio della tendenza con filtro medio del segnale di ingresso
Questo indicatore funge da tracker e filtro di tendenza, utilizzando le medie mobili come segnali di ingresso. Le medie mobili sono fondamentali per determinare diversi orizzonti di tendenza:
- La media primaria standard su 200 periodi indica la tendenza a lungo termine. - La media secondaria a 50 periodi indica la tendenza a medio termine. - La media terziaria a 20 periodi indica la tendenza più breve. - La me
FREE

The utility is a checklist where you can write all the rules of your trading system and keep it on the chart in front of your eyes. As a rule is executed, mark it with a tick. To the right of each rule, you can write the "strength" (percentage) of the rule. And if there is a tick next to the rule, then all "forces" are summed up in the "Total" line.
For the convenience of visual perception, you can set the color for displaying the “Total” value.
Panel options: Title - The title of the panel N
FREE

Sblocca la Precisione del Trading con Koala FVG Scalper - La Tua Soluzione per lo Scalping Multi-Valuta Scopri l'innovativo Koala FVG Scalper, un consulente esperto progettato per sfruttare il concetto di Qualified FVG (Fair Value Gap). Aumenta il tuo trading con questo innovativo EA di scalping, integrato senza soluzione di continuità con l'indicatore Koala FVG, disponibile gratuitamente qui . Principali Vantaggi: Alta Precisione: Raggiungi oltre l'80% di previsioni corrette nel frame temporale

This indicator shows the strength of each currency compared to the US dollar by calculating the rate of change in price over a specified time period. When you open the indicator, you'll see a list of different currencies on the price chart. Each currency will have a numerical value indicating its strength level compared to the US dollar, where: If the value is higher than the US dollar, it will be displayed in green, meaning that currency is stronger than the dollar. If the value is lower than t
FREE

Ultimate Double Top Scanner (Multi Pair And Multi Time Frame) : ---LIMITED TIME OFFER: NEXT 25 CLIENTS ONLY ---46% OFF REGULAR PRICE AND 2 FREE BONUSES ---SEE BELOW FOR FULL DETAILS Any major price level that holds multiple times, is obviously a level that is being defended by
the large institutions. And a strong double top pattern is a clear indication of institutional interest.
Double top patterns are widely used by institutional traders around the world. As they allow you to manage
yo
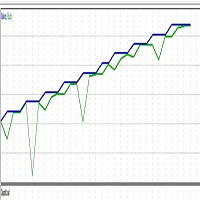
Trading is a skill where you can have your own skill and your own process. So, he advice that you try do what work for you. Trading is not a get rich quick scheme. when you stick to it long enough, it could change your live. Psychology and emotion is very important. Taking basic long and short trades automatically based on MACD and bear power. The robot is a test project by chrisdgenius aim to increasing profitablility.
FREE

Displays a USD DXY chart in a seperate window below the main chart. YOUR BROKER MUST HAVE THESE SYMBOLS FOR THE INDICATOR TO WORK Based on EUR/USD, USD/JPY, GBP/USD, USD/CAD, USD/CHF and USD/SEK All these pairs must be added to Market Watch for the indicator to work correctly As this is calculated using a formula based on the 6 pairs it will only work when the market is open.
YOUR BROKER MUST HAVE THESE SYMBOLS FOR THE INDICATOR TO WORK
Displays a USD DXY chart in a seperate window below the m
FREE

Volume Break Oscillator è un indicatore che abbina il movimento dei prezzi con le tendenze del volume sotto forma di oscillatore.
Volevo integrare l'analisi del volume nelle mie strategie, ma sono sempre stato deluso dalla maggior parte degli indicatori di volume, come OBV, Money Flow Index, A/D ma anche come Volume Weighted Macd e molti altri. Ho quindi scritto questo indicatore per me stesso, sono soddisfatto di quanto sia utile e quindi ho deciso di pubblicarlo sul mercato.
Caratteristiche

The indicator shows Jake Bernstein's MAC (Moving Average Channel) System signals ---------------------------------------- System assumes several types of entering in trade, in this indicator only one type implemented - on closing of second trigger bar. It is recommended to start using this indicator together with Jake Bernstein's free lessons https://www.youtube.com/@JakeatMBH/videos Arrow shows signal bar - enter on closing or on opening of the next bar, cross - stop level, dot - minimum profi
FREE
This is a tool that helps you calculate potential slippage you may encounter in real trading. This is quite important to understand how slippage can affect your strategy. It helps you gain a better understanding of your trading system and compare slippage levels among different brokers. Simply add it to the chart of the symbol you wish to estimate slippage for.
FREE
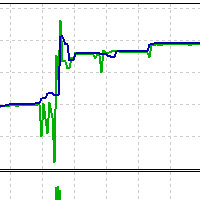
This strategy ensures significantly lower risk by employing advanced techniques and AI-driven filters to identify only the highest quality setups on a 1-minute timeframe. Configurations Based on Investment: $100 : Utilize an FBS broker cent account to convert $100 to $10,000 (cents). $1,000 : Apply a 0.25 lot size using the precise configurations detailed in the provided screenshot. $10,000 : Execute trades with a 10 lot size, adhering strictly to the specified configurations. $100,000 : Operat
The Complex Chaos EA is an automated system that uses a pair of exponential moving averages to detect the market direction and opens trades on candle open. If the market moves against a trade it will at a set distance open another trade in the same direction to move the take profit of the group of open positions closer to the current price and make the group of trades winners overall once the price reverses. If a change in direction is detected then all trades are closed and it starts trading in
FREE

Highly configurable OBV indicator.
Features: Highly customizable alert functions (at levels, crosses, direction changes via email, push, sound, popup) Multi timeframe ability Color customization (at levels, crosses, direction changes) Linear interpolation and histogram mode options Works on strategy tester in multi timeframe mode (at weekend without ticks also) Adjustable Levels Parameters:
OBV Timeframe: You can set the lower/higher timeframes for OBV. OBV Bar Shift: Y ou can set the offset
FREE

ATR Accelerator Indicator informs you about strong price movements based on the ATR Indicator. This Indicator works for all Timeframes and Symbols, the strength of movements can be configured.
Important: Get informed about new Products, join our MQL Channel: https://www.mql5.com/en/channels/etradro
Useage This Indicator works for all Timeframes and Symbols, the strength of movements can be configured. Features works on all timeframes and forex pairs or indices. Alert and Notify function inc
FREE
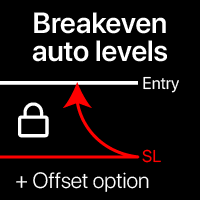
Livelli automatici di break-even Utilizzando questa utility, puoi attivare lo spostamento automatico dello SL, quando il trade raggiunge un profitto desiderato. Particolarmente importante per i trader a breve termine. È disponibile anche l'opzione offset: parte del profitto può essere protetta. Utility multifunzione : 66+ funzioni, inclusi questo strumento | Contattami per qualsiasi domanda | Versione MT4 Processo di attivazione della funzione automatica di break-even: 1. Seleziona il Simbolo o

An Fast Bucks MT5 Expert Advisor combines the power of indicators and moving averages to create a robust trading strategy within the MetaTrader 5 platform. This expert advisor utilizes the Moving Average indicator in conjunction with a custom indicator (let's call it "CustomIndicator Expert Advisor") for enhanced decision-making in trading.
The Moving Average indicator serves as a foundational tool, offering insights into the market trend and potential entry/exit points based on the moving ave
FREE

This indicator is designed according to the combination of WPR and Stoch indicators, when WPR goes up and Stoc goes up quickly too, the price may meet strong resistance, many times short order will take profit, but if the price break through it, Long positions are more likely to be profitable, and the reverse held true as well. You can adjust the parameters of WPR and Stoc to Adapt the symbol you operate. Click here to look the advanced edition: https://www.mql5.com/en/market/pro
FREE

Free version. Only works on EURUSD Do you want to always know in a quick glance where price is going? Are you tired of looking back and forth between different timeframes to understand that? This indicator might just be what you were looking for. Trend Signal Multitimeframe shows you if the current price is higher or lower than N. candles ago, on the various timeframes. It also displays how many pips higher or lower current price is compared to N. candles ago. Number N. is customizable The data
FREE

Imbalance DOM Pro: Potenzia le tue operazioni con l'imbalance del book HAI ACCESSO AL BOOK SU MT5? VUOI PORTARE IL TUO TRADING A UN LIVELLO SUPERIORE? Se fai trading basato sul flusso degli ordini, Imbalance DOM Pro può rivoluzionare la tua analisi. Perfetto per scalper e trader a breve termine, questo strumento identifica gli squilibri nel book degli ordini, offrendo opportunità di trading preziose per entrate e uscite rapide e precise. Cogli opportunità nei piccoli movimenti di prezzo

The EU_H1_110155136_S_Bi_CF_SQ3 is an algorithmic trading strategy for MetaTrader, tested on EURUSD using the H1 timeframe from April 1, 2004, to April 24, 2024. There is no need to set up parameters, all settings are already optimized and fine-tuned.
Recommended broker RoboForex because of EET timezone.
You can find the strategy source code for StrategyQuant at the link: https://quantmonitor.net/eurusd-biggest-range-pulse/
Key details are:
Main Chart: Current symbol and timeframe Tradi
FREE
3つの時間軸を分析に使います。 3つの時間軸が、全て同じ方向になった場合、上昇方向または、下降方向になった場合 その方向にエントリーをします。 決済は、上記同様全て同じ方向になった場合、上昇方向または、下降方向になった場合 その方向に決済をかけます。
時間軸は、変数として定義されています。 移動平均も、各変数として定義されています。
基本的に、単発ポジションをもち、追加購入はしません。 途中決済は、手動で行うことも可能です。 その場合、EA内では、ポジションなしとして処理されます。
ロット数、利益確保、ストップロスも変数として設定できます。
使用する前に、最適化等を行ったほうが精度をあげてトレードできると思います。 また、100%任せきりにするのは、おすすめしません。
FREE

Purpose DG DayInfo is a free indicator that shows information about: Day's maximum prices; Day's minimum prices; Day's percentual variations; Daily candle direction (Up, Down or Flat); Candle timer; This way, DG DayInfo helps you to see day's maximum and minimum, check day's percentual variation and time left to close candle.
Key features Designed to be simple to use, with a few parameters Works in ALL pairs Works within ALL time frames*
Main Indicator Parameters Days - Set to how many days yo
FREE

CATAPULT This is a one-of-a-kind expert based on trend. It is based on the successful grid expert, with the help of a multilayer perceptron, the entry point has been refined. Several auxiliary proprietary indicators have been added. The Expert Advisor opens trades variably. How to use the EA
The EA has been optimized for the best performance. Just attach the EA to EUR/USD chart and let it operate by itself. All the required settings have been considered after careful back testing and live te
FREE

TradeSnap acquisisce e salva automaticamente lo schermo quando viene eseguito un ordine ACQUISTA/VENDI.
Basta impostarlo sul grafico e verrà salvato automaticamente senza alcun lavoro aggiuntivo.
Anche le linee, le frecce, ecc. sul grafico vengono salvate così come sono nell'immagine.
La dimensione dell'immagine che può essere 10000x10000 pixel, in modo da poter salvare un'immagine orizzontale che mostra la cronologia dei movimenti dei prezzi.
Informazioni sui parametri
--Parametro evento
FREE

Hedge Assistant - Hedge Assistant è un Expert Advisor (EA) intuitivo, progettato per semplificare le operazioni di copertura. Questo EA supporta due strategie di copertura: semplice e doppia. Per maggiori dettagli su queste strategie, consulta i video esplicativi disponibili sul nostro canale YouTube (link e immagini allegati). Funzionalità: Backtest: Non è possibile eseguire un backtest poiché gli ordini vengono eseguiti manualmente tramite i pulsanti del pannello, richiedendo l'intervento dir

WaveTrend 3D is the mql version of this oscillator (By jdehorty and LazyBear). WaveTrend 3D (WT3D) is a novel implementation of the famous WaveTrend (WT) indicator and has been completely redesigned from the ground up to address some of the inherent shortcomings associated with the traditional WT algorithm.
WaveTrend 3D is an alternative implementation of WaveTrend that directly addresses some of the known shortcomings of the indicator, including its unbounded extremes, susceptibility to whips

R6 Scalping EA is a fully automated Expert Advisor with no use of martingale or hedge. This EA can be run from very small accounts and Free swap. As small as 1000 $ or 1000 cent minimum Recommendations The minimum deposit is 1000 USD. Use a broker with good execution and Low Spread. A very fast VPS is required.
NOTE : I also recommend to take out profit on a regular basis. That is once a week/month. Becauser there will be DD. This EA works best at an 1:200 UP++ leverage account with sm

This indicator allows you to visually identify with a different color the candlesticks that exceed a certain limit of the ATR.
Just drag and drop it on the chart.
The user must enter the value of the ATR period.
The user must enter the value of the ATR limit with which he wants to identify the candlesticks.
In the colors tab, the user can select the colors with which to repaint the candles.
It is recommended that the first color always be None.
The second color corresponds to bullish c
FREE

A tool for creating Bill Williams indicators Our tool provides the ability to set Bill Williams indicators on a chart with a mouse click. - The Awesome Oscillator (AO) indicator helps to assess the driving force of the trend. - Alligator indicator — determines the current state of the trend and possible entry and exit points. - Fractals indicator — helps to identify significant levels - Accelerator Oscillator (AC) indicator — shows the change in trend acceleration. - Market Facilitation Index
FREE

A simple and highly effective Strength and Weakness currency indicator that can be used to aid your fundamental and technical analysis for winning trade decisions.
The indicator is very easy to use and can be applied to all time frames.
FX Tiger uses an advanced algorithm to calculate a score table for all major currencies. Green indicates currency strength and red indicates currency weakness. Once you have identified the strong and weak currencies, pair strong versus weak currencies and comb
FREE

Overview Auto TPSL is a sophisticated MetaTrader 5 Expert Advisor designed to revolut ionize how traders manage their risk and protect profits. This powerful tool automatically sets and adjusts Take Profit (TP) and Stop Loss (SL ) levels, eliminating emotional decision-making and ensuring disciplined trading practices. The EA operates through two core systems:
Auto TPSL System The Auto TPSL system automatically calculates and sets appropriate Take Profit and Stop Loss level
FREE

Highly configurable Osma indicator.
Features: Highly customizable alert functions (at levels, crosses, direction changes via email, push, sound, popup) Multi timeframe ability Color customization (at levels, crosses, direction changes) Linear interpolation and histogram mode options Works on strategy tester in multi timeframe mode (at weekend without ticks also) Adjustable Levels Parameters:
Osma Timeframe: You can set the lower/higher timeframes for Osma. Osma Bar Shift: Y ou can set the
FREE

Se ti piace questo progetto, lascia una recensione a 5 stelle.
Come le istituzioni commerciano grandi volumi, non è raro per loro cercare di
difendere la loro posizione a livelli percentuali specifici. Questi livelli serviranno come supporto naturale e resistenza che è possibile
utilizzare
o entrare in un commercio o essere a conoscenza di possibili pericoli contro la
vostra posizione. Questo oscillatore vi mostrerà la variazione percentuale per il: Giorno. Settimana. Mese. Quarto. Anno. In
FREE
Please download version 3.0 ! The Fundamental Fast Signal EA is a non-trading signal generator for MT5 , designed to provide traders with high-accuracy buy/sell alerts based on the EMA (9, 21) crossover on the 5-minute timeframe . This indicator empowers traders by offering precise entry signals while keeping full trade execution control in their hands. Key Features: EMA (9, 21) Crossover-Based Signals – Identifies momentum shifts for strategic trade entries. 5-Minute Timeframe Optimization – Id
FREE

The MetaCOT 2 CFTC ToolBox Demo is a special version of the fully functional MetaCOT 2 CFTC ToolBox MT5 library. The demo version has no restrictions, however, unlike the fully functional version, it outputs data with a delay. The library provides access to the CFTC (U.S. Commodity Futures Trading Commission) reports straight from the MetaTrader terminal. The library includes all indicators that are based on these reports. With this library you do not need to purchase each MetaCOT indicator sepa
FREE

The spread in trading is the difference between the purchase price and the sale price of a financial instrument on the market. The spread is a commission fee that traders pay brokers for the opportunity to trade.
It's no secret that each broker offers its own terms for trading. The size of the spread is important. There are a lot of advisors (especially scalpers) who show different results at different brokers. We have repeatedly encountered this. Therefore, using this utility, find out what s
FREE

Utility per la gestione delle posizioni aperte e degli ordini pendenti. Il trailing stop integrato ha cinque modalità e sette strumenti. C'è uno stop loss virtuale e un take profit virtuale, che possono essere spostati liberamente sul grafico. Con l'aiuto del simulatore di trading integrato, puoi verificare come funziona l'EA nel tester di strategia. La guida all'Advisor UTralVirtualMT5 è disponibile nella sezione "Commenti". Nel tester MT5, il movimento manuale delle linee virtuali SL e TP seco
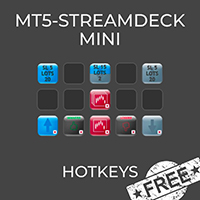
MT5 Streamdeck Mini is a free reduced version of the MT5- Stream Deck Expert advisor
MT5-StreamDeck offers the possibility to use a certain number of pre-programmed Hot-keys with a clearly defined role. So by the push of a button you can open a trade with a pre-defined lot size, stoploss and take profit. Close all your trades, close the ones in profit, or in loss, (set Break-even or set a trailing stop-ONLY IN FULL VERSION) All this with a Hot key button. See the feature list for all the actio
FREE

Idea I programmed this tool out of the necessity to be constantly informed about what is going on. Before I sometimes forgot to set a stopp loss, this is impossible with this tool. Further this tool allows you to make distributed entries, eg. with a first feeler with 0.1 contracts and when the direction is the right one you just put more contacts into the game. Money- and risk management is built in. If you use more then the predetermined number of contracts there is a warning. You are constantl
FREE
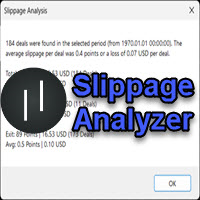
If you are using scalping strategies (or any strategy that uses stop orders for position opening or closing) you need to know your slippage. Slippage is the difference between your pending order price and the price that your brokers uses to execute your order. This can be really different and depends on the broker as well as on the market conditions (news, trading hours, etc..) With this small script you can calculate the slippage you "paid" in points and also in your account currency. You also
FREE
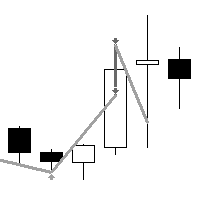
"AV BuyLow SellHigh EA" is an Expert Advisor for MetaTrader 5, which was created from the simple "AV Preview".
The original idea was to buy lower and sell higher from the last entry price. On request, I have developed it further and tried to remove its trend weakness. This EA is only the Minlot version to try out.
Strategy:
The size of a displayed rectangle is used to decide whether range trading is to be carried out (sell above, buy below) or trend trading (buy on rising, continue selling o
FREE

Simple Calendar Events is an indicator that will mark important Important Economy Events on your chart. For example, if you are trading something that is USD based, you would like to know when some important events are coming, you can expect some volatility or some different Price action, so you can base your strategy on it. If you trade something that is country based you can also choose that, and it will show you when the event is, so you can be prepared for it. When you hover with the mouse
FREE

candlestick time it a useful indicator ,it help to keep you alert with the candlestick time ,how far to be completed at the chosen period , it help to keep you patience which is a biggest thing that holds trades down ,try it to improve you way of trading. it work on any broker any time frame and any symbol. you can customize the color on input. it can work on multiple timeframe. Thank you !
FREE

This is a simple EA Can only open ONE trade EVER then MUST be reattached to the chart everytime you want to use it. Designed to help manual traders Has lot sizes and stops / targets in pips. For a sell trade the engulfing bar must close below the previous green bars low Includes Alarm and Phone notifications
Basically if you find a price zone you like and will take a trade if there is an engulfing bar . use this.
FREE

A small utility displays the time in five time zones. You can customize the display of one to five time zones. For each time it is configured: show or not; name; time offset from GMT; color; In general settings, you can change: date / time format ("hh: mi", "hh: mi: ss", "yyyy.mm.dd hh: mi", "yyyy.mm.dd hh: mi: ss") font name; font size; offset from the left edge of the chart; offset from the top edge of the chart;
FREE

OH Larry is a collection of Larry Conners most popular mean reversion strategies rolled up into one EA.
Use them individually or combine the strategies. Strategies Include: Larry Conners Double 7
Larry Conners Bollinger %
Larry Conners RSI2
Larry Conners 2555 The strategies work best on higher timeframes H4 - D1 and on ETF's and Indices.
They can easily be configured to run on Forex as well. Most of Larry Conners strategies don't include stop losses but I have added the functionality of adding a
FREE

Order Book, known also as Market Book, market depth, Level 2, - is a dynamically updated table with current volumes of orders to buy and to sell specific financial instument at price levels near Bid and Ask. MetaTrader 5 provides the means for receiving market book from your broker in real time. The expert OrderBook Recorder records market book changes and stores them in local files for further usage in indicators and expert adviser, including testing in the tester. The expert stores market book
FREE

Transaction Data Analysis Assistant: This is a statistical analysis tool for transaction data, and there are many data charts for analysis and reference. language: Support language selection switch (currently supports Chinese and English active recognition without manual selection) The main window shows: Balance display Total profit and loss display Now the position profit and loss amount is displayed Now the position profit and loss ratio is displayed The total order volume, total lot size, and
FREE

Necessary for traders: tools and indicators Waves automatically calculate indicators, channel trend trading Perfect trend-wave automatic calculation channel calculation , MT4 Perfect trend-wave automatic calculation channel calculation , MT5 Local Trading copying Easy And Fast Copy , MT4 Easy And Fast Copy , MT5 Local Trading copying For DEMO Easy And Fast Copy , MT4 DEMO Easy And Fast Copy , MT5 DEMO
Can set the cycle for other varieties of K line graph covered this window, fluctuations obser
FREE

Brekaut, a powerful and intuitive trading indicator designed to take your trading experience to the next level. Built to simplify market analysis and provide timely insights, Brekaut offers traders a reliable way to identify key breakout opportunities across various asset classes, including stocks, forex, and cryptocurrencies.
Brekaut cuts through the noise by highlighting potential breakout points where the market is poised for strong movement. This allows traders to make informed decisions a
FREE
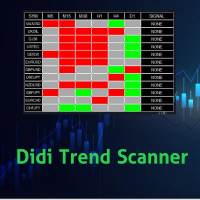
Didi Trend Scanner is an indicator for scanning market watch and detect market direction for each Time Frames and give signals for each pair
You can make decision of making trades by this scanner that specify market trend direction for you For each time frame you can add and remove any pairs you want to scan the scanner send alert via push notifications and email

Online monitoring of forex accounts fxmon.io The application helps track real-time accounts from your forex terminals Metatrader 4/5 around the clock. List of main features: The state of your accounts in the moment Profitability on each account and on all together Metrics for currency pairs Screenshots of pairs from the terminal Fine-tuning of notifications for any indicators Access to statistics via Telegram, Android app, iOS app
If you use Expert Advisors and robots, this app is for you Monit
FREE

A ideia do indicador é mudar de cores assim que o candle viole a banda; Caso o candle viole a banda superior, pinta o candle de vermelho, Caso o candle viole a banda inferior , pinta o candle de verde, Se o candle passar em algum momento pela média, ele assume uma cor acinzentada; Os candles que não passem pela média, nem violem a banda, apresentarão cor verde fraca, se for de alta e cor vermelha fraca se for de baixa. Projeto concebido no canal Aprenda a programar, keltner cores.
FREE
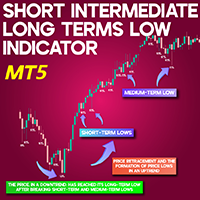
STL, ITL & LTL Indicator for MT5 The STL, ITL, and LTL indicators for MetaTrader 5 are specifically developed to detect Short-Term Lows (STL), Intermediate-Term Lows (ITL), and Long-Term Lows (LTL). Spotting these key lows manually can be quite challenging for traders. This tool effectively highlights critical price lows that influence market trends, offering traders a broader perspective on price action. Indicator Table Category ICT - Liquidity - Trend Strength Platform MetaTrader 5 Skill Lev
FREE

L'Expert Advisor (EA) "Speedometer" si basa su una strategia di analisi della velocità dei tick, che consente di identificare i punti di ingresso e uscita in base alle variazioni della velocità dei tick. L'EA monitora la dinamica dei tick e apre posizioni quando viene raggiunta una soglia di velocità specificata, consentendo di entrare nel mercato nei momenti di elevata attività e di evitare operazioni in periodi di bassa volatilità. L'EA supporta i seguenti parametri e impostazioni: Parametri p

Introducing The Day Trader System: Your Shortcut to Day Trading Success! Are you a day trader seeking simplicity without compromising profitability? Look no further! We present The Day Trader System – your go-to solution for identifying lucrative opportunities in the fast-paced world of Forex. Simple Yet Powerful: The Day Trader System is a straightforward yet highly effective indicator designed exclusively for day traders. Say goodbye to complexity and hello to a system that simplifies
FREE

Tele Notify can help you send notifications for opened & closed trades to a Telegram channel or your personal Telegram. (see Master Notify for full options of notifications/alerts: indicator data, price, news, etc. Get more EAs here )
Update: Now you can check your account info anytime from your Telegram by simple command: /check. This option is only valid when you use your Telegram User ID on EA inputs *******************************************************************************************
FREE

My first version of the Terraforming EA. The EA uses statistical arbitrage to profit from currency pairs of USD EUR & GBP. Positions are opened when an arbitrage opportunity is identified. The positions are closed after 3 hours or when the market rectified and profit is made before the 3 hour limit. A more profitable version of this EA will be available once a decent track record is made for this one.
Try it out!! Checkout my signal too . A beta version robot is used to trade on my signal acco
FREE
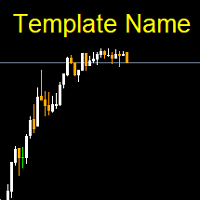
Template name allows you to write custom text that will show up on your charts. It allows you to position the text anywhere including selecting any color that you prefer. You can position the text at any of the 4 corners of your chart screen. This custom text can aid as a watermark for your screen shots. This text can act as a unique and true signature for your charts.
FREE

There are thousands, if not millions, of strategies on the internet, but only less than 10% work and of those even less have stood the test of time. Very few strategies have successfully weathered the 2008-2009 financial crisis, 2020 covid effects on the markets and all other unforeseen events that have affected the market in the last 2 decades. That being said, the strategy I feature in this episode does just that, the epitome of stability as I’ll show in a 20 year back-test.
The source of th
FREE

FCandle Smoothed Tired of market noise and false signals ruining your trades? FCandle Smoothed is the solution you've been looking for. Our innovative MQL5 strategy is designed to smooth trading candles and give you a clear, precise market view. Identify the best entry and exit points with filtered and reliable signals. Reduce market noise and avoid false breakouts with our optimized algorithm. Suitable for any trader, whether you're a beginner or advanced, this strategy adapts to any trading st
FREE
MetaTrader Market - i robot di trading e gli indicatori tecnici per trader sono disponibili nel tuo terminale di trading.
Il sistema di pagamento MQL5.community è disponibile per tutti gli utenti registrati sul sito MQL5.com che effettuano transazioni su MetaTrader Services. Puoi depositare e prelevare denaro usando WebMoney, PayPal o una carta di credito.
Ti stai perdendo delle opportunità di trading:
- App di trading gratuite
- Oltre 8.000 segnali per il copy trading
- Notizie economiche per esplorare i mercati finanziari
Registrazione
Accedi
Se non hai un account, registrati
Consenti l'uso dei cookie per accedere al sito MQL5.com.
Abilita le impostazioni necessarie nel browser, altrimenti non sarà possibile accedere.