Guarda i video tutorial del Market su YouTube
Come acquistare un Robot di Trading o un indicatore
Esegui il tuo EA
hosting virtuale
hosting virtuale
Prova un indicatore/robot di trading prima di acquistarlo
Vuoi guadagnare nel Market?
Come presentare un prodotto per venderlo con successo
Indicatori tecnici a pagamento per MetaTrader 5 - 56

Let me introduce our ProfitPlotter indicator
We are developing a technical indicator best suited for analyzing trading performance. It can display statistics of all currency pairs and trades of different magic numbers categorized on the same chart. You can specify the time range, magic number, specific currency pairs or profit statistic curves of all currency pairs for analysis. You can also click to jump to order positions and view order details, which greatly improves the usage experience. Mai
Valore di correlazione tra due simboli. Un valore di +1 significa una correlazione positiva completa; Un valore di -1 significa una correlazione inversa completa; Un valore di 0 significa che non c'è una correlazione esplicita (i prezzi non dipendono l'uno dall'altro, o la correlazione è casuale); Utilità multifunzionale : include 66+ funzioni | Contattami se hai domande Nelle impostazioni dell'indicatore, puoi configurare: Simboli (coppie di valute) da utilizzare nei calcoli.
Lascia un va
V-Flow is a Trading System that takes into account volume, flow and other factors to give a signal when to enter, hold and close a position. There are two trading modes: conservative and aggressive . CONSERVATIVE: In this mode, the system shows you when to trade by painting the graph according to the signal (buy or sell). After that, when the trend ends, the graph turns gray, indicating the time to exit the operation. However, if the histogram at the bottom still points to the same trend, it is
Simple alert system which will alert you on your mobile terminal, email and on the chart whenever RSI crosses below the overbought level or above the oversold level. Use this alert system, so you don’t have to watch the chart all day for the RSI levels to break.
INPUTS: 1. RSI Period- (Default is 14). Number of candles the RSI indicator will look back for the calculations. 2. OB Level- (Default is 70). This is the Overbought level or Upper level for the RSI indicator. 3.

Dr. Trend is based on Market Trend Detection. With this Indicator anybody can easily understand the Market Trend and Trade accordingly. It will be very very helpful to Trade perfectly and increase the Accuracy Level.
Recommendation: Use this Indicator along with my another Indicator --->>> Dr. Trend Alert ; Use this Indicator along with my another Indicator --->>> My PVSR <<<--- Click Here ; Good_Luck
It can be used for: All Pairs: Forex, Cryptocurrencies, Metals, Stocks, Indices

Visual guide which divides the 24 hours into three trading sessions. The default setting is to show Asian , London and New York sessions. But, the session start and end hours can be adjusted as required.
The indicator is useful to develop trading strategies by making it easy to see the market behavior during the three sessions.
Inputs Time Zone Start and End hours (Please provide values in HH:MM format, like 02:00, not like 2:00. Both the hours and minutes should have 2 digits) Time zone ba

Do you want to know how an economic event will impact price? What will happen to price after the news? How has an economic news affected price in the past? This indicator can help you with that.
Do you like technical analysis? Do you enjoy studying the history to predict the future? But what do you think could be more important than technical analysis, what could improve technical analysis? Of course, it's fundamental analysis! After all, economic events directly impact the market, and therefo
Sprigiona il potere della precisione con il nostro indicatore all'avanguardia! Questo ingegnoso strumento monitora meticolosamente ogni tick del prezzo, avviando i suoi calcoli proprio dal momento in cui lo carichi sul grafico.
Immagina di avere la capacità di scoprire sottili cambiamenti di tendenza e schemi direzionali man mano che si manifestano, garantendoti un notevole vantaggio nel dinamico mondo dei mercati finanziari. Il nostro indicatore funge da tuo alleato attento, consentendoti di

The "Timechannel" is a powerful technical analysis tool designed specifically for traders who want to gain deeper and more accurate insights into price movements across multiple timeframes (multi-timeframe). This indicator is an essential addition to the toolbox of any serious trader seeking to make informed and data-driven trading decisions. Key Features: Advanced Multi-Timeframe Analysis : Timechannel allows traders to analyze price movements on different timeframes simultaneously. This is cr

This indicator is great for trading many different pairs. The indicator itself uses mathematical models of augmented accuracy, but for now they are optimized for some currency pairs. Many settings can be configured in the initial settings. There are many icons for visualization. He displays his solution on a graph using various icons. There are several types of icons. In the tester it works fine by default in the settings. It is already configured by default. Happy bidding.

Introducing Candle Feeling Indicator for MetaTrader 5 - Your Ultimate Solution for Accurate and Timely Analysis! Built with more than two decades of programming experience, this indicator allows you to follow the complexities of financial markets with confidence and accuracy.
Key Features: High Precision: Identifies trend reversals with unparalleled accuracy, ensuring you stay ahead of market shifts. Analysis: All the information you need from the structure of a candle Beautiful appearance:

The Market Structures Pro indicator finds and displays 5 (five) patterns of the Smart Money Concepts (SMC) system on the chart, namely:
Break Of Structures (BoS) Change of character (CHoCH) Equal Highs & Lows Premium, Equilibrium and Discount zones with Fibo grid High-high, Low-low, High-low and Low-high extremes
Patterns are displayed for two modes - Swing and Internal and are easily distinguished by color on the chart. Internal mode features higher contrast colors, finer lines, and smal

Questo indicatore ti consente di mostrare le etichette dei livelli di Fibonacci con caratteri di grandi dimensioni
. Supporta fino a 25 livelli di Fibonacci
- Non appena disegni Fibonacci mostra i livelli che hai aggiunto come parametro di input con caratteri di grandi dimensioni con il colore e il carattere che scegli.
Opzioni personalizzabili:
1. Carattere testo Fibo
2. Dimensioni del testo Fibo
3. Colore del testo Fibo
3. Aggiungi una descrizione a ciascun livello
4. Altre opzioni com

L'indicatore " Market Session Times " mostra il tempo di quattro sessioni di negoziazione: Asia, Europa, America e Pacifico. L'orario delle sessioni di negoziazione è impostato nel formato GMT e quindi non dipende affatto dal server di trading. Vengono utilizzati i seguenti dati: Sessione di negoziazione
Città
GMT
Asia Tokio
Singapore
Shangai 00:00-06:00
01:00-09:00
01:30-07:00 Europa Londra
Francoforte 07:00-15:30
07:00-15:30 America New York
Chicago 13:30-20:00
13:30-20:00 Pacif

The bullet indicator gives accurate direction of the market structure, it will indicate to you the exact direction whether it be the market is in a downtrend or if it's in an uptrend it will give you that information which will inturn benefits you by saving you the time it takes to analyse that structure, this indicator works on a timeframes and it's most favourable on higher timeframes.
How it works: -The green arrow will be at the support of the structure indicating buys -The red arrow will b

Do you believe that financial markets and celestial bodies operate in separate realms? Our indicator begs to differ! Based on the innovative theory of William Gann, which emphasizes the influence of celestial planet movements on financial market dynamics, we present to you the "Gann Planetary Lines Indicator". Features of the Indicator : Precision : Accurate projection of the 360 degrees of planetary orbits onto price charts. Advanced Customization : Ability to display or hide any planet line,
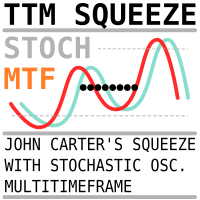
The same indicator that is published here https://www.mql5.com/en/market/product/105645?source=Site+Market+My+Products+Page , but instead of the MACD, a Stochastic Oscillator is used.
The indicator can be useful for searching for the possibility of opening a position on the Momuntum of multiple timeframes - a method described by Robert Miner in his book "High probability trading strategies".
The settings speak for themselves
Period - the timeframe for which the indicator is calculated. Whe

This is not a conventional Moving Average Indicator. With this indicator, you can fully costumize your moving average. You can select the "Source" Price (not only the standard prices that come with Metatrader), "Period" of it, and the "Smooth" Calculation that you want to apply. There are many of them, such as SMA (Simple Moving Average), SMMA (Smoothed Moving Average), EMA (Exponential Moving Average), DEMA (Double Exponential Moving Average), TEMA (Triple Exponential Moving Average) and LWMA (

ATR è un indicatore importante per qualsiasi mercato finanziario. L'abbreviazione ATR corrisponde all'acronimo di Average True Range. Questo indicatore è uno strumento per determinare la volatilità del mercato, questo è il suo ruolo diretto. ATR mostra il movimento medio del prezzo per il periodo di tempo selezionato. Il prezzo iniziale dell'indicatore è 63$. Il prezzo aumenterà ogni 10 vendite fino a 179$ . L'indicatore ATR originale è presente in molti programmi di trading. L'indicatore ATR

LuXiwu Trend Trading special wave marking tool
0.Main table show hide Click the bottom 10% area of price axis to show or hide main table,or by default key Q.
1. QJT search Click the high or low point of the main wave to automatically find the QJT . If there is overlap between the inner and outer intervals, click the button << or >> to adjust the left and right, or manually drag the adjustment after completion.If there is a failure wave, you can use the system's own trend line to draw the Q

Unlock the Power of Scalping with this Essential Indicator for Any Currency Pair! Experience Crystal-Clear Buy/Sell Signals and Activate Instant Alerts for Maximum Precision.
Introducing the Ultimate Scalping Companion: Your Key to Precision Profits! Transform Your Trading Strategy with an Indicator that Stands the Test of Time! In the ever-evolving world of trading, consistent success hinges on smart risk management . While no tool can be the holy grail, our non-repainting indicator is a ga

L'indicatore Forex Double Stocastic RSI è una modifica dell'oscillatore stocastico per la piattaforma MetaTrader 5.
INFORMAZIONI SULL'INDICATORE L'indicatore forex Double Stocastic implementa un doppio stocastico applicato all'RSI, utilizzando livelli fluttuanti invece di quelli fissi per valutare ipervenduto e ipercomprato.
Nei casi in cui il periodo RSI è <=1, si ottiene solo un doppio stocastico. È possibile utilizzare un ulteriore livellamento dei risultati (per questo viene utilizzata

Indicatore Forex psychological Oscillator MT5-questa è una grande modifica del classico oscillatore che vi aiuterà nel trading per MetaTrader 5.
INFORMAZIONI SULL'INDICATORE Indicatore Forex psychological Oscillator MT5 è presentato sotto forma di un grafico a barre a colori e ha tutte le qualità degli oscillatori Forex.
Sono presenti anche zone quando e in quali zone si trova il mercato.
Tutto è fatto in modo semplice e il più chiaro possibile in modo che tutti i trader possano capirlo se

The GGP Squeeze Momentum MT5 Indicator is a volatility and momentum tool designed to help traders optimize their trading performance and providing traders with actionable insights to make well-informed trading decisions. This indicator is MT5 conversion of the Squeeze Momentum Indicator by “LazyBear “ in Trading View website and some alert methods are added to provide real-time alerts when a trading signal is generated, in order to allow traders to act quickly and efficiently. For MT4 version pl

The GGP Williams Vix Fix MT5 Indicator is based on the volatility of the market and grants a huge support for finding out when a correction is coming to end. This indicator is MT5 conversion of the CM_Williams_Vix_Fix Finds Market Bottoms Indicator by “ChrisMoody “ in Trading View website and some alert methods are added to provide real-time alerts when a trading signal is generated, in order to allow traders to act quickly and efficiently. For MT4 version please click here . Larry Williams Deve

Draw as many custom candles as possible on a single chart with this special indicator. Your analysis skill will never be the same again for those who know the power that having a hawkeye view of all price action at once provides. Optimized for performance and allows customization on the appearance of candle bodies and wicks. This is an integral part of analysis at our desks, we hope it will never leave your charts too once you can use it to its full potential.
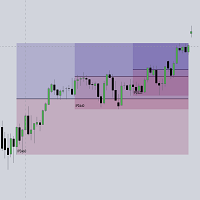
This script automatically calculates and updates ICT's daily IPDA look back time intervals and their respective discount / equilibrium / premium, so you don't have to :) IPDA stands for Interbank Price Delivery Algorithm. Said algorithm appears to be referencing the past 20, 40, and 60 days intervals as points of reference to define ranges and related PD arrays. Intraday traders can find most value in the 20 Day Look Back box, by observing imbalances and points of interest. Longer term traders c
The scanner is designed to scan signal buffers of indicators (arrows) and display the nearest signal bar on the panel in color and digital display. Symbols to be scanned, time frames and the number of bars to be scanned are specified, starting from the current (0th) bar. There is also a complex signal, which indicates a list of timeframes on which the indicator signal must match.
You can collapse the indicator by clicking the left mouse button on the upper left corner of the panel (name) a

The GGP Wave Trend Oscillator MT5 Indicator is a volatility and momentum tool designed to help traders optimize their trading performance and providing traders find the most accurate market reversals. This indicator is MT5 conversion of the Indicator: WaveTrend Oscillator [WT] by “ LazyBear “ in Trading View website and some alert methods are added to provide real-time alerts when a trading signal is generated, in order to allow traders to act quickly and efficiently. When the oscillator is abov
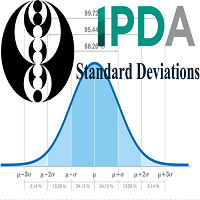
> Introduction and Acknowledgements
The IPDA Standard Deviations tool encompasses the Time and price relationship as studied by Dexter's . I am not the creator of this Theory, and I do not hold the answers to all the questions you may have; I suggest you to study it from Dexter's tweets, videos, and material. > Tool Description This is purely a graphical aid for traders to be able to quickly determine Fractal IPDA Time Windows, and trace the potential Standard Deviations of the moves at their

This Indicator represents the standard Heikin Ashi Candle converter from normal candles. They are applied on a different chart, so you can identify easily both prices. You can also change candles to your favourite colours. If you want to, you can use this indicator into an iCostum, so you can apply other indicators over this on, because there are excellent indicators combined with this type of candles
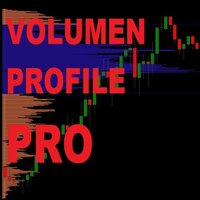
Möchten Sie Ihre Gewinne maximieren, um Ihre Ziele schneller zu erreichen? Denn schauen Sie sich unser Volumenprofil genauer an. Denn die grafische Darstellung der Volumenverteilung macht es Ihnen leicht, die Verteilung und Verschiebung des Gesamtvolumens zu erkennen. Dies führt zweifellos zu besseren Trades und steigert Ihre Leistung erheblich. Mit unserem leistungsstarken Volumenprofil, das die Geschwindigkeit und Effizienz von Metatrader 5 in keiner Weise einschränkt, können Sie das tatsächl
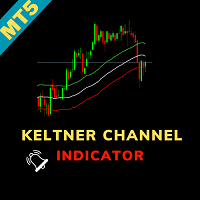
Keltner Channel Indicator for MetaTrader 5 - Precision in Every Trade Unlock precision in your trading with the "Keltner Channel Indicator" tailored for MetaTrader 5. This powerful tool, based on Chester Keltner's work, offers you unparalleled insights into price volatility, helping you make well-informed trading decisions. Basic Details : Indicator Type : Keltner Channel Indicator for MetaTrader 5 Key Metrics : Real-time analysis of price volatility and trend identification. Customization : Ful

Squeeze Momentum Indicator for MetaTrader 5 - Unleash the Power of Market Momentum Introducing the "Squeeze Momentum Indicator" for MetaTrader 5, your gateway to mastering market momentum. This advanced tool is meticulously crafted to provide you with actionable insights into market dynamics, helping you make well-informed trading decisions. Basic Details : Indicator Type : Squeeze Momentum Indicator for MetaTrader 5 Key Metrics : Real-time analysis of market momentum and volatility. Customizati
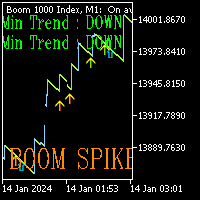
Boom Spike mater is the future for trading Boom markets. It has been designed to run on Boom 300 , 500 and 1000 markets on the 1 minute timeframe. It has 2 different trading modes (Aggressive and Normal) Aggressive mode will plot Yellow and blue arrows. 2 different conditions to help you make the right choice. Enter first trade on yellow arrow and second trade on blue candle. SL in this mode will be 10 Candles from the blue arrow. Normal mode will only plot red arrows on the chart. This mode is

Directional Volatility and Volume Oscillator for MetaTrader 5 - Master Market Dynamics Discover the power of precision trading with the "Directional Volatility and Volume Oscillator" meticulously designed for MetaTrader 5. This advanced tool combines the insights of directional analysis, volatility measurement, and volume tracking to provide you with unparalleled market understanding. Basic Details : Indicator Type : Directional Volatility and Volume Oscillator for MetaTrader 5 Key Metrics : Rea
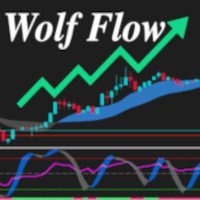
L'Indicatore Wolf Flow per MetaTrader 5 è la soluzione perfetta per i trader che cercano chiarezza istantanea e precisione nelle loro analisi di mercato. Semplice da utilizzare e immediato nella visualizzazione, questo strumento ti offre una panoramica completa delle dinamiche del mercato in un solo sguardo. Punti di Forza: Semplicità Assoluta: Un'interfaccia pulita e intuitiva garantisce un utilizzo senza sforzi, anche per i trader meno esperti. Immediato e Rapido: I dati chi

To get access to MT4 version please click here . Also you can check this link . This is the exact conversion from TradingView: "UT Bot" by "Yo_adriiiiaan". This is a light-load processing indicator. This is a non-repaint indicator. Buffers are available for processing in EAs. All input fields are available. You can message in private chat for further changes you need. Thanks for downloading

If you need more information than a few numbers in the iExposure index, this indicator is for you.
Better iExposure indicator is an improvement over the original information, such as:
Separate profit column for BUY and SELL Separate SL column for BUY and SELL Separate TP column for BUY and SEL Average Price as Horizontal Line in Chart Pip Value Profit https://www.facebook.com/groups/prop4y
iExposure will show the opening of trading positions in tabular form in the sub-window below the main wi
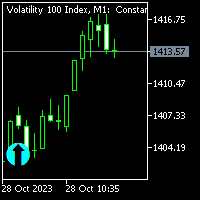
This indicator works well with synthetic pairs it gives market direction. it's good for beginners when the show on the chart you can place trades. Works with markets direction so when the market changes, a new arrow appears the chart. when indicator paints please don't rush in and trade you might trade false signal all you need is to be patience.
For more information please contact me on telegrame and facebook @ (Mountain fx)
NOTE: WHEN YOU PUECHASE THE INDICATOR YOU WILL GET A FREE MENTORSHIP

Indicator Name : Fourier Transform Curve Indicator Description : The Fourier Transform Curve Indicator for MetaTrader 5 is a powerful tool that leverages Fourier analysis to depict curves directly on your price chart. It is designed to provide valuable insights into the underlying harmonic components of the price data. Parameters : Input Candle Count : This parameter allows you to specify the number of candles to include in the Fourier transformation calculation. A higher value will capture lon

PMax is a brand new indicator developed by KivancOzbilgic in earlier 2020.
It's a combination of two trailing stop loss indicators;
One is Anıl Özekşi's MOST (Moving Stop Loss) Indicator
and the other one is well known ATR based SuperTrend.
Both MOST and SuperTrend Indicators are very good at trend following systems but conversely their performance is not bright in sideways market conditions like most of the other indicators.
Profit Maximizer - PMax tries to solve this problem. PMax c

The Tiko Trend indicator not only signals immediate buy or sell. It indicates the short term and long term trend. operations. The simplest way to use the indicator is to open a trade in the direction of the existing trend. The indicator allows you to study real and historical market trends in more detail! Shows the points for opening transactions to sell or buy, and also indicates the direction of the trend in: short-term and long-term periods. The analysis is based on the selected timefram

Trend Channel is a Forex trend arrow indicator for identifying potential entry points. I like it, first of all, because it has a simple operating mechanism, adaptation to all time periods and trading tactics. Created based on a regression channel with filters. We display the signals of the Trend Channel indicator on the price function chart using a mathematical approach.
How it works: when the price breaks through the overbought/oversold zone (channel levels), a buy or sell signal is generated

Here is a quantitative analysis indicator for any market. Its essence is simple - it calculates the magnitude of the waves of price movement from top to bottom, and gives the median value of the magnitude of the non-recoil trend. If the current value of the movement has exceeded this threshold by more than 10% (110% of the indicator indicator), you can enter a trade against the trend and work with a large margin of action based on ATR. Transactions are obtained with a high risk-reward ratio and

The "Angel Algo" indicator, designed for the TradingView platform, is a powerful technical analysis tool that assists traders in identifying dynamic support and resistance levels in real-time. It provides valuable insights into potential breakout points and market regimes.
At its core, the "Angel Algo" indicator utilizes a rolling window of price data to calculate maximum and minimum price levels. It then dynamically identifies support and resistance levels by examining specific conditions rela
Pick Trend is a reliable indicator without redrawing that will not leave any trader indifferent.
Pick Trend tool, which, based on mathematical calculations, analyze all five aspects: opening price, high, low, closing price and volume. Using the Pick Trend Forex indicator algorithm, you can quickly understand what trend is currently developing in the market. As a result of the calculations, the Pick Trend technical indicator is plotted on the chart in the form of a set of points for easy interp

MultiFractal è un indicatore frattale di Bill Williams modificato, integrato con frattali di ordine superiore, la differenza tra i quali è di quattro dimensioni, simile al cambiamento dell'intervallo di tempo. Vantaggi rispetto all'indicatore terminale originale: Convenienza Visibilità Contenuto informativo L'indicatore è utile perché non è necessario passare a intervalli di tempo diversi quando si lavora. Visibilità: in un grafico puoi vedere la struttura del grafico dai movimenti di mercato pi

Introducing this manual trading strategy that will change the way you approach funding tests! Our indicator has been meticulously designed to maximize your success, offering an impressive accuracy rate of 83% on entries . Imagine having a tool at your disposal that guides you accurately through the financial markets, giving you an unparalleled competitive advantage. With our innovative technology, you'll be one step ahead in every operation. You no longer have to rely solely on intuition or expe
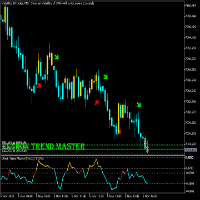
ULTRON TREND MASTER
This Indicator strategy works on any volatility market together with currency pairs and gold. It uses 2 files (Ultron Trend Master 1 and 2) Due to only uploading one file. Please also download Ultron Trend Master 1 free from comment section of this indicator . The purchased file is the main file with the strategy and should be used together with Trend Master 1 File.
The only indicator on the market that will be able to trade any Vix market together with any currency pair or

Traders Dynamic Index (TDI) MetaTrader indicator — a comprehensive but helpful indicator that uses RSI (Relative Strength Index), its moving averages, and volatility bands (based on Bollinger Bands) to offer traders a full picture of the current Forex market situation. Here is single timeframe product. Once puscharse this indicator, you free to use MTF scanner (free at here ) The Traders Dynamic index TDI indicator is the next generation of the popular Trader Dynamic index indicator dev
Are you tired of the uncertainty that arises when your orders fail to stop at a specific line due to the spread? Look no further! Introducing our indicator that plots candlesticks based on the Ask price instead of the traditional bid-based chart commonly used in MQL4. With this indicator, you can say goodbye to the frustrations caused by the bid-based chart, as it provides you with a more accurate representation of market movements. By utilizing the Ask price, which represents the price at whic

Market Noise Il rumore del mercato è un indicatore che determina le fasi del mercato su un grafico dei prezzi e distingue anche i movimenti di tendenza chiari e fluidi dai movimenti piatti e rumorosi quando si verifica una fase di accumulazione o distribuzione. Ogni fase è adatta al proprio tipo di trading: trend per i sistemi trend-following e flat per quelli aggressivi. Quando inizia il rumore del mercato, puoi decidere di uscire dalle operazioni. Allo stesso modo, e viceversa, non appena il

Entry and exit signals from the IFR2 Strategy by Larry Connors in his book "Short Term Trading Strategies That Work".
Larry claims this strategy correctly predicted the shortterm direction of the S&P 500 83.6% of the time from 1995 to 2007.
How does it work? The indicator activates the buy signal when the price closes above the 200-day moving average and the 2-period IFR closes below 5. The sell signal is the opposite.
How to use it? Enter the trade with a market order as soon as the candle

My PVSR is based on All Type of Pivot Points. Use this Indicator to get proper Support / Resistance Zone and Trade accordingly..
Recommendation: Use this Indicator along with my another Indicator --->>> Dr. Trend <<<--- Click Here ; To get the best output result feel free to contact me ; Best of Luck
It can be used for: All Pairs: Forex, Cryptocurrencies, Metals, Stocks, Indices etc. All Timeframe All Brokers All type of Trading Style like Scalping, Swing, Intraday, Short-Term, Long-

The Beta index, also known as the Beta indicator, is one of the key reference indicators for hedging institutions. It allows you to measure the relative risk of individual assets, such as currencies and commodities, in comparison to market portfolios, cross-currency pairs, the U.S. dollar index, and stock indices. By understanding how your assets perform in relation to market benchmarks, you will have a clearer understanding of your investment risk. Key Features: Accurate Risk Assessment: The Be

This indicator is great for trading on various trading pairs. The indicator itself uses mathematical linear strategies of augmented accuracy. It has many additional signals and basic signals. Many settings can be configured in the initial settings. There are lines and arrows on the graph for visualization. He displays his decision on a graph in the form of icons, text, and colored lines. There are only two types of main icons. In the tester it works fine by default in the settings. It is alread
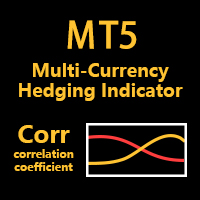
The Corr indicator, also known as the Correlation Indicator, serves as a reference indicator for hedge institutions. It is used to measure the degree of relationship between two or more financial products. In the financial field, especially in the currency market, correlation coefficients are commonly used to study the correlation and degree of relationship between different currencies. Correlation coefficients are typically represented by values ranging from -1 to 1. Here are some common interp

神奇九转, 顾名思义就是每当出现数字9时,行情就很大的几率会发生逆转,这时应该注意止盈。是一个很有效的指标。 在序列显示和形成过程中,一旦出现不符合触发条件的情况,则前面序列数字消失,本次九转序列结构不存在。如果连续九天都达到触发条件,九转序列结构形成,价格走势可能发生反转。
九转序列可分为上升九转结构和下降九转结构,也就是九转序列在买多和买空以及判断各种走势反转是都可以使用。 九转序列买入建仓,即下降九转序列结构形成时,价格走势将要发生转变,考虑建仓买入。 买入条件:连续出现九根K线,并且满足收盘价都低于前一根K线收盘价,当第8、9根K线满足上述条件时,九转序列形成,投资者准备买入建仓。
使用分时九转时需要注意两点: 1、极端行情时(连续上涨或下跌),九转序列失效; 2、当九转序列完全形成时,再进场操作(尤其不用刚出现数字8或9就入场,一定要完全形成之后才可以。)

PTS - Divergence Buy Finder di Precision Trading Systems
Il Precision Divergence Finder è stato progettato per individuare i minimi di mercato con estrema precisione e lo fa frequentemente.
Nell'analisi tecnica, l'arte di individuare i minimi di mercato è generalmente molto più semplice rispetto a individuare i massimi, e questo strumento è progettato appositamente per questa finalità. Dopo aver identificato una divergenza rialzista, è saggio attendere che la tendenza si inverta prima di acqu
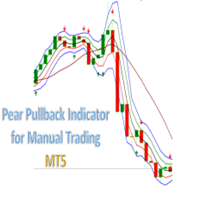
Grape PullBack Indicator for Manual Trading. Indicator (arrow) Type Strategy (Pullback) for all Symbols and Periodicity, Preferably from 30M periodicity. Can be used for manual trading. The indicator i s determined by strategies that is based on criteria for the location of candlesticks in the channel and for the Rsi, Atr, Fractal and Market facilitation index indicators. Its workspace corresponds to channel of 3 bars of Bill Willians with a channel extension . BUY when there is a Green A

PTS - Divergence Buy Finder di Precision Trading Systems
Il Precision Divergence Finder è stato progettato per individuare i minimi di mercato con estrema precisione e lo fa frequentemente.
Nell'analisi tecnica, l'arte di individuare i minimi di mercato è generalmente molto più semplice rispetto a individuare i massimi, e questo strumento è progettato appositamente per questa finalità. Dopo aver identificato una divergenza rialzista, è saggio attendere che la tendenza si inverta prima di acqu

This is a multi-timeframe indicator that detects and displays support and resistance (S&R) lines using the ZigZag indicator.
Features
The support and resistance lines are not redrawing. The indicator is capable of adding new support and resistance levels as they appear. Each S&R line has a tooltip that displays the price level and start time. Shows the start time, price level and number of touches of all S&R lines when pressing the shortcut Shift+I Save time for multi-timeframe analysis on tr

Introducing the "Bull vs Bear Price Strength Oscillator" Indicator: Your Key to Smart Trading Decisions! Are you looking for a trading tool that can provide you with a clear and visual representation of price trend strength? Look no further! The Price Strength Indicator is here to transform the way you analyze the markets and make trading decisions. Uncover Hidden Market Strength: The Price Strength Indicator is designed to help you assess the market's momentum with ease. It does this by evaluat

Cet indicateur combine les indicateurs classiques MACD et Zigzag pour détecter la divergence entre le prix et les indicateurs. Il utilise également une technologie avancée d’intelligence artificielle (IA) pour détecter la validité des divergences.
MACD est connu comme le « roi des indicateurs » et Zigzag est également un indicateur très utile. En combinant ces deux indicateurs, cet indicateur exploite les atouts des deux.
La détection de divergence est un problème probabiliste. Souvent, les d

The Datasource AC indicator is a technical analysis tool developed by the author based on the Accelerator Oscillator. Everyone knows the general principles of working with the AC indicator. Therefore, I will not describe them separately. I will focus on differences.
Differences are a purely technical implementation and expanded indicator. An important feature is that the indicator does not change its values even when using the closing price, since the indicator uses the safe calculation algori

Codice PTS Demand Index di Precision Trading Systems
Il Demand Index è stato creato da James Sibbet e utilizza un codice complesso per semplificare l'interpretazione del volume e del prezzo come combinazione.
Comprendere i volumi non è mai un compito facile, ma questo bellissimo pezzo di programmazione certamente rende tutto più facile.
Ci sono diversi modi in cui questo indicatore può essere vantaggioso per trader e investitori.
Divergenze (Come indicatore principale) Dopo aver studiato

Trader! Don't you want to spend all day on your computer screen looking at quotes?
And do you want to receive stock buying/selling tips based on one of the most used indicators in FOREX on your cell phone?
Then discover the Vegas Tunnel
Support and product questions at the link below:
Support
This indicator searches for Buy and Sell SIGNALS in Stock Exchange Assets. It works on any asset on the market.
Select in the parameters which Fibonacci line the signal will be sent and then jus

This MetaTrader 5 indicator helps traders by identifying and marking two important levels on the chart:
1. Previous Day's High (PDH):
- The highest price reached in the market during the previous trading day.
2. Previous Day's Low (PDL):
- The lowest price reached in the market during the previous trading day.
How it Works:
1. Initialization:
- When you attach the indicator to a chart, it initializes by calculating the PDH and PDL based on the highest and lowest prices of the previo

--- StudentK Ict Smc Structure --- 1. Inner Circle Trading
2. Smart Money Concept
3. Structure
--- What are included in tool --- 1. Market Session Box
2. Kill Zone
3. High/Low
4. Imbalance
5. FU Candle
6. Thicker Wick + Doji Candlestick
7. StudentK's Structure Line
8. Pivot Point
--- Context --- StudentK is not indicated as a master or K Sir for knowledgeable person who claims for winning all the time. (But lots of traders should know the fact that it is rarely truth, especially in fluctuated
MetaTrader Market - i robot di trading e gli indicatori tecnici per trader sono disponibili nel tuo terminale di trading.
Il sistema di pagamento MQL5.community è disponibile per tutti gli utenti registrati sul sito MQL5.com che effettuano transazioni su MetaTrader Services. Puoi depositare e prelevare denaro usando WebMoney, PayPal o una carta di credito.
Ti stai perdendo delle opportunità di trading:
- App di trading gratuite
- Oltre 8.000 segnali per il copy trading
- Notizie economiche per esplorare i mercati finanziari
Registrazione
Accedi
Se non hai un account, registrati
Consenti l'uso dei cookie per accedere al sito MQL5.com.
Abilita le impostazioni necessarie nel browser, altrimenti non sarà possibile accedere.