Guarda i video tutorial del Market su YouTube
Come acquistare un Robot di Trading o un indicatore
Esegui il tuo EA
hosting virtuale
hosting virtuale
Prova un indicatore/robot di trading prima di acquistarlo
Vuoi guadagnare nel Market?
Come presentare un prodotto per venderlo con successo
Nuovi indicatori tecnici per MetaTrader 5

Ogni acquirente dell’indicatore riceverà inoltre gratuitamente:
L’utilità esclusiva “Bomber Utility”, che gestisce automaticamente ogni operazione, imposta i livelli di Stop Loss e Take Profit e chiude le posizioni secondo le regole della strategia I file di configurazione (set file) per adattare l’indicatore a diversi asset I set file per configurare il Bomber Utility in tre modalità: “Rischio Minimo”, “Rischio Bilanciato” e “Strategia di Attesa” Una guida video passo-passo per installare, conf

RSI ABCD Pattern Finder: Strategia Tecnica 1. Come Funziona l'Indicatore Combina il RSI classico con il rilevamento automatico di pattern armonici ABCD . Componenti Principali RSI standard (periodo regolabile) Marcatori di massimi e minimi (frecce) Pattern ABCD (linee verdi/rosse) Filtri ipercomprato (70) e ipervenduto (30) 2. Configurazione su MT5 period = 14 ; // Periodo RSI size = 4 ; // Dimensione massima del pattern OverBought = 70 ; // Livello ipercomprato OverSold = 30 ; // Livello iperve
FREE

# Wave Trend Oscillator (WTO) User Guide
## Overview Wave Trend Oscillator is a powerful technical analysis tool used to analyze price momentum and trend direction. It visualizes market conditions using two main lines (WT1 and WT2) and a histogram.
## Components 1. **WT1 (Green Line)**: Main trend indicator 2. **WT2 (Red Line)**: Signal line 3. **Histogram (Blue)**: Shows the difference between WT1 and WT2 4. **Arrows**: Mark crossover points - Green Arrow: WT1 crosses above WT2 (Buy signa
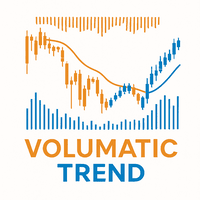
Volumatic Trend is a powerful, trend-following indicator that merges directional analysis with real-time volume behavior. By combining adaptive trend logic and volume overlays, it gives traders a detailed snapshot of market conviction and potential turning points. From instant trend shift detection to volume-weighted candle visuals, this tool brings deeper context to price movement. MT4 Version - https://www.mql5.com/en/market/product/136210/ Join To Learn Market Depth - https://www.mql5.co
FREE

Speed Scalp Indicator – NON-Repaint
The Ultimate Tool for Fast and Precise Scalping
Perfect for Gold (XAUUSD) & Lower Timeframes The Speed Scalp Indicator is a powerful, non-repainting trading tool specifically engineered for scalpers who thrive on speed, precision, and high-frequency entries. Tailored for timeframes 30 minutes and below , this indicator is especially optimized for Gold (XAUUSD) , making it an essential companion for traders focusing on volatile instruments and rapid

I am a trader specializing in the development of rare , exclusive , high-performance trading bots designed for serious traders who are committed to achieving consistent profitability and success. This free indicator is more than just a visual tool—it powers the Midnight Throttle EA , an automated trading system that executes trades based on the precise market conditions this indicator observes. Midnight Watch : A Pro-Level Tool for Precision Market Analysis. An advanced , multi-functional MetaTr
FREE
“Questo strumento di trading segreto è stato bandito dalle società di consulenza (non vogliono che lo sappiate!)”.
Scoprite l'ultimo vantaggio di trading - senza EA! (Realizzato per i trader, da un trader. Non un robot - solo pura potenza di trading!)
Avete difficoltà con i falsi breakout, le inversioni improvvise o la manipolazione del mercato? Questo potente strumento di trading vi fornisce segnali precisi al laser anche quando i mercati si muovono velocemente, aiutandovi a individuare e

L'indicatore Multi Timeframe Candles è un potente strumento di visualizzazione progettato per aiutare i trader ad allineare l'analisi dei timeframe inferiori con la struttura dei timeframe superiori. Tracciando le candele di un timeframe superiore selezionato (H1, H4, D1, ecc.) direttamente sul grafico corrente, questo indicatore offre una prospettiva più chiara dell'andamento generale del mercato senza dover cambiare grafico.
Chi ha bisogno di questo indicatore? Questo strumento è ideale
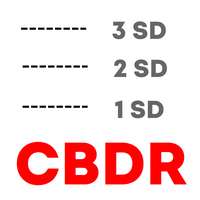
Haven CBDR è un indicatore facile da usare che visualizza sul grafico l'intervallo dei prezzi ICT "Central Bank Dealers Range" (CBDR). Il programma disegna dei rettangoli che evidenziano l'intervallo di prezzo CBDR e mostra inoltre delle linee di deviazione standard per individuare i potenziali livelli di supporto e resistenza. Il prodotto consente di personalizzare l'intervallo orario del CBDR, il numero di giorni di calendario da visualizzare, i colori e gli stili degli elementi grafici, e ada
FREE
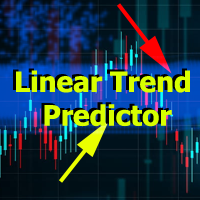
Linear Trend Predictor : indicatore di tendenza che combina punti di ingresso e linee di supporto direzionale. Funziona secondo il principio di rottura del canale dei prezzi alto/basso.
L'algoritmo dell'indicatore filtra il rumore di mercato, tiene conto della volatilità e delle dinamiche di mercato.
Capacità dell'indicatore
Utilizzando metodi di smoothing, mostra l'andamento del mercato e i punti di ingresso per l'apertura di ordini di ACQUISTO o VENDITA. Adatto per determinare i movimenti d

Candle Volume Strength è un indicatore di analisi del volume avanzato che fornisce informazioni sulla battaglia in corso tra acquirenti e venditori. Calcola e visualizza i cambiamenti di volume in tempo reale, aiutando i trader a confermare breakout, trend, ritracciamenti e inversioni con maggiore accuratezza.
Caratteristiche principali: Conferma basata sul volume: l'indicatore monitora le variazioni del volume dei tick e avvisa quando il potere di mercato si sposta tra acquirenti e venditor
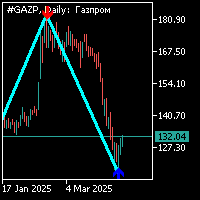
L'indicatore zig-zag è standard con un periodo di 34 con un segnale aggiuntivo a forma di freccia. Il segnale aggiuntivo viene calcolato separatamente dall'indicatore zig-zag.Il lavoro su questo indicatore è il seguente: 1. quando si forma un segmento dell'indicatore zig-zag e la comparsa di un segnale aggiuntivo sotto forma di una freccia, è necessario aprire la posizione verso la direzione della freccia; 2. quando si forma un altro braccio dell'indicatore zig-zag nella direzione opposta del s

Prior Cote è un indicatore semplice, moderno ed essenziale per i trader che utilizzano l’analisi tecnica basata sui livelli di prezzo del giorno precedente. Disegna automaticamente i seguenti livelli della sessione precedente sul tuo grafico: • Apertura
• Massimo
• Minimo
• Chiusura
• Prezzo Tipico Perfetto per:
• Strategie di inversione e breakout
• Analisi di supporti e resistenze
• Operatività intraday e swing trading ️ Completamente personalizzabile:
• Attiva o disattiva ogni linea si
FREE
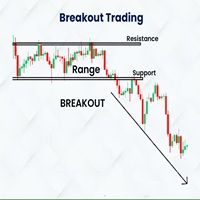
Indicador Basado en la estrategia de ruptura del rango de londres de Amaury Benedetti.
Este indicador dibuja automaticamente el rango, el maximo y minimo y sus correspondientes lineas de stoploss, entrada y takeprofit.
SE RECOMIENDA USAR EN M1 EN EL US30 (DE ACUERDO A LA ESTRATEGIA)
Los valores se pueden modificar de acuerdo a la necesidad del usuario, tambien se tienen mas configuraciones para dibujar cualquier rango en diversos horarios y con diferentes configuraciones de sl, tp, etc
Detal
FREE

What is Linear Regression? Linear regression is a statistical method used to model the relationship between price and time. In forex trading, it helps traders identify trends, potential reversals, and areas of support and resistance. Uses of Linear Regression in Forex Trading Trend Identification The regression line acts as a dynamic trendline, showing whether the market is trending upward or downward. Traders can use the slope of the regression line to measure trend strength. Support and Resist

Zero Lag EMA Indicator (AI-Optimized) – Professional Trading Tool Enhance your trading accuracy with the Zero Lag EMA Indicator — a next-generation solution designed to eliminate the delay of traditional moving averages. Powered by AI-optimized algorithms, this tool delivers lightning-fast market insights, helping you stay ahead of price action. Key Features: AI-Enhanced Speed : Virtually no lag. Detects trend shifts and momentum changes with exceptional speed. Market Versatility : Ideal for For
FREE

Introduction! to the Indicator that Connects Trend , Pattern , and Candlestick Trigger 3 Steps in Under 30 Seconds ️ Trade effortlessly — no analysis required, Your smart assistant is ready to simplify your workflow No more chart overload Trade with confidence using smart bias detection Compatible with all currencies, crypto, stocks, metals, indices, and any timeframe Just click and execute — it’s that simple Ideal for busy traders who want speed and clarity. TPTSyncX is a powerfu

Overview The TTM Squeeze indicator helps identify low volatility periods (squeeze) that often precede price breakouts. It uses Bollinger Bands (BB) and Keltner Channels (KC) to determine when the market is "coiling" and ready to move. Configuration Guide Volatility Settings The indicator uses Bollinger Bands to measure market volatility. When BBs are inside Keltner Channels, a squeeze is detected. The squeeze suggests the market is consolidating and may soon break out. True Range Option Optional
FREE

MACD Scalper Zero Lag è un indicatore veloce, preciso e affidabile, progettato per offrire ai trader il vantaggio dei segnali in tempo reale. Eliminando il ritardo presente negli indicatori MACD tradizionali, fornisce avvisi istantanei di divergenza sia sui mercati forex sia su quelli delle criptovalute. Grazie a un algoritmo solido e a un’interfaccia intuitiva, questo strumento non solo rileva precocemente le inversioni di tendenza, ma offre anche segnali chiari e utili. Le opzioni di personali

MT4 version Overview The Lowess Channel indicator is a smoothed trend-following tool designed to help traders identify the direction of the trend , detect flat or ranging markets , and spot breakouts from consolidation zones. It creates a central smoothed line with upper and lower channel boundaries, adapting to market noise while maintaining clarity. How It Works The indicator builds a channel around a smoothed price line. The central line reflects the current trend. The upper and lower bounda
FREE
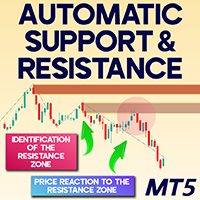
Automatic Support & Resistance Indicator for MT5
The Automatic Support & Resistance Indicator for MT5 is a sophisticated tool tailored for MetaTrader 5 users, engineered to systematically highlight significant support and resistance price zones. It marks support levels using green shades (dark green for newly formed zones, light green once retested) and resistance areas in brown tones (starting with dark brown and lightening after confirmation), offering traders visual clarity in identifying cri
FREE
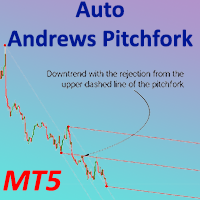
Auto Andrews Pitchfork indicator MT5
The Auto Andrews Pitchfork indicator MT5 is a specialized technical tool on the MetaTrader 5 platform that automatically plots three equidistant, parallel trendlines by using three selected pivot points (significant highs and lows). These lines serve as evolving zones of support and resistance, providing actionable trade signals when price interacts with them. This tool simultaneously generates two pitchfork patterns—one outlined in dotted lines and the othe
FREE
SyntheticaFX Boom and Crash is a powerful tool designed to highlight potential spike opportunities in the market, exclusively for traders focusing on Crash and Boom indices. This indicator is strictly optimized to operate on the 3-minute (M3) timeframe and supports only the following pairs: Crash 1000 Index , Crash 900 Index , Crash 600 Index , Crash 500 Index , Crash 300 Index , Boom 1000 Index , Boom 900 Index , Boom 600 Index , Boom 500 Index , and Boom 300 Index . It will not display signa
FREE
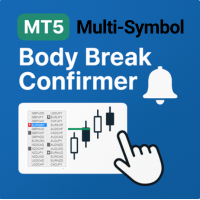
The Body Break Confirmer tracks price breakouts based on previous candle body breaks on H1 and higher timeframes. It is activated instantly by the user for each symbol with a button click. This tool works perfectly for confirming market reversals in any reversal strategy. Unlike standard reversal indicators, it lets the user cherry-pick the symbols they want to track, ensuring only high-quality alerts that match their strategy are issued. Like this tool? Want more flexibility than the aggressiv
FREE
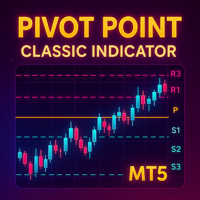
Detailed Description: The Pivot Point Classic Indicator is designed for traders who rely on classic pivot points and midpoints levels for their trading strategies. By automatically calculating and plotting these levels, the indicator provides a clear, visual representation of critical price areas where the market may reverse or break out. Key Features: Automatic Pivot Point Calculations : Automatically calculates pivot points, three support (S1, S2, S3) and resistance (R1, R2, R3) levels bas
FREE

Overview Inspired by Tradingview’s falconCoin, The Market Cipher indicator is a momentum oscillator used to detect overbought/oversold conditions and potential trend reversals. Traders can also use it to spot divergences between price action and momentum for early entry or exit signals. Configuration Guide Core Indicator Settings The indicator calculates momentum using a short-term and a longer-term average. Momentum is plotted as a wave oscillating between overbought and oversold thresholds. Ov
FREE
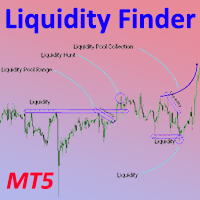
Liquidity Finder Indicator MT5
The Liquidity Finder Indicator MT5 is a specialized tool developed for the MetaTrader 5 platform, created to detect zones of market liquidity. This indicator functions by plotting both fixed and dynamic liquidity levels on the price chart. Blue-colored lines indicate zones of liquidity near recent highs, while red lines mark zones near significant lows. Static lines often align with common chart structures such as Double Bottoms and Double Tops, giving visual clar
FREE

NOTA: CYCLEMAESTRO e' distribuito solo su questo sito web, non ci sono altri distributori. La versione DEMO e' solo per referenza e non e' supportata, la versione definitiva e' perfettamente funzionante e supportata. CYCLEMAESTRO , il primo ed unico indicatore di Analisi Ciclica, utile per dare segnai di TRADING, BUY, SELL, STOP LOSS, ADDING. Creato sulla logica di Serghei Istrati e programmato da Stefano Frisetti ; CYCLEMAESTRO non e' un indicatore come gli altri , la sfida era intepre
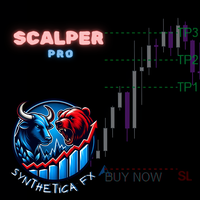
The SyntheticaFX Scalper Pro Indicator is a versatile and user-friendly tool designed to assist traders in identifying high-accuracy entry points across multiple timeframes and all currency pairs. This indicator provides clear visual signals on the chart, along with recommended Stop Loss (SL) and Take Profit (TP) levels, making it easier for traders to plan their trades with confidence. With its built-in dashboard, the SyntheticaFX Scalper Pro Indicator offers real-time trade statistics, helpin
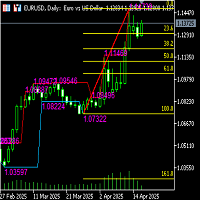
Functional description of automatic Fibonacci line indicator (including high and low channel lines) Indicator name Automatic Fibonacci retracement line + high and low channel auxiliary
Functional introduction This indicator combines the automatically identified high and low points of the band, automatically draws the Fibonacci retracement/extension line, and draws the highest and lowest price channel lines of the current analysis interval to provide traders with clearer support/resistance refe
FREE
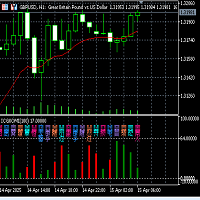
Fuxi Guaxiang Dual-color Oscillation Indicator Function and Usage Instructions (V2.1)
Fuxi Guaxiang Dual-color Oscillation Indicator Instructions: (1) This Guaxiang change indicator is based on the Yin-Yang transformation thought of the "Book of Changes" philosophy in ancient Chinese culture, integrating the results of the long-short game in each candlestick K-line period of the financial trading K-line chart, using China's oldest predictive coding method, in the form of the 64 Guaxiang of the
FREE
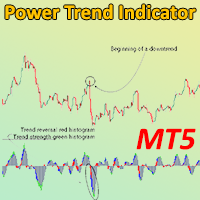
Power Trend Indicator for MetaTrader 5 The Power Trend Indicator for MetaTrader 5 is a dynamic trading utility designed to help traders pinpoint both the direction and momentum of ongoing market trends. This oscillator uses a color-coded histogram to visually represent trend strength. A red bar signifies a trend shift, blue indicates mild trend activity, green denotes strong momentum, and black reflects a flat or indecisive market. It's particularly useful for spotting trend reversals and rapid
FREE
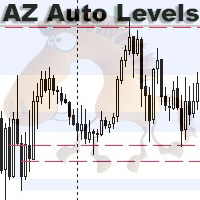
AZ Auto Levels builder ATR edition Indicator of automatic level drawing. For different instruments you need to play with the parameters to find the right ones. So, what is its idea - the indicator searches for levels of interest on the timeframe selected in the settings (by default H1). The search occurs only on candles that are 30% greater than the standard daily ATR of similar candles (you can change this in the settings). ATR is calculated for 20 days ago (also can be changed in the settings)
FREE
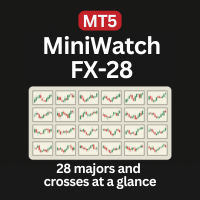
Monitor all 28 Forex pairs at once — clean mini charts, real-time price action, perfect for consistent price pattern traders. Designed for consistent, mechanical, and hybrid traders who repeatedly trade the same price action patterns — such as triangles, flags, trends, and supply/demand zones — across multiple symbols, without relying on indicators.
Core Features: Displays all 28 major Forex pairs in mini chart format , organized in a clean 4-row by 7-column layout. Powered by live price action
FREE
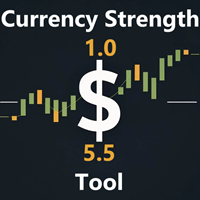
" Currency Strength Tool " is a straightforward and user-friendly indicator designed for analyzing the strength of eight major currencies based on daily price changes of currency pairs. It displays information compactly on the chart in three rows, providing traders with insights into current market dynamics. The indicator serves as an analytical tool, aiding in making informed trading decisions.
It appears as follows: -7.3% 0.5% 0.2% 6.4% 1.2% 3.2% 4.1% 0.4% (daily change) USD E
FREE
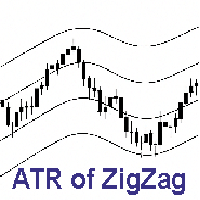
ZigZag Channel Indicator – A Simple Way to Read Market Structure! This indicator automatically calculates the average distance of ZigZag waves and draws a visual channel:
The upper line reflects the average distance of upward waves.
The lower line reflects the average distance of downward waves. Instantly understand market rhythm and price swings.
Use it to identify targets, exits, reversals, and false breakouts.
Perfect for trend analysis, pattern recognition, and measuring move str
FREE
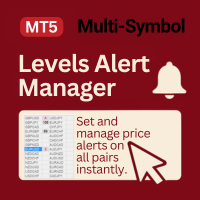
Levels Alert Manager (Beta) is a fast, user-friendly tool for placing and managing price alerts across multiple symbols — ideal for consistent, mechanical, and hybrid trading.
It provides a user-friendly, time-saving alternative to MetaTrader’s default alert system, which can be inefficient and clunky. The process is simple: click the + button, and drag the alert line to the desired level. All alerts are tracked in the panel, displaying live distance to price, with instant notifications trigg
FREE
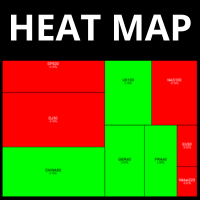
Dynamic Heatmap for MetaTrader 5 — Instantly Spot Market Opportunities Revolutionize the way you see the markets with the most complete and intelligent Heatmap for MetaTrader 5. Designed for traders who demand speed and clarity in decision-making, our Heatmap creates a powerful visual representation of market performance in real time. Key Benefits Instant Read of Market Strength Instantly see which assets are leading or lagging. Dynamic color coding for quick identification: green for ri
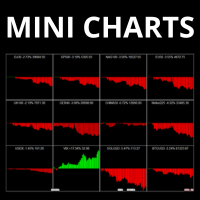
Your market overview, now crystal clear. With our Mini Charts Indicator for MetaTrader 5 , you’ll have the power of multiple charts inside a single, ultra-clean workspace. No more switching between assets or opening dozens of charts. Our Mini Charts give you instant visual snapshots of multiple markets — all in real time. Each mini chart displays the price action of the selected asset, showing whether it’s trending up or down, giving you immediate market sentiment at a glance. Whether you’re mon

# Weekly & Daily Stochastic Signal Indicator User Guide
## Overview This indicator combines the Stochastic oscillator on weekly and daily timeframes to generate strong trading signals. It aims to create more reliable signals by tracking momentum changes across different timeframes.
## Parameters - **ShortPeriod (14)**: Daily Stochastic period - **ShortPeriodSMA (3)**: Daily Stochastic SMA period - **LongPeriod (70)**: Weekly Stochastic period - **LongPeriodSMA (3)**: Weekly Stochastic SMA per

This scanner is based on the Bill Williams Awesome Oscillator (AO) indicator and is designed for faster analysis of financial instruments. The chart shows five vertical columns, which includes a financial instrument that meets certain criteria. The first column shows financial instruments with a strong trend, namely when the AO indicator is above the zero line on three time frames. If there is a strong downward trend in the market, then such instruments will fall into the fifth column. The seco
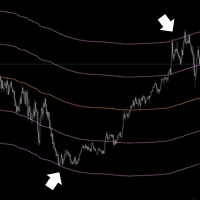
Elevate Your Trading with Advanced Anchored Volume Weighted Average Price Technology Unlock the true power of price action with our premium Anchored VWAP Indicator for MetaTrader 5 - the essential tool for precision entries, strategic exits, and high-probability trend continuation setups. Write me a DM for a 7 day free trial. Anchored VWAP Plus gives traders unprecedented control by allowing custom anchor points for Volume Weighted Average Price calculations on any chart. With support for 4 sim
Этот элегантный индикатор превращает ваш график в многослойную аналитическую панель, визуализируя ключевые уровни старшего таймфрейма прямо на текущем периоде. Идеальное решение для трейдеров, ценящих контекст и четкие структурные уровни. Ключевые особенности: Автоматическая синхронизация с выбранным старшим таймфреймом (M1-MN1) Двойные динамические линии открытия/закрытия каждого бара старшего ТФ Интеллектуальная цветовая схема: Ярко-зеленый для бычьих баров Алый красный для медв
FREE
VolumeView – Индикатор тиковых объёмов Описание: VolumeView — это визуальный индикатор, отображающий тиковые объёмы непосредственно на графике в виде горизонтальных линий разной длины. Цвет линии указывает направление свечи: Зелёный — объём на бычьей свече (цена закрытия выше открытия) Красный — объём на медвежьей свече (цена закрытия ниже открытия) Особенности: Отображает объёмы за определённое количество последних дней Поддерживает настройку минимального порога отображаемого объёма Рабо
FREE
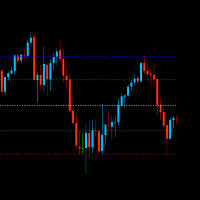
Top and bottom indicator, with the freedom to choose the initial bar and graphic time to be used for calculation regardless of the time frame of the current chart. It also plots mid-range and 23% retracement lines. Good indicator of market strength and current direction of price movement. Also with total freedom of configuration of line types and colors for each line of the indicator. It also has an indicator of the time to bar and open balance in the asset.
FREE
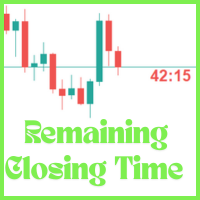
The Candle Remaining Closing Time indicator displays the amount of time left before the current candlestick closes on your chart. This tool is essential for traders who rely on precise timing to enter or exit trades, especially in fast-moving markets. By showing a real-time countdown, it helps you stay aware of upcoming candle completions across any timeframe—from 1-minute to daily charts. Whether you're a scalper watching minute-by-minute action or a swing trader timing key setups on higher tim
FREE
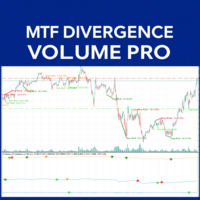
Divergence MTF Volume Pro: Your Ultimate Edge in the Market
Have you ever felt that the market takes you by surprise? Would you like a tool that anticipates possible turns and provides clearer signals for entering or exiting trades? Introducing Divergence MTF Volume Pro! Imagine seeing when price and volume (the force behind movements) start to contradict each other. This, known as divergence, is one of the most powerful signals indicating a potential trend reversal or strong continuation. Our

Dynamic Levels Marker is a smart MT5 indicator that automatically detects and plots three support and three resistance levels using a tiered historical analysis. Levels are visually distinct, labeled, and adapt as price evolves.
Key Features:
Dynamic multi-level support/resistance zones
Tiered logic based on recent price action
Customizable alerts (popup, sound, push notifications)
Clean visual lines with auto-positioned labels
Lightweight and easy to use on any timeframe
Whether you’re

Simple Candle Timer
Overview: The Simple Candle Timer is a simple, yet powerful, tool for traders who want to stay informed about the time remaining until the next candle appears on their chart. Whether you are trading on minute charts or higher timeframes, this indicator ensures you never miss a new candle formation.
Features: Real-Time Countdown Timer: Displays the time left until the current candle closes and a new one starts. The timer updates smoothly every 100 milliseconds for precision

Volume Flow Analyzer The Indicator helps you decode market activity by visualizing real-time volume strength. Whether you're a fast-paced scalper or a patient swing trader , this tool gives you a clearer view of when volume truly supports the price action.
Instructions: Indicator alerts when there is expected increase in volatility by analyzing volumes to allow a trader to prepare. It indicates "High Expected Volatility in such cases", It should be used along with your buy and sell parameters

GoldX PRO is a good trend indicator. The indicator's unique algorithm analyzes the asset price movement, taking into account technical and mathematical analysis factors, determines the most profitable entry points and issues a signal to open a BUY or SELL order. Special offer - https://www.mql5.com/en/users/bossik2810/news
Advantages of the indicator: The indicator produces signals with high accuracy. The confirmed indicator signal does not disappear and is not redrawn - after the signal is co

The Swing High Low and Fibonacci Retracement Indicator is a powerful technical analysis tool designed to identify key price levels and potential reversal zones in the market. It automatically detects recent swing highs and swing lows on the chart and overlays Fibonacci retracement levels based on these points. This indicator helps traders: Visualize market structure by highlighting recent swing points. Identify support and resistance zones using Fibonacci ratios (e.g., 38.2%, 50%, 61.8%). Adapt

The Quasimodo Pattern Indicator is no more difficult than the Head and Shoulders. Still, only a few traders know about it, and some even confuse one with the other. However, this is not a reason to avoid this tool in your forex trading strategy. Features: Automatic Detection: The indicator automatically scans for valid QM patterns across any timeframe, reducing the need for manual chart analysis. Visual Highlights: Clear and customizable on-chart drawing of shoulders, heads, and breakout zones
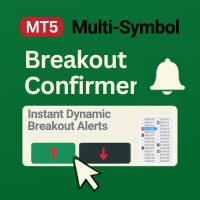
The Breakout Confirmer tracks price breakouts based on a user-selected break methodology and is activated instantly for each symbol separately with a button click. The tool works perfectly for confirming reversal alerts. Unlike standard reversal indicators, it lets the user cherry-pick the symbols they want to track, ensuring only high-quality alerts that match their strategy are issued. No more staring at charts all day. Get alerted only when it truly matters — precisely and consistently. Just

This indicator is converted from Pinescript to MQL5 and consisting of buffers for the range lines as well, its not only object.
The Range Detector indicator aims to detect and highlight intervals where prices are ranging. The extremities of the ranges are highlighted in real-time, with breakouts being indicated by the color changes of the extremities.
USAGE Ranging prices are defined by a period of stationarity, that is where prices move within a specific range.
Detecting ranging marke
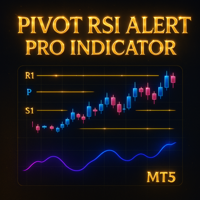
Detailed Description: The Pivot RSI Alert Pro Indicator is a powerful all-in-one indicator that combines five pivot point methods (Classic, Fibonacci, Woodie, Camarilla, DeMark) with a customizable RSI filter. It automatically plots daily pivot levels and midpoints, highlights key reversal zones and sends alerts when price approaches these levels, especially under RSI overbought/oversold conditions. Ideal for intraday and swing traders who rely on dynamic support/resistance and momentum confirm
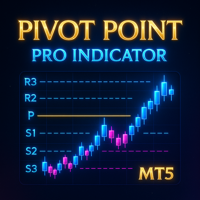
Detailed Description: The Pivot Point Pro Indicator is a powerful all-in-one fully customizable indicator that takes care of five pivot point methods (Classic, Fibonacci, Woodie, Camarilla, DeMark). It automatically plots pivot levels and midpoints, highlights key reversal zones and sends alerts when price approaches these levels. Unlike the free Pivot Point Classic version, this Pro indicator allows users to customize more settings, analyze current and historical pivot points and use al

Unlock the potential of automated trading on Gold (XAUUSD) and Euro/USD (EURUSD) with the Gold Euro Edge indicator . This indicator is expertly designed to capitalize on market movements in these key pairs, aiming for consistent performance by displaying buy or sell arrows on chart, audible alerts on laptop and notifications to phone. Experience efficiency and potentially enhance your trading strategy with this specialized solution.
Market Flow Analysis is a structure-based indicator that goes beyond traditional tools to help you spot real entry opportunities with ease. It highlights the Gold Zone — a gold-filled rectangle showing you the best possible area for entries , based on market structure, not lagging signals. Whether you're scalping or swing trading, this indicator gives you the true market trend , valid order blocks , and clear reaction zones , all in one smart visual layout. Why Market Flow Analysis? Go

مؤشر Smart Trend Candles هو أداة فعّالة في منصة MetaTrader 4، تجمع بين عناصر تحليل فني متعددة لتحديد اتجاهات السوق وقياس قوة المشترين والبائعين. يوفر هذا المؤشر متعدد الاستخدامات إشارات مرئية واضحة تُحسّن قرارات التداول الخاصة بك. الميزات الرئيسية 1. تحديد الاتجاه يستخدم شموع Heikin-Ashi المعدلة (اختياري) لتصفية ضوضاء السوق يتضمن متوسطًا متحركًا (فترة قابلة للتكوين) لتأكيد الاتجاه تنفيذ مؤشر القوة النسبية لقياس الزخم 2. قياس القوة تشير الشموع المرمزة بالألوان إلى شدة ضغط الشراء/البيع تحليل الحج

IQ Gold Gann Levels a non-repainting, precision tool designed exclusively for XAUUSD/Gold intraday trading. It uses W.D. Gann’s square root method to plot real-time support and resistance levels, helping traders spot high-probability entries with confidence and clarity. William Delbert Gann (W.D. Gann) was an exceptional market analyst, whose trading technique was based on a complex blend of mathematics, geometry, astrology, and ancient mathematics which proved to be extremely accurate. Download
Haven Average Daily Range è un indicatore che calcola e visualizza la gamma media giornaliera dei prezzi per gli strumenti finanziari nel Forex e in altri mercati. Altri prodotti -> QUI Caratteristiche principali: Calcolo dell'ADR basato su più periodi (5, 10 e 20 giorni) Visualizzazione dei livelli ADR con cambio automatico di stile al raggiungimento della gamma Indicazione visiva chiara dell'inizio e della fine della giornata di trading Parametri di visualizzazione personalizzabili (colore, s
FREE
L' High Low Tracker è un indicatore essenziale per qualsiasi trader che apprezzi la precisione e la chiarezza nell'identificazione dei livelli di prezzo chiave. Progettato per i trader che utilizzano strategie istituzionali come ICT (Inner Circle Trader) , BTMM (Bank Trading Market Maker) e SMC (Smart Money Concepts) , questo strumento semplifica l'analisi multi-timeframe tracciando massimi e minimi significativi direttamente sul grafico corrente. Che tu stia facendo scalping
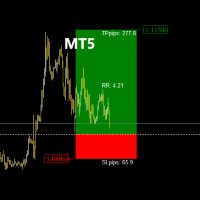
The TradeManagerRR Visualizer MT5 is a trade management indicator designed for traders who want to easily visualize their Take Profit (TP) and Stop Loss (SL) levels on a chart. This initial version provides a simple graphical representation that displays SL and TP zones as well as the entry price. Please note that this current version focuses solely on the graphical display of SL and TP zones as figures on the chart. Current Version Features: SL and TP Zones Display: Clear visualization of
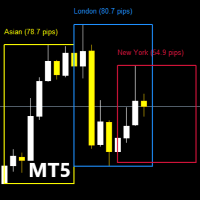
Before diving into the features of this indicator, please remember to rate this product, leave a comment to share your experience, and subscribe to my page to stay informed about the latest updates and new tools. Your support is invaluable and helps me constantly improve my creations! Description: TradingSessionPipsVisualizer - The Professional Tool for Mastering Trading Sessions Visualize Forex sessions at a glance and optimize your trading timing! The TradingSessionPipsVisualizer is a pr
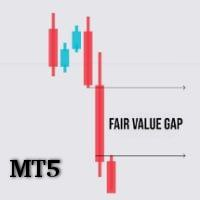
FVG Analyzer – The Ultimate Tool for Precise Fair Value Gap (FVG) Detection FVG Analyzer is a powerful and fully customizable indicator built for serious traders who leverage Fair Value Gaps (FVG) in their strategies. With smart detection and clean visuals, this tool allows you to quickly identify market inefficiencies—areas where price is likely to return before continuing in its trend. Key Features: Automatic Detection of Fair Value Gaps (bullish and bearish) based on candlestick patte
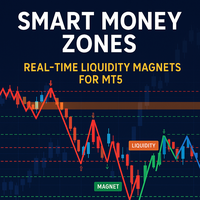
Developed according to the principles of smart money management strategies, the SM Zones indicator is a very convenient tool for traders on the MetaTrader 5 (MT5) platform. It graphically displays on the chart all the significant zones used in the SM strategy: market structure, price levels of increased liquidity, "price magnet" zones - imbalances, order blocks, fvg, breaker blocks and mitigation blocks - towards which the instrument's price moves. The zones influencing the bull market are high
FREE
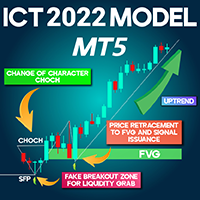
ICT 2022 Model Indicator for MetaTrader 5 The ICT 2022 Indicator is developed based on essential trading principles such as liquidity grabs (Sweep), Change of Character (CHoCH), fake breakouts (SFP), and Fair Value Gaps (FVG) .
By integrating these concepts, the indicator visually represents them on the price chart, making it an invaluable resource for traders and analysts following the ICT trading methodology . «Indicator Installation & User Guide» MT5 Indicator Installation | ICT two thousan
FREE
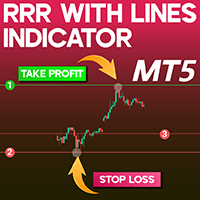
RRR with lines Indicator Download MT5 Effective risk management is a fundamental aspect of sustainable trading in financial markets. The RRR Indicator in MetaTrader 5 provides traders with a structured approach to calculating the Risk-to-Reward Ratio (RRR) . By drawing three adjustable horizontal lines, it assists traders in setting Stop Loss and Take Profit levels with precision. «Indicator Installation & User Guide» MT5 Indicator Installation | RRR with lines Indicator MT5 | ALL Products By
FREE

Overview:
"TrendLine Alerts" is a dynamic, multi-functional trading tool designed to monitor and alert traders in real-time when price action touches or breaks critical technical levels. Built for precision, it seamlessly tracks trendlines, horizontal support/resistance, vertical time-based lines, and equidistant channels , ensuring you never miss a key market movement. Whether you’re scalping, swing trading, or managing long-term positions, this indicator acts as your 24/7 market sentinel. K
MetaTrader Market - i robot di trading e gli indicatori tecnici per trader sono disponibili nel tuo terminale di trading.
Il sistema di pagamento MQL5.community è disponibile per tutti gli utenti registrati sul sito MQL5.com che effettuano transazioni su MetaTrader Services. Puoi depositare e prelevare denaro usando WebMoney, PayPal o una carta di credito.
Ti stai perdendo delle opportunità di trading:
- App di trading gratuite
- Oltre 8.000 segnali per il copy trading
- Notizie economiche per esplorare i mercati finanziari
Registrazione
Accedi
Se non hai un account, registrati
Consenti l'uso dei cookie per accedere al sito MQL5.com.
Abilita le impostazioni necessarie nel browser, altrimenti non sarà possibile accedere.