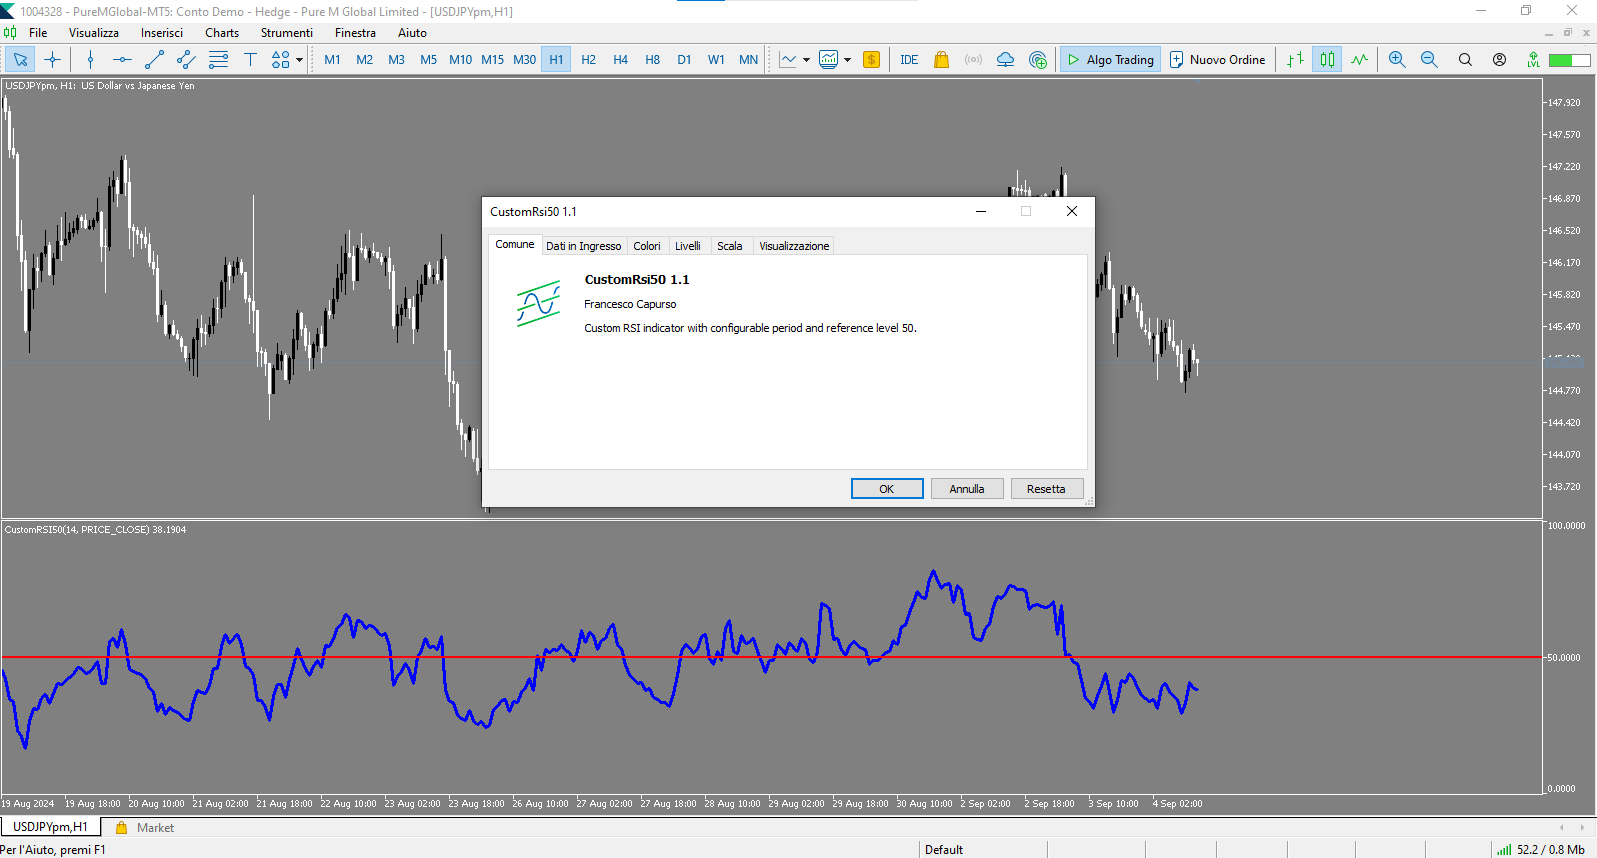
CustomRsi50
- Indicateurs
- Francesco Capurso
- Version: 1.4
- Mise à jour: 6 septembre 2024
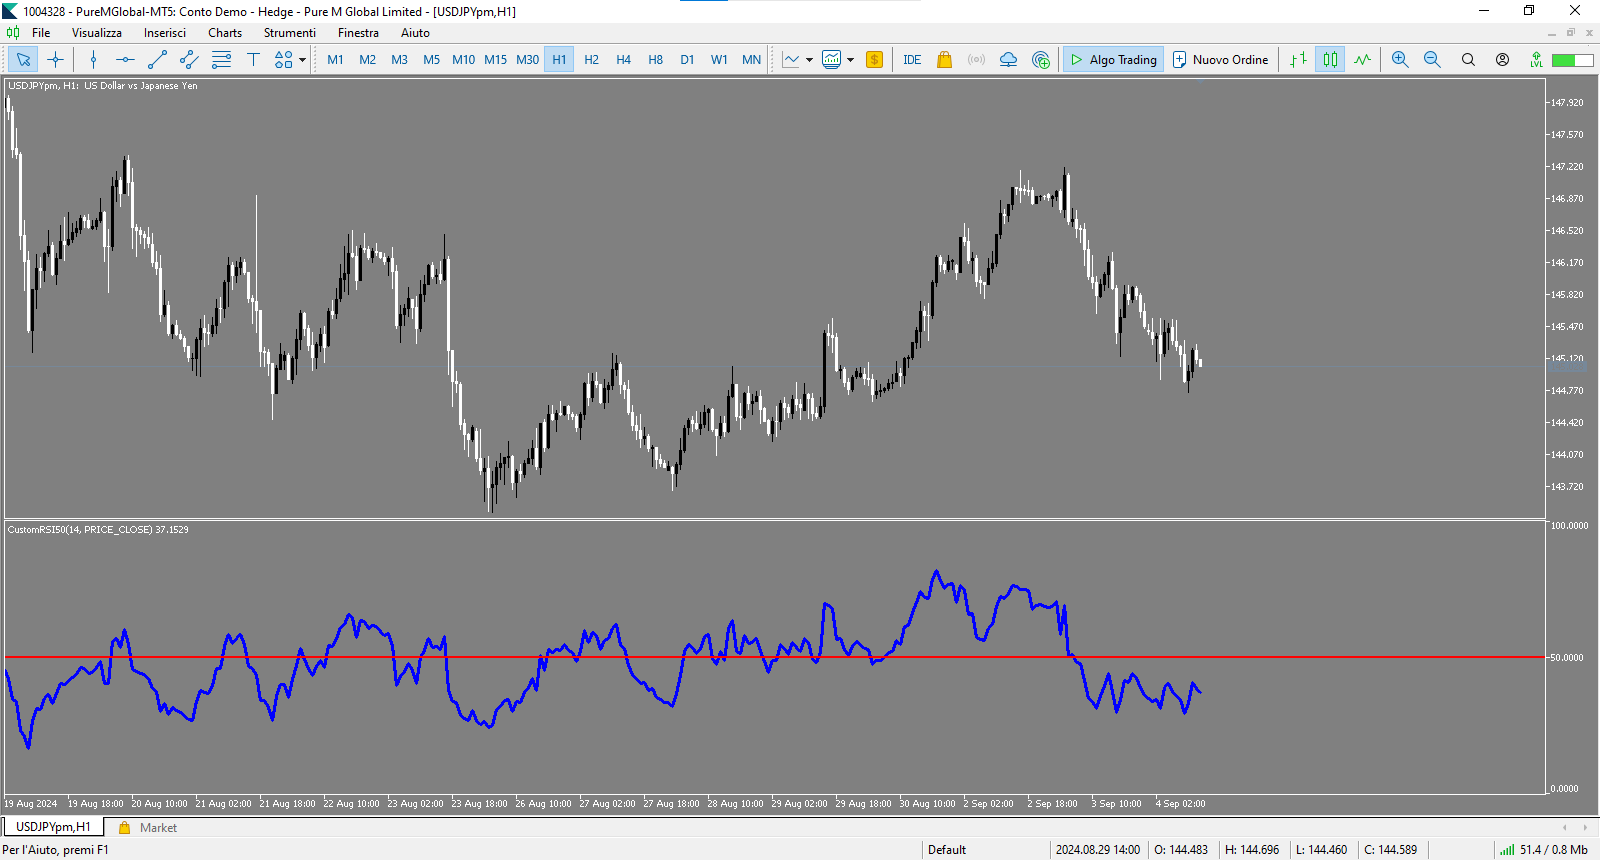
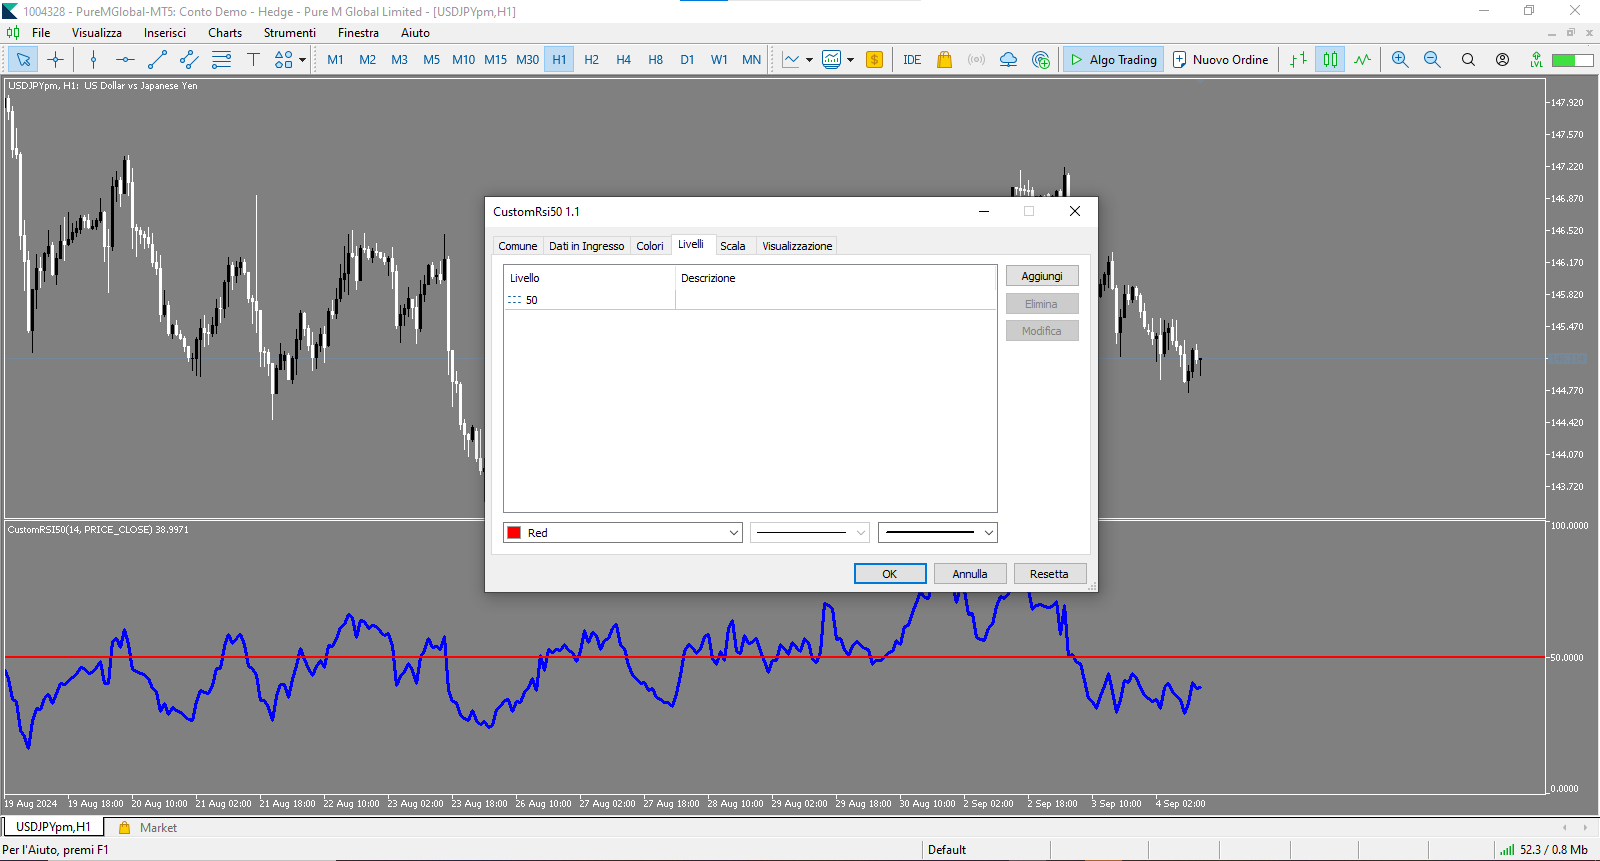
CustomRSI50 - Indicateur RSI personnalisé avec niveau 50
Description
CustomRSI50 est un indicateur technique personnalisé basé sur le populaire Relative Strength Index (RSI). Cet indicateur offre une visualisation claire et personnalisable du RSI avec un accent particulier sur le niveau 50, crucial pour de nombreux traders dans l'analyse du momentum.
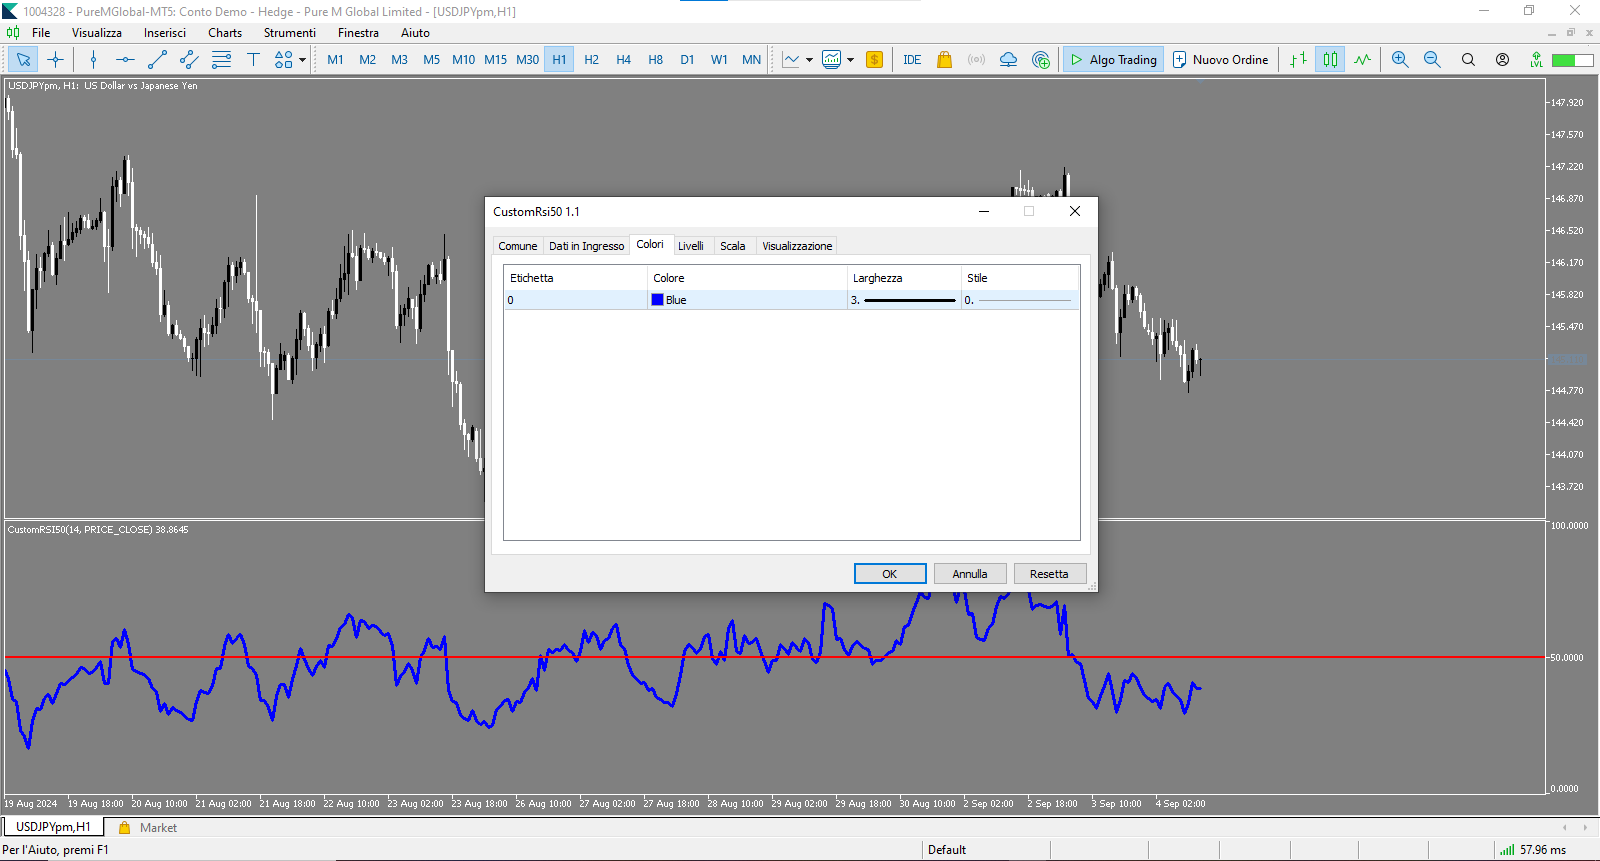
Caractéristiques principales
- Période RSI configurable
- Niveau de référence 50 mis en évidence
- Type de prix appliqué personnalisable
- Affichage dans une fenêtre séparée
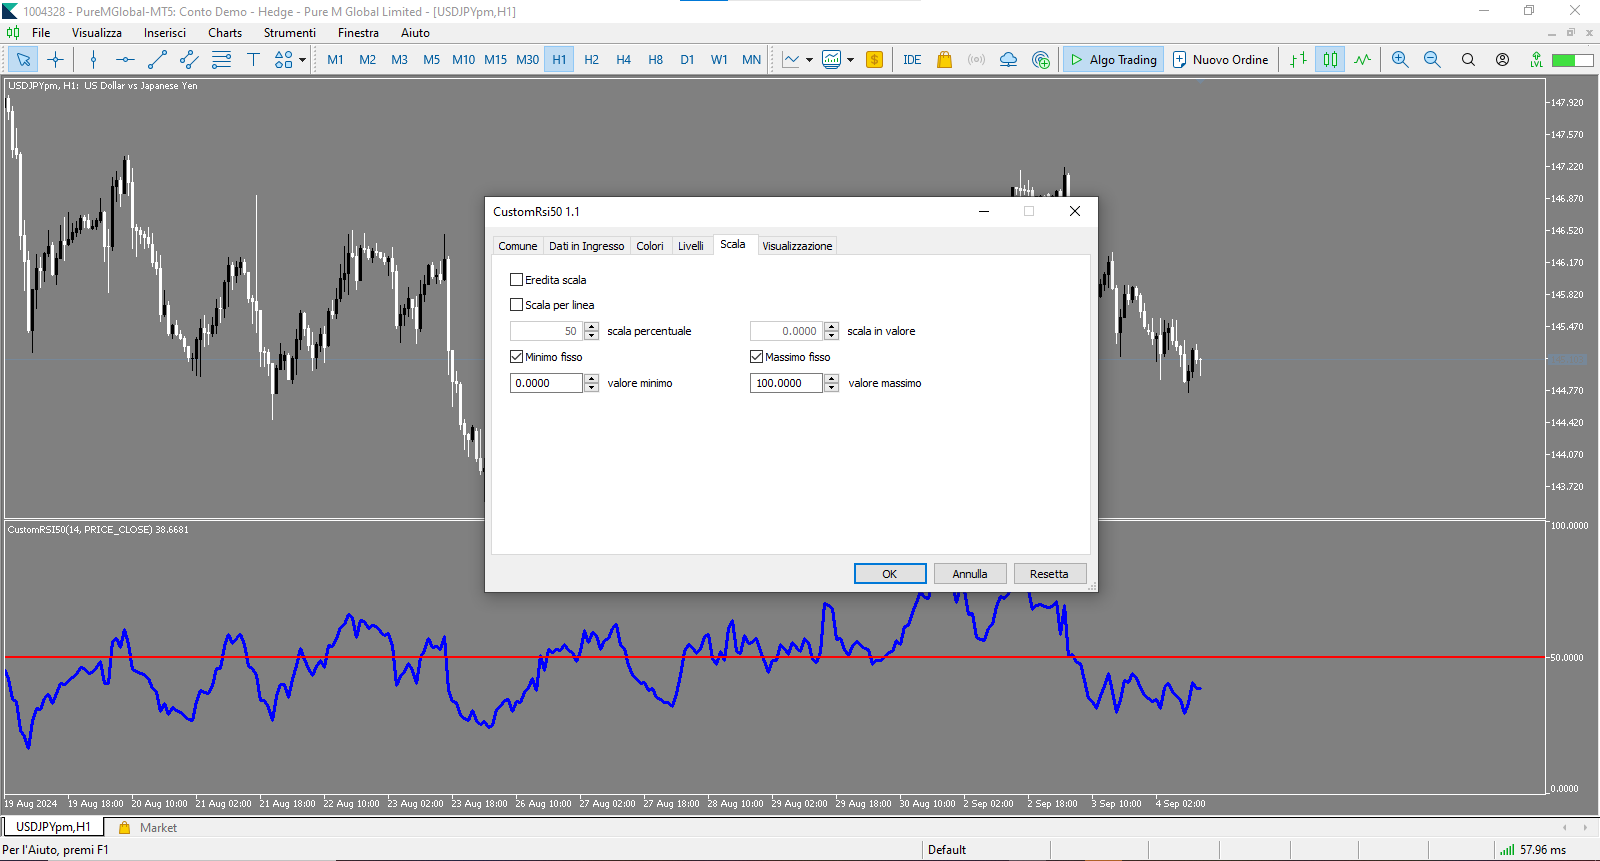
- Échelle fixe de 0 à 100 pour une interprétation facile
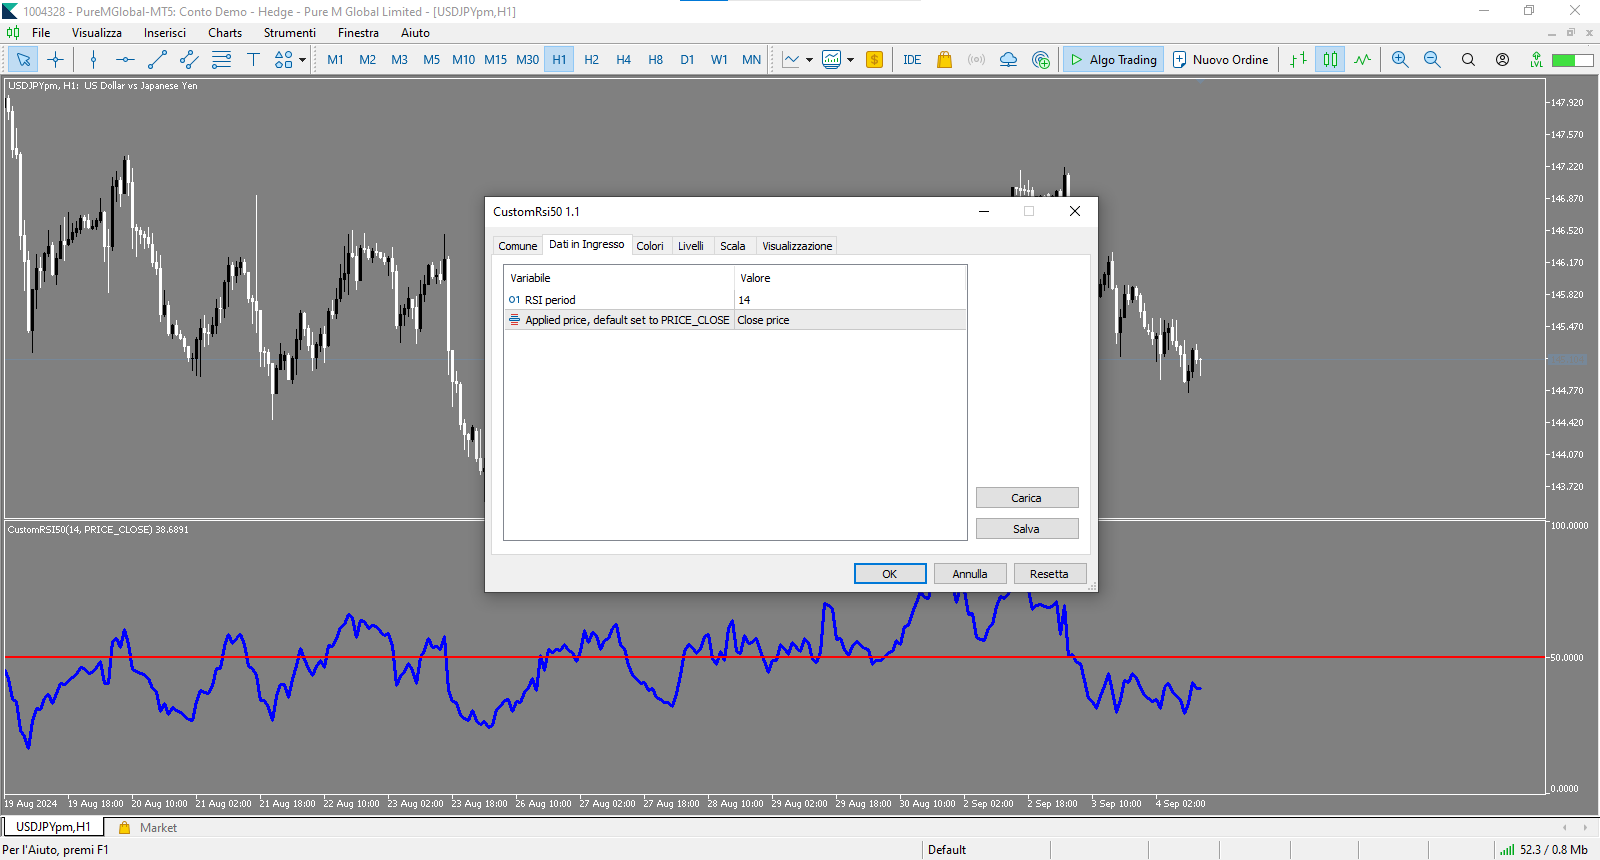
Paramètres personnalisables
- RSI_Period : Permet de définir la période pour le calcul du RSI (par défaut : 14)
- applied_price : Permet de sélectionner le type de prix pour le calcul (par défaut : prix de clôture)
Comment utiliser CustomRSI50
- Appliquez l'indicateur sur n'importe quel graphique dans votre MetaTrader 5
- Personnalisez la période RSI et le type de prix selon vos préférences
- Observez le mouvement du RSI par rapport au niveau 50 :
- Les valeurs au-dessus de 50 indiquent un momentum haussier
- Les valeurs en dessous de 50 indiquent un momentum baissier
Avantages
- Visualisation claire du momentum du marché
- Identification facile des changements de tendance autour du niveau 50
- Personnalisation pour s'adapter à diverses stratégies de trading
CustomRSI50 est l'outil idéal pour les traders qui souhaitent une analyse RSI claire et personnalisable, avec un accent particulier sur le niveau critique 50.
Note
Cet indicateur est fourni gratuitement à la communauté de trading. Veuillez laisser un commentaire ou une évaluation si vous le trouvez utile dans votre trading.
Changelog
- Version 1.4 - [06/09/2024]
- Correction d'un problème où la ligne RSI était interrompue.
- Amélioration de l'initialisation du buffer pour garantir une représentation plus précise des valeurs RSI sur tout le graphique.
- Optimisation du calcul du RSI pour une plus grande précision.
- Ajout de sorties de débogage pour faciliter la résolution de problèmes futurs.
- Amélioration de la gestion des données pour un affichage plus fluide de l'indicateur.
Ces mises à jour améliorent significativement la stabilité et la précision de l'indicateur CustomRSI50, offrant une visualisation plus fiable du momentum du marché.