• Información general
  • Comentarios
  • Discusión
  • Novedades

CustomRsi50

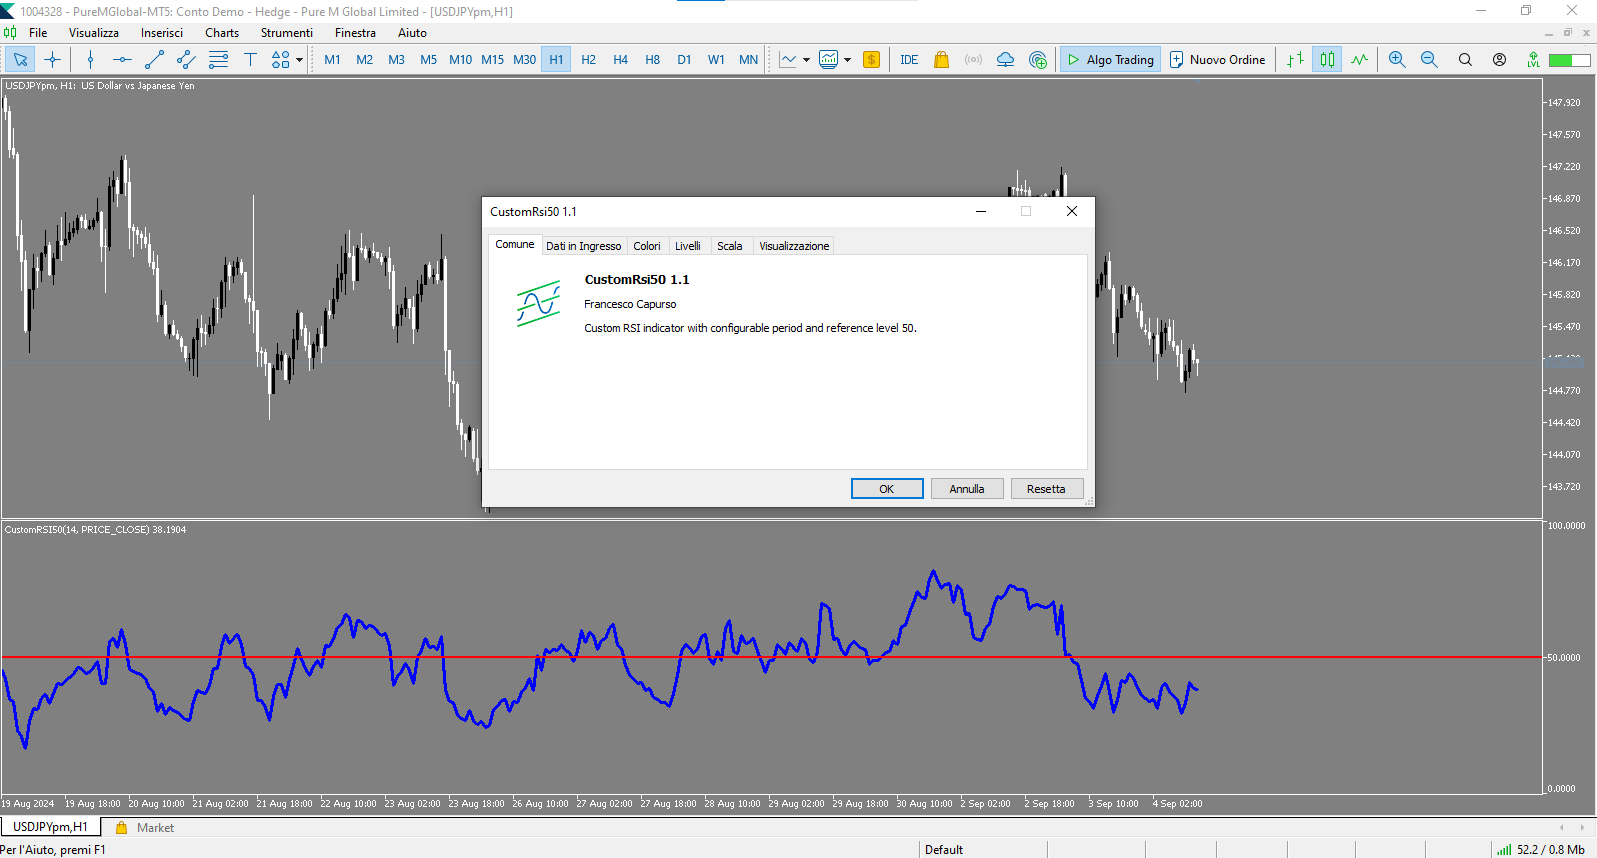
CustomRSI50 - Indicador RSI personalizado con nivel 50

Descripción

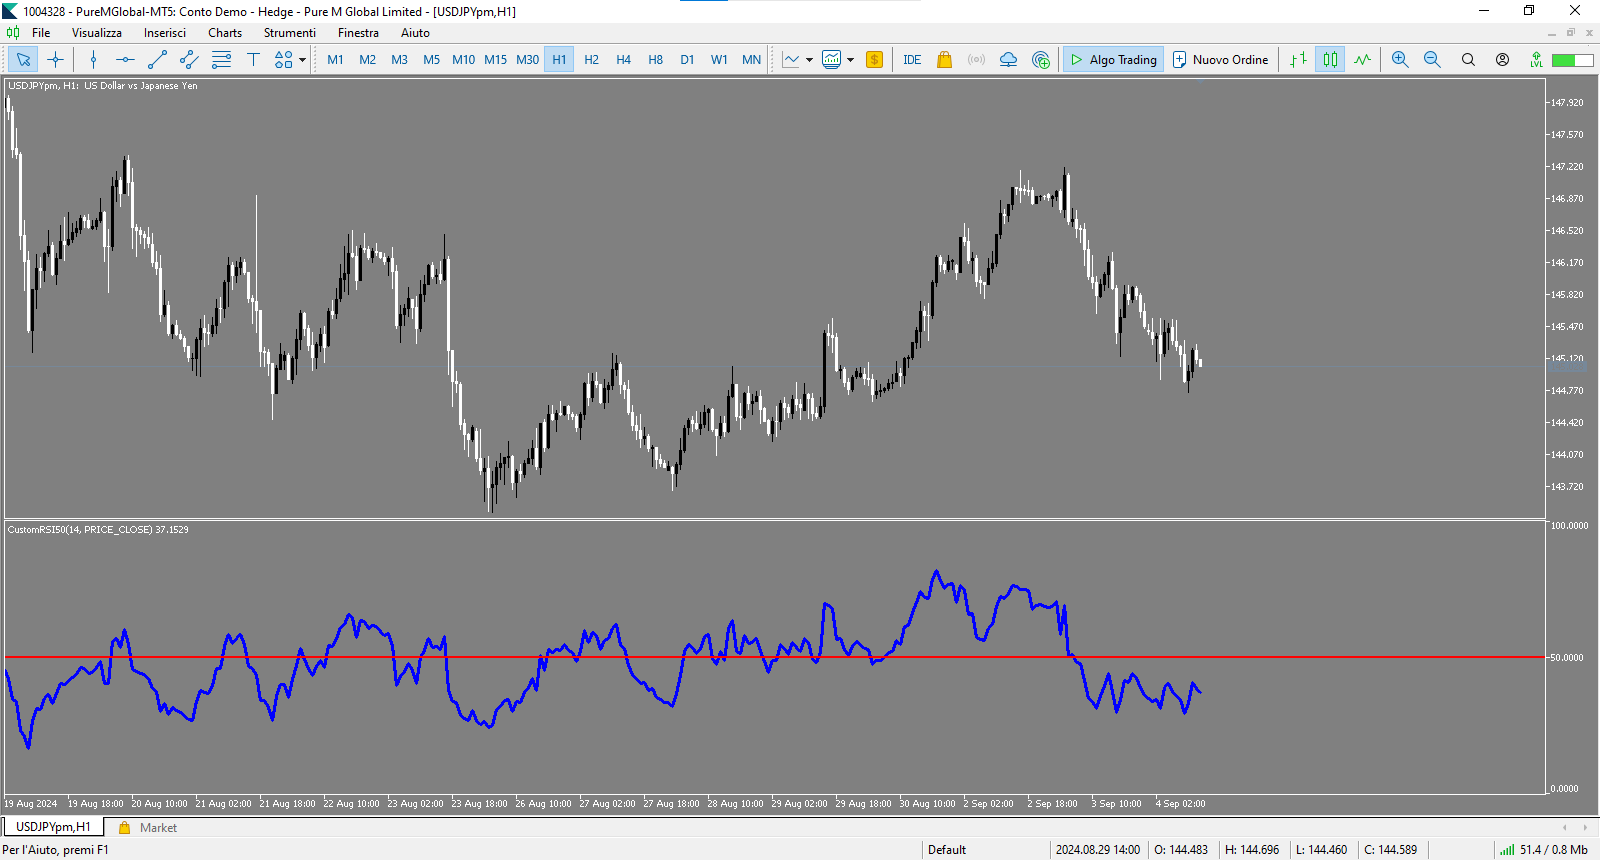
CustomRSI50 es un indicador técnico personalizado basado en el popular Índice de Fuerza Relativa (RSI). Este indicador ofrece una visualización clara y personalizable del RSI con un énfasis particular en el nivel 50, que es crucial para muchos traders en el análisis de momentum.

Características principales

  • Período RSI configurable
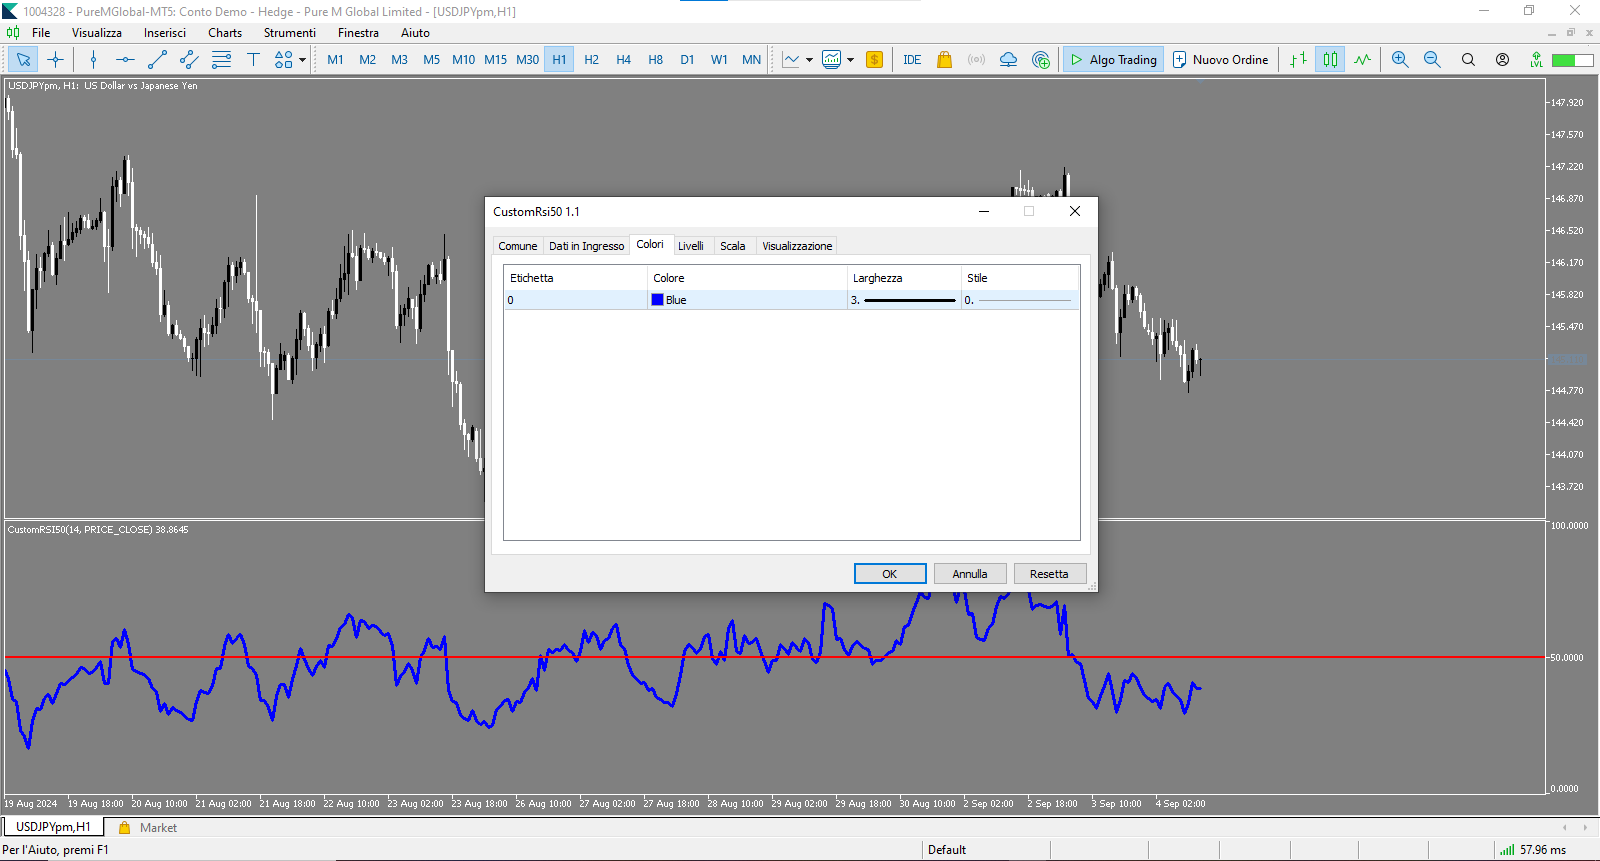
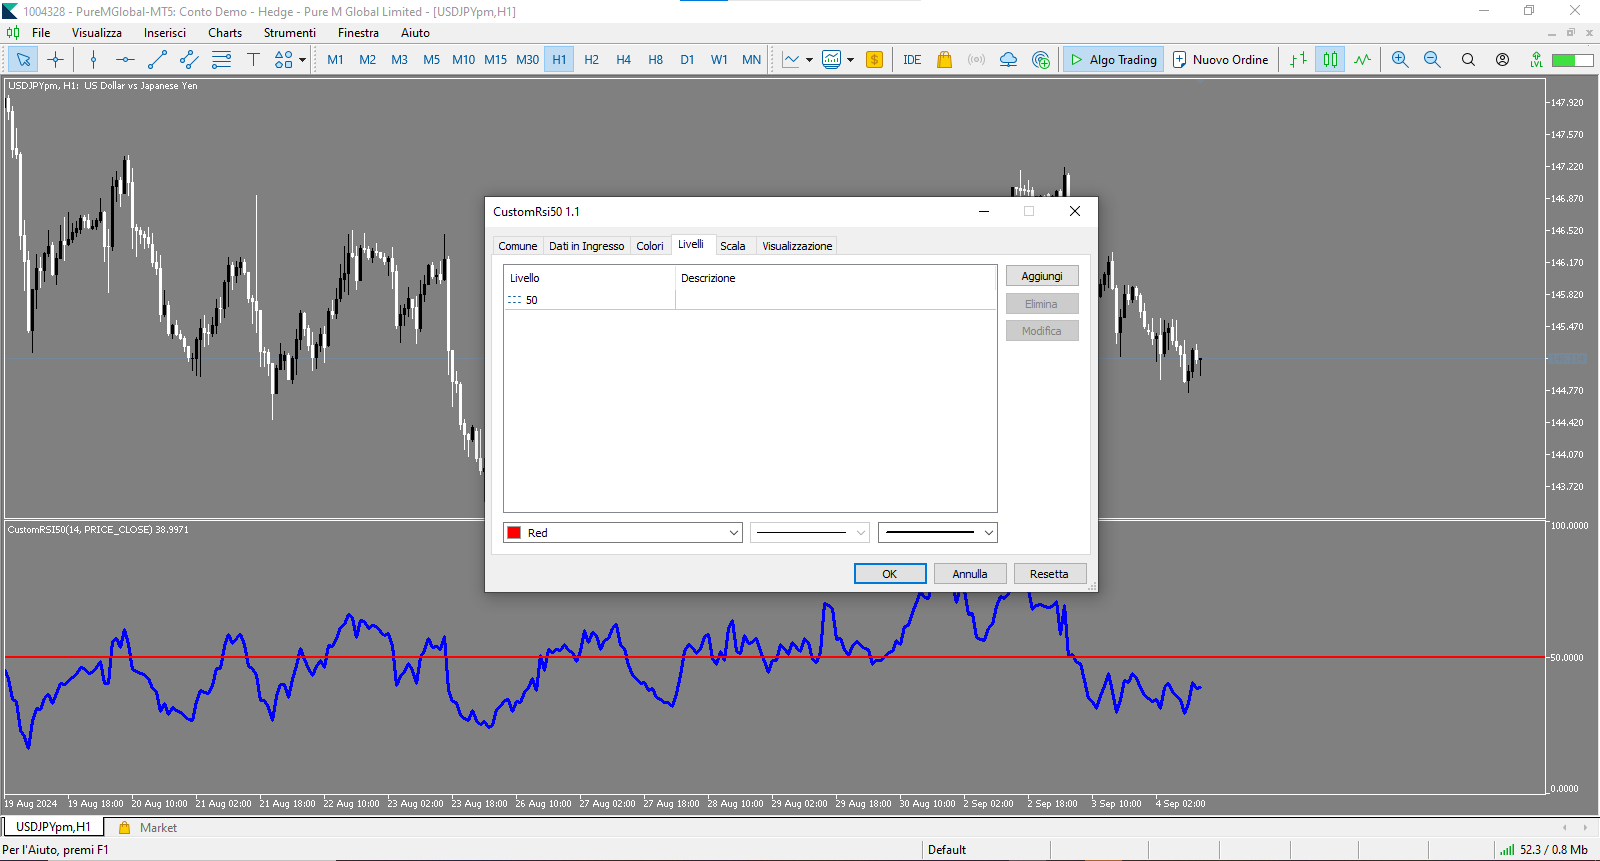
  • Nivel de referencia 50 resaltado
  • Tipo de precio aplicado personalizable
  • Visualización en ventana separada
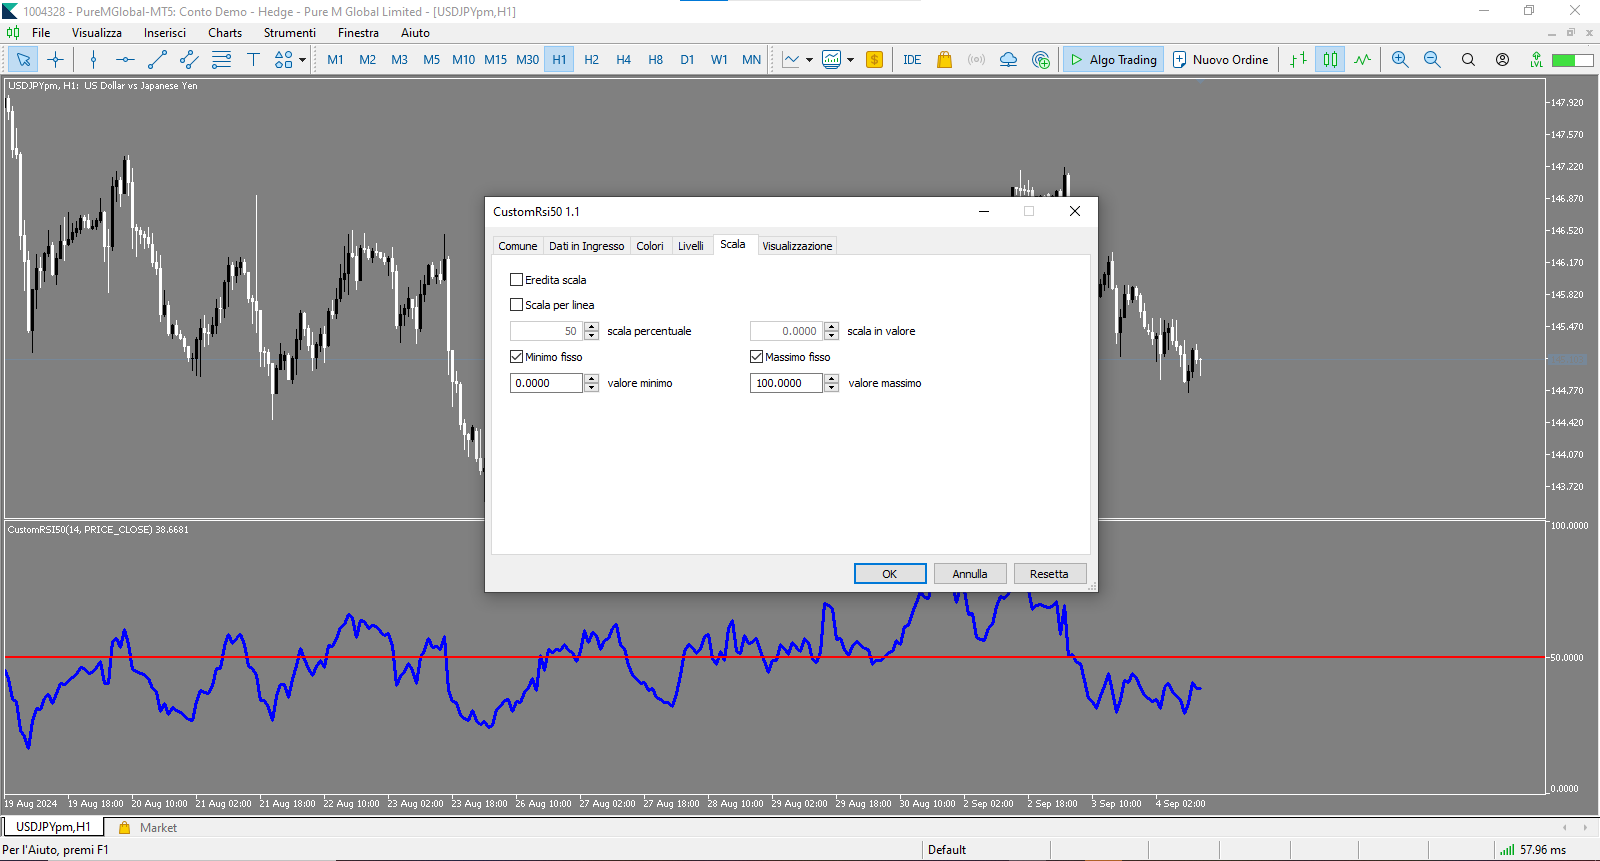
  • Escala fija de 0 a 100 para fácil interpretación

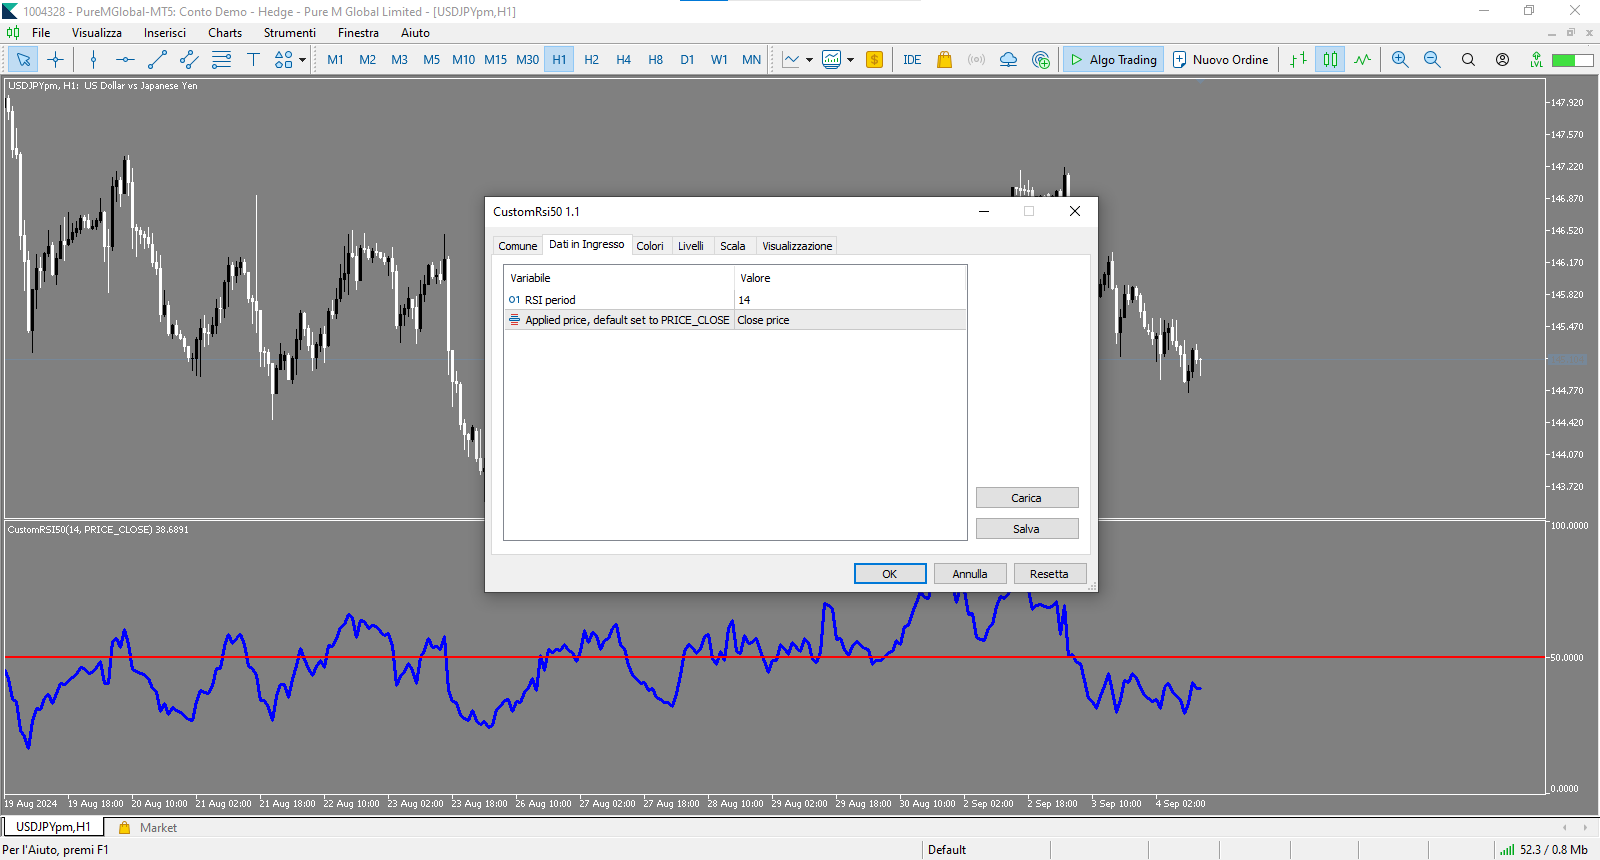
Parámetros personalizables

  • RSI_Period: Permite establecer el período para el cálculo del RSI (por defecto: 14)
  • applied_price: Permite seleccionar el tipo de precio para el cálculo (por defecto: precio de cierre)

Cómo usar CustomRSI50

  1. Aplique el indicador a cualquier gráfico en su MetaTrader 5
  2. Personalice el período RSI y el tipo de precio según sus preferencias
  3. Observe el movimiento del RSI en relación con el nivel 50:
    • Valores por encima de 50 indican momentum alcista
    • Valores por debajo de 50 indican momentum bajista

Ventajas

  • Visualización clara del momentum del mercado
  • Fácil identificación de cambios de tendencia alrededor del nivel 50
  • Personalización para adaptarse a diversas estrategias de trading

CustomRSI50 es la herramienta ideal para traders que desean un análisis RSI claro y personalizable, con un enfoque particular en el nivel crítico 50.

Nota

Este indicador se proporciona de forma gratuita a la comunidad de trading. Por favor, deje comentarios o una calificación si lo encuentra útil en su trading.

Changelog

  • Versión 1.4 - [06/09/2024]
    • Se solucionó el problema de visualización del indicador que causaba una interrupción en la línea RSI.
    • Mejorada la inicialización del buffer para garantizar una representación más precisa de los valores RSI en todo el gráfico.
    • Optimizado el cálculo del RSI para una mayor precisión.
    • Añadida salida de depuración para facilitar la resolución de problemas futuros.
    • Mejorada la gestión de datos para una visualización más fluida del indicador.

    Estas actualizaciones mejoran significativamente la estabilidad y precisión del indicador CustomRSI50, ofreciendo una visualización más fiable del momentum del mercado.

Productos recomendados
We have all seen a currency pair enter the overbought or oversold territory and stay there for long periods of time. What this indicator does is gives you the emphasis. So if you are looking for reversals then you may want to take notice when oversold territory is entered into with a bullish engulfing candle or if the trend is your thing then check for bearish engulfing candles while entering oversold. This indicator will show a downward arrow when it detects a bearish engulfing candle while cro
FREE
RFOC Mini Chart
Ronaldo Franco De Oliveira Cardoso
The RFOC Mini Chart was created to project a macro view of the market, which the option to select the timeframe of interest other than the main chart, it is possible to include 2 indicators: 1 - Moving average channel On the mini chart, the moving average will be created based on the prices of the selected time frame for the RFOC Mini Chart. The moving average period must be selected in the indicator settings pannel. 2 - Boillinger Band In the mini chart, a boillinger band will be created base
FREE
If you are (or were) a fan of the RSI indicator will love Tushar Chande's Dynamic Momentum Index indicator, that simply put is a dynamic variable lenght RSI, so it is more powerful. The DMI indicator internally uses a variable number of bars in its calculations, taking into consideration the volatility levels of the current market you are analyzing. This way, the DMI indicator will use more bars as volatility decreases and less bars when volatility increases, giving you a more powerfull analysis
FREE
Follow The Line MT5
Oliver Gideon Amofa Appiah
4.5 (28)
This indicator obeys the popular maxim that: "THE TREND IS YOUR FRIEND" It paints a GREEN line for BUY and also paints a RED line for SELL. (you can change the colors). It gives alarms and alerts of all kinds. IT DOES NOT REPAINT and can be used for all currency pairs and timeframes. Yes, as easy and simple as that. Even a newbie can use it to make great and reliable trades. NB: For best results, get my other premium indicators for more powerful and reliable signals. Get them here: https://www.m
FREE
Multi RsI BB MT5
Mansour Babasafary
5 (1)
A combined indicator of two famous indicators: RSI , Bollinger Bands Can be used in all currency pairs Can be used in all time frames with many signals Very simple and fast to use Description: This indicator is made from the combination of RSI and Bollinger Bands indicators As you can see, it shows good signals and is worth using and testing We hope you are satisfied with this indicator Settings: show past show candle: Displays the number of candles that the indicator calculates. For
FREE
Tunnel Warrens MT5
Dariel Iserne Carrera
Esta es la versión MT5 Aquí hay varios indicadores que funcionan juntos. Básicamente funciona con medias móviles y varios niveles de ATR creando un canal dinámico a través del cual se drena el precio. Como siempre recomiendo, deberías probarlo antes de usarlo en vivo para que entiendas cómo funciona. La señal de entrada en el mercado es similar a otros indicadores MA, pero con éste también tienes un análisis gráfico del momento en que se encuentra la tendencia y niveles dinámicos para ajustar tu
FREE
FractalEfficiencyIndicator   A ratio between 0 and 1 with the higher values representing a more efficient or trending market,  It is used in the calculation of Perry J. Kaufman Adaptive Moving Average (KAMA), dividing the price change over a period by the absolute sum of the price movements that occurred to achieve that change. The Fractal Efficiency or also known as Efficiency Ratio was first published by Perry J. Kaufman in his book   ‘Smarter Trading‘. This is mostly considered a filter for v
FREE
Mitimom
Danil Poletavkin
The indicator is based on Robert Miner's methodology described in his book "High probability trading strategies" and displays signals along with momentum of 2 timeframes. A Stochastic oscillator is used as a momentum indicator. The settings speak for themselves period_1 is the current timeframe, 'current' period_2 is indicated - the senior timeframe is 4 or 5 times larger than the current one. For example, if the current one is 5 minutes, then the older one will be 20 minutes The rest of the
FREE
Money Flow Index EA Friendly
Flavio Javier Jarabeck
3.5 (2)
The traditional Money Flow Index indicator, this time, EA friendly . There are 3 buffers exposed that can be used by EAs to automatically analyze the Overbought and Oversold conditions of the quote. Just use the traditional iCustom() function to get these signals. This Money Flow Index calculation is based on the traditional Metaquote's MFI indicator. SETTINGS MFI Period Volume type to analyze (Real Volume or Ticks) Starting Overbought region Starting Oversold region USING WITH EAs Buffer
FREE
Ribbon Trend for MT5
Sutthichai Mungdee
5 (4)
This indicator is a simple tool to spot a possible trend. When the ribbon below the price bars, It will turn to Green color and the trend is seen to be bullish When the   ribbon above the price bars, it will turn to Red color and the trend is seen to be bearish. It can be used a either Entry Signal Exit Signal or trailing stop, so it is very versatile. By default color : Green is UP trend and Red is Down trend and this work perfect with   Bar4Colors.ex5
FREE
An analogue of the Stochastic oscillator based on algorithms of singular spectrum analysis (SSA) SSA is an effective method to handle non-stationary time series with unknown internal structure. It is used for determining the main components (trend, seasonal and wave fluctuations), smoothing and noise reduction. The method allows finding previously unknown series periods and make forecasts on the basis of the detected periodic patterns. Indicator signals are identical to signals of the original i
FREE
TSO Stochastic RSI MT5
Dionisis Nikolopoulos
4.5 (2)
Stochastic RSI makes a stochastic calculation on the RSI indicator. The Relative Strength Index (RSI) is a well known momentum oscillator that measures the speed and change of price movements, developed by J. Welles Wilder. Features Find overbought and oversold situations. Sound alert when overbought/oversold level is reached. Get email and/or push notification alerts when a signal is detected. The indicator is non-repainting. Returns buffer values for %K and %D to be used as part of an EA. (s
FREE
RSI magic kjuta trial is the demo version of RSI magic kjuta. Custom Indicator (RSI magic kjuta) based on the standard   (Relative Strength Index, RSI) with additional settings and functions. The maximum and minimum RSI lines on the chart have been added to the standard RSI line. Now you can visually observe the past highs and lows of RSI, and not only the values of the closing bars, which avoids confusion in the analysis of trades. For example, the EA opened or closed an order, but the RSI l
FREE
IMA Finder MT5
Mubashir Mohamed Quraish Albarakat
1 (1)
This indicator is designed based on the Moving Origin indicator When the moving origin indicator breaks the price, this indicator gives a signal It is useful for better viewing of signals and analysis on them Attributes: Can be used in all symbols Can be used in all time frames Too many signals Simple and quick settings Easy way to work Settings: period: like moving average settings alarmShow: If you want to receive an alert in Metatrader after receiving the signal, enable this setting a
FREE
Bollinger Bands B
Flavio Javier Jarabeck
John Bollinger created this indicator in 2010 as a way to read the original indicator (Bollinger Bands) in a more "technical" way, shown as an oscillator. The typical range of the Bollinger Bands %B is 0 - 0.5 - 1.0, where "0" represents the lower band, the "0.5" the middle band, and "1" the upper band. The line on the indicator represents the Closing prices. As simple as that. SETTINGS Bollinger Bands period of analysis Standard Deviation multiplier Shift Price type to be analyzed If you
FREE
MP SMI for MT5
Pierre Ksachikian
The purpose of using Smart money index (SMI) or smart money flow index is to find out investors sentiment. The index was constructed by Don Hays and measures the market action. The indicator is based on intra-day price patterns. The beginning of the trading day is supposed to represent the trading by retail traders. The majority of retail traders overreact at the beginning of the trading day because of the overnight news and economic data. There is also a lot of buying on market orders and shor
FREE
Donchian Clouds
Samuel Manoel De Souza
The Indicator indicator draws 2 clouds based on Donchian Channels indicator values. The upper cloud is formed by the upper lines values and the lower cloud by the lowers lines values. The indicator allows to change the Channels parameters and the clouds colors the period of the base line and the multiplier of each Donchian Channels instance. The indicator holds 5 buffer index as follow: [0] - Outer values of the upper cloud [1]  - Inner values of the upper cloud [2]  - Base/Center line values [3
FREE
UpdatedRSI
ANO IDS
3.5 (2)
Modified and updated RSI indicator. Please use arrows on the chart to enter to deals and to exit from deals. The indicator is designed for all currency pairs and time-frames. Parameters: PeriodRSI - indicator period; OpenLevel - level for entering to deals (range diapason 0-100); CloseLevel - level for exiting from deals (range diapason 0-100); FlatMode - please enable this trigger in flat mode (i.e. if there are no determined trends).
FREE
ChannelRSI5
Iurii Tokman
5 (5)
ChannelRSI5   El indicador de índice de fuerza relativa (RSI) con niveles dinámicos de zonas de sobrecompra y sobreventa. Los niveles dinámicos cambian y se ajustan a los cambios actuales en el indicador y los precios, y representan una especie de canal. Configuración del indicador period_RSI: período promedio para calcular el índice RSI. apply_RSI: el precio aplicado. Puede ser cualquiera de las constantes de precio: PRICE_CLOSE: precio de cierre, PRICE_OPEN: precio de apertura, PRICE_HIGH: p
FREE
Multi-timeframe trend indicator based on the ADX / ADXWilder indicator with Fibonacci levels The indicator shows trend areas using ADX or ADXWilder indicator data from multiple timeframes. The impulse mode of the indicator allows you to catch the beginning of a trend, and several "Screens" with different timeframes allow you to filter out market noise. Fibonacci levels are added to the price chart, which have flexible settings. How the indicator works: if PDI is greater than NDI, then   it`
FREE
El indicador identifica cuando ocurre una divergencia entre el precio y un indicador u oscilador. Identifica divergencias tanto regulares como ocultas. Combinado con sus propias reglas y técnicas, este indicador le permitirá crear (o mejorar) su propio sistema poderoso. Características Puede detectar divergencias para los siguientes osciladores / indicadores:       MACD, OsMA, estocásticos, RSI, CCI, RVI, Awesome, ADX, ATR, OBV, índice compuesto, MFI y Momentum. Solo se puede seleccionar un os
FREE
FT ROC Histogram
FLEK TRADING s.r.o.
3 (1)
The indicator displays the value of ROC (Rate of change) from the selected price or moving average as a histogram. You can plot the moving average ROC values for smoothing indicator. Displayed Data ExtROC - rate of change ExtMAROC - smoothing line Parameters You can change the price, on which the indicator is calculated. Inputs InpMAPeriod - in case you want to calculate the moving average ROC, enter averaging period. Enter 1 for the calculation of the specified prices. InpMAMethod - smoot
FREE
Multi-timeframe trend indicator, based on the ADX / ADXWilder indicator The indicator shows trend areas using ADX or ADXWilder indicator data from multiple timeframes. The impulse mode of the indicator allows you to catch the beginning of a trend, and several "Screens" with different timeframes allow you to filter out market noise. How the indicator works: if PDI is greater than NDI, then it`s bullish movement; if PDI is less than NDI, then it`s bearish movement; to determine any trend, it
FREE
Are you tired of drawing trendlines every time you're analyzing charts? Or perhaps you would like more consistency in your technical analysis. Then this is for you. This indicator will draw trend lines automatically when dropped on a chart. How it works Works similar to standard deviation channel found on mt4 and mt5. It has 2 parameters: 1. Starting Bar 2. Number of bars for calculation The   starting bar   is the bar which drawing of the trend lines will begin, while the   number of bars for c
FREE
TrailingStop MA
Andrej Nikitin
3.5 (2)
El indicador dibuja dos media móviles simples usando los precios High y Low. La línea MA_High se muestra cuando la media móvil se dirige hacia abajo. Se puede utilizarla para colocar la orden Stop para la posición de venta. La línea MA_Low se muestra cuando la media móvil se dirige hacia arriba. Se puede utilizarla para colocar la orden Stop para la posición de compra. Este indicador se utiliza en el Asesor Experto  TrailingStop . Parámetros Period - período de cálculo de la media móvil. Deviati
FREE
This is a free version of the indicator, the period between the vertical lines is always 30 bars. In the paid version the period can be set by user, so a configuration with many ThreePointsChannel indicators with different periods is possible. The principle of construction - on top of any number of bars set by the user, a channel is constructed with maximum and minimum lines so that the bars touch the maximum and minimum of the channel at exactly three points. The name of the indicator follows
FREE
Forex Indicator Arrows
NGUYEN NGHIEM DUY
1 (1)
Forex Indicator Arrows is an arrow Indicator used as an assistant tool for your trading strategy. The indicator analyzes the standard deviation of bar close for a given period and generates a buy or sell signals if the deviation increases. It good to combo with Martingale EA to follow Trend and Sellect Buy Only/Sell Only for EA work Semi-Automatic. You can use this  Indicator with any EAs in my Products.
FREE
Tabajara V5
Flavio Javier Jarabeck
4.84 (32)
Metatrader 5 version of the famous Andre Machado's Tabajara indicator. If you don't know Andre Machado's Technical Analysis work you don't need this indicator... For those who need it and for those several friend traders who asked this porting from other platforms, here it is... FEATURES 8-period Moving Average 20-period Moving Average 50-period Moving Average 200-period Moving Average Colored candles according to the inflexion of the 20-period MA SETTINGS You can change the Period of all M
FREE
The Moving Averages On-Off  let you  control the indicator  using  the keyboard  or a  button . You can choose if you want the indicator always shown or always hided while switching among different time frames or financial instruments .    --->  This indicator is part of Combo Indicator OnOff It's possible to  setup three Moving Averages : Short ,  Medium ,  Long   Input You can customize the price type used for calculation : close, open, high, low, median price, typical price, weighted It
FREE
This is addition of  Effective SV squeeze momentum  that add bolliger band and Keltner channel to chart window.  Squeeze momentum introduced by “John Carter”, the squeeze indicator for MT5 represents a volatility-based tool. Regardless, we can also consider the squeeze indicator as a momentum indicator, as many traders use it to identify the direction and strength of price moves. In fact, the Tradingview  squeeze indicator shows when a financial instrument is willing to change from a trending ma
FREE
Los compradores de este producto también adquieren
TPSpro RFI Levels MT5
Roman Podpora
4.7 (10)
反转第一脉冲水平 (RFI)     指示     俄羅斯     -        ESP   Recomendamos utilizar con   el indicador -   TPSpro 趋势专业版 -   MT5版本 Un elemento clave importante en el comercio son las zonas o niveles a partir de los cuales se toman decisiones para comprar o vender un instrumento comercial. A pesar de los intentos de los grandes actores de ocultar su presencia en el mercado, inevitablemente dejan rastros. Nuestra tarea era aprender a encontrar estos rastros e interpretarlos correctamente. Funciones principales:
TPSproTREND PrO MT5
Roman Podpora
4.89 (9)
TPSpro TREND PRO  - is a trend indicator that automatically analyzes the market and provides information about the trend and each of its changes, as well as giving signals for entering trades without redrawing! The indicator uses each candle, analyzing them separately. referring to different impulses - up or down impulse. Exact entry points into transactions for currencies, crypto, metals, stocks, indices!  Version MT4               DETAILED DESCRIPTION               R ecommended to use with an
Atomic Analyst MT5
Issam Kassas
4.56 (18)
En primer lugar, vale la pena enfatizar que este Indicador de Trading no repinta, no redibuja y no se retrasa, lo que lo hace ideal tanto para el trading manual como para el automatizado. Manual del usuario: configuraciones, entradas y estrategia. El Analista Atómico es un Indicador de Acción del Precio PA que utiliza la fuerza y el impulso del precio para encontrar una mejor ventaja en el mercado. Equipado con filtros avanzados que ayudan a eliminar ruidos y señales falsas, y aumentan el poten
Atbot
Zaha Feiz
4.97 (31)
AtBot: Cómo funciona y cómo usarlo ### Cómo funciona El indicador "AtBot" para la plataforma MT5 genera señales de compra y venta utilizando una combinación de herramientas de análisis técnico. Integra la Media Móvil Simple (SMA), la Media Móvil Exponencial (EMA) y el índice de Rango Verdadero Promedio (ATR) para identificar oportunidades de trading. Además, puede utilizar velas Heikin Ashi para mejorar la precisión de las señales. Deja una reseña después de la compra y recibe un regalo especia
Primero que todo, vale la pena enfatizar que este Sistema de Trading es un Indicador No Repintado, No Redibujado y No Retrasado, lo que lo hace ideal tanto para el trading manual como para el automatizado. Curso en línea, manual y descarga de ajustes preestablecidos. El "Sistema de Trading Inteligente MT5" es una solución completa de trading diseñada para traders nuevos y experimentados. Combina más de 10 indicadores premium y presenta más de 7 estrategias de trading robustas, lo que lo convie
Gold Stuff mt5
Vasiliy Strukov
4.92 (161)
Gold Stuff mt5: un indicador de tendencia diseñado específicamente para el oro, también se puede usar en cualquier instrumento financiero. El indicador no se vuelve a dibujar ni se retrasa. El marco de tiempo recomendado es H1. IMPORTANTE! Póngase en contacto conmigo inmediatamente después de la compra para obtener instrucciones y bonificación!   Puede obtener una copia gratuita de nuestro indicador Strong Support y Trend Scanner, por favor envíe un mensaje privado. ¡a mí! PARÁMETROS Draw
Este es un genial indicador para MT5 que ofrece señales precisas para entrar en una transacción sin redibujar. Se puede aplicar a cualquier activo financiero: fórex, criptomonedas, metales, acciones, índices. Nos dará valoraciones bastante precisas y nos dirá cuándo es mejor abrir y cerra una transacción. Eche un vistazo  al vídeo  (6:22), ¡contiene un ejemplo de procesamiento de una sola señal que ha amortizado el indicador! La mayoría de los tráders mejoran sus resultados comerciales durante l
Trend Screener Pro MT5
STE S.S.COMPANY
4.87 (61)
Desbloquee el poder del comercio de tendencias con el indicador Trend Screener: ¡su solución definitiva para el comercio de tendencias impulsada por lógica difusa y un sistema multidivisa!Mejore su comercio de tendencias con Trend Screener, el revolucionario indicador de tendencias impulsado por lógica difusa. Es un poderoso indicador de seguimiento de tendencias que combina más de 13 herramientas y funciones premium y 3 estrategias comerciales, lo que lo convierte en una opción versátil para co
FX Power MT5 NG
Daniel Stein
5 (5)
Obtenga su actualización diaria del mercado con detalles y capturas de pantalla a través de nuestro Morning Briefing aquí en mql5 y en Telegram ! FX Power MT5 NG es la nueva generación de nuestro popular medidor de fuerza de divisas, FX Power. ¿Y qué ofrece este medidor de fuerza de nueva generación? Todo lo que le encantaba del FX Power original PLUS Análisis de fuerza de ORO/XAU Resultados de cálculo aún más precisos Períodos de análisis configurables individualmente Límite de cálculo persona
IX Power MT5
Daniel Stein
4.17 (6)
IX Power   lleva por fin la insuperable precisión de FX Power a los símbolos que no son de Forex. Determina con exactitud la intensidad de las tendencias a corto, medio y largo plazo de tus índices, acciones, materias primas, ETF e incluso criptodivisas favoritas. Puede   analizar todo lo   que su terminal le ofrece. Pruébalo y experimenta cómo   tu timing mejora significativamente   a la hora de operar. Características principales de IX Power Resultados de cálculo 100% precisos y sin rep
Advanced Supply Demand MT5
Bernhard Schweigert
4.5 (14)
¡Actualmente con 33% de descuento! ¡La mejor solución para cualquier tráder principiante o experto! Este indicador es una herramienta comercial única, de alta calidad y asequible, porque incorpora una serie de características patentadas y una nueva fórmula. Con esta actualización, podrá mostrar zonas de doble marco temporal. No solo podrá mostrar un marco temporal más alto, sino también mostrar ambos, el marco temporal del gráfico MÁS el marco temporal más alto: MOSTRANDO ZONAS ANIDADAS. A todos
MetaForecast M5
Vahidreza Heidar Gholami
5 (2)
MetaForecast predice y visualiza el futuro de cualquier mercado basándose en las armonías de los datos de precios. Aunque el mercado no siempre es predecible, si existe un patrón en el precio, MetaForecast puede predecir el futuro con la mayor precisión posible. En comparación con otros productos similares, MetaForecast puede generar resultados más precisos al analizar las tendencias del mercado. Parámetros de entrada Past size (Tamaño del pasado) Especifica el número de barras que MetaForecas
FX Volume MT5
Daniel Stein
4.93 (14)
Obtenga su actualización diaria del mercado con detalles y capturas de pantalla a través de nuestro Morning Briefing aquí en mql5 y en Telegram ! FX Volume es el PRIMER y ÚNICO indicador de volumen que proporciona una visión REAL del sentimiento del mercado desde el punto de vista de un bróker. Proporciona una visión impresionante de cómo los participantes institucionales del mercado, como los brokers, están posicionados en el mercado Forex, mucho más rápido que los informes COT. Ver esta info
Ante todo, vale la pena enfatizar que esta Herramienta de Trading es un Indicador No Repintado, No Redibujado y No Retrasado, lo que la hace ideal para el trading profesional. Curso en línea, manual del usuario y demostración. El Indicador de Conceptos de Acción del Precio Inteligente es una herramienta muy potente tanto para traders nuevos como experimentados. Combina más de 20 indicadores útiles en uno solo, combinando ideas avanzadas de trading como el Análisis del Trader del Círculo Inte
Quantum Trend Sniper
Bogdan Ion Puscasu
4.79 (48)
Introduciendo       Indicador Quantum Trend Sniper   , el innovador indicador MQL5 que está transformando la forma en que identificas y negocias los cambios de tendencia. Desarrollado por un equipo de comerciantes experimentados con experiencia comercial de más de 13 años,       Indicador de francotirador de tendencia cuántica       está diseñado para impulsar su viaje comercial a nuevas alturas con su forma innovadora de identificar cambios de tendencia con una precisión extremadamente alta.
Difícil de encontrar y escasa en frecuencia, las divergencias son uno de los escenarios comerciales más confiables. Este indicador busca y escanea las divergencias regulares y ocultas automáticamente usando su oscilador favorito. [ Guía de instalación | Guía de actualización | Solución de problemas | FAQ | Todos los productos ] Fácil de comerciar Encuentra divergencias regulares y ocultas Admite muchos osciladores bien conocidos Implementa señales comerciales basadas en rupturas Muestra n
Auto Order Block with break of structure based on ICT and Smart Money Concepts (SMC) Futures Break of Structure ( BoS )             Order block ( OB )            Higher time frame Order block / Point of Interest ( POI )    shown on current chart           Fair value Gap ( FVG ) / Imbalance   -  MTF      ( Multi Time Frame )    HH/LL/HL/LH  -  MTF      ( Multi Time Frame )  Choch  MTF      ( Multi Time Frame )  Volume Imbalance     ,  MTF          vIMB Gap’s Power of 3 Equal High
** All Symbols x All Timeframes scan just by pressing scanner button ** *** Contact me  to send you instruction and add you in "123 scanner group" for sharing or seeing experiences with other users. After 17 years of experience in the markets and programming, Winner indicator is ready. I would like to share with you! Introduction The 123 Pattern Scanner indicator with a special enhanced algorithm is a very repetitive common pattern finder with a high success rate . Interestingly, this Winner in
Black Dragon indicator mt5
Ramil Minniakhmetov
4.81 (53)
El indicador de detección de tendencias complementará cualquier estrategia y también se puede utilizar como una herramienta independiente. Ventajas Fácil de usar, no sobrecarga el gráfico con información innecesaria; Puede usarse como filtro para cualquier estrategia; Tiene niveles integrados de soporte y resistencia dinámicos, que se pueden usar tanto para obtener ganancias como para establecer límites de pérdidas; El indicador no cambia de color después de que se cierra la vela;  Funciona
Ahora $ 147 (aumentando a $ 499 después de algunas actualizaciones) - Cuentas ilimitadas (PC o Mac) Manual de usuario de RelicusRoad + Videos de capacitación + Acceso al grupo privado de Discord + Estado VIP UNA NUEVA MANERA DE VER EL MERCADO RelicusRoad es el indicador comercial más poderoso del mundo para divisas, futuros, criptomonedas, acciones e índices, y brinda a los comerciantes toda la información y las herramientas que necesitan para mantenerse rentables. Brindamos análisis téc
AW Trend Predictor MT5
AW Trading Software Limited
4.75 (51)
La combinación de niveles de tendencia y ruptura en un sistema. Un algoritmo de indicador avanzado filtra el ruido del mercado, determina la tendencia, los puntos de entrada y los posibles niveles de salida. Las señales indicadoras se registran en un módulo estadístico, que le permite seleccionar las herramientas más adecuadas, mostrando la efectividad del historial de señales. El indicador calcula las marcas Take Profit y Stop Loss. Manual e instrucciones ->   AQUÍ   / Versión MT4 ->   AQUÍ Có
ATrend
Zaha Feiz
4.67 (3)
ATREND: Cómo Funciona y Cómo Usarlo #### Cómo Funciona El indicador "ATREND" para la plataforma MT5 está diseñado para proporcionar a los traders señales de compra y venta robustas mediante una combinación de metodologías de análisis técnico. Este indicador utiliza principalmente el Rango Verdadero Promedio (ATR) para medir la volatilidad, junto con algoritmos de detección de tendencias para identificar posibles movimientos del mercado. Deja un mensaje después de la compra y recibe un regalo es
Easy By Sell is a market indicator for opening and closing positions. It becomes easy to track market entries with alerts. It indicates trend reversal points when a price reaches extreme values ​​and the most favorable time to enter the market. it is as effective as a Fibonacci to find a level but it uses different tools such as an algorithm based on ATR indicators and Stochastic Oscillator. You can modify these two parameters as you wish to adapt the settings to the desired period. My othe
Este tablero muestra los últimos   patrones armónicos   disponibles para los símbolos seleccionados, por lo que ahorrará tiempo y será más eficiente /   versión MT4 . Indicador gratuito:   Basic Harmonic Pattern Columnas del indicador Symbol:   aparecerán los símbolos seleccionados Trend :   alcista o bajista Pattern :   tipo de patrón (gartley, mariposa, murciélago, cangrejo, tiburón, cifrado o ABCD) Entry :   precio de entrada SL:   precio de stop loss TP1:   1er precio de toma de benefici
TPA True Price Action indicator reveals the true price action of the market makers through 100% non-repainting signals strictly at the close of a candle! TPA shows entries and re-entries, every time the bulls are definitely stronger than the bears and vice versa. Not to confuse with red/green candles. The shift of power gets confirmed at the earliest stage and is ONE exit strategy of several. There are available now two free parts of the TPA User Guide for our customers. The first "The Basics"
Was: $249  Now: $99   Market Profile defines a number of day types that can help the trader to determine market behaviour. A key feature is the Value Area, representing the range of price action where 70% of trading took place. Understanding the Value Area can give traders valuable insight into market direction and establish the higher odds trade. It is an excellent addition to any system you may be using. Inspired by Jim Dalton’s book “Mind Over Markets”, this indicator is designed to suit the
ICT, SMC, SMART MONEY CONCEPTS, SMART MONEY, Smart Money Concept, Support and Resistance, Trend Analysis, Price Action, Market Structure, Order Blocks, BOS/CHoCH,   Breaker Blocks ,  Momentum Shift,   Supply&Demand Zone/Order Blocks , Strong Imbalance,   HH/LL/HL/LH,    Fair Value Gap, FVG,  Premium  &   Discount   Zones, Fibonacci Retracement, OTE, Buy Side Liquidity, Sell Side Liquidity, BSL/SSL Taken, Equal Highs & Lows, MTF Dashboard, Multiple Time Frame, BigBar, HTF OB, HTF Market Structure
Matrix Arrow Indicator MT5
Juvenille Emperor Limited
5 (12)
Matrix Arrow Indicator MT5   es una tendencia única 10 en 1 que sigue un indicador   100% sin repintado   de marcos temporales múltiples que se puede usar en todos los símbolos/instrumentos:   divisas ,   materias primas ,   criptomonedas ,   índices ,   acciones .  Matrix Arrow Indicator MT5  determinará la tendencia actual en sus primeras etapas, recopilando información y datos de hasta 10 indicadores estándar, que son: Índice de movimiento direccional promedio (ADX) Índice de canales de prod
Gold TMAF MTF - es el mejor indicador técnico bursátil. El algoritmo del indicador analiza el movimiento del precio de un activo y refleja la volatilidad y las posibles zonas de entrada. Las mejores señales del indicador: - Para VENTA = límite superior rojo de TMA2 por encima del límite superior rojo de TMA1 + indicador fractal rojo por encima + flecha amarilla de señal SR en la misma dirección. - Para COMPRA = límite inferior azul de TMA2 por debajo del límite inferior azul de TMA1 + i
Golden Spikes Premium
Kwaku Bondzie Ghartey
Golden Spikes Detector Acknowledgement and Dedications:  The name of this indicator was Inspired by an Original; Mr Grant Koopman; a Knowledgeable and experienced Synthetics trader. I dedicate this indicator to Mr Grant.  Overview: The Golden Spikes Premium is a groundbreaking trading indicator meticulously crafted for the Boom and Crash indices on the Deriv market. Tailored to meet the needs of discerning traders, this powerful tool operates exclusively on the one-minute timeframe, providin
Otros productos de este autor
Indicador CustomRSI50 Alert and Mail at Cross Indicador CustomRSI50 Alert and Mail at Cross Descripción El indicador CustomRSI50 Alert and Mail at Cross es un indicador técnico avanzado basado en el popular Índice de Fuerza Relativa (RSI), diseñado para simplificar el trading automatizado con notificaciones inmediatas a través de alertas y correos electrónicos cuando el nivel de RSI cruza el umbral de 50. El indicador proporciona una visualización clara y personalizable del RSI, con un énfasis p
Filtro:
No hay comentarios
Respuesta al comentario
Versión 1.4 2024.09.06
Please refer to the English description for details on the latest updates