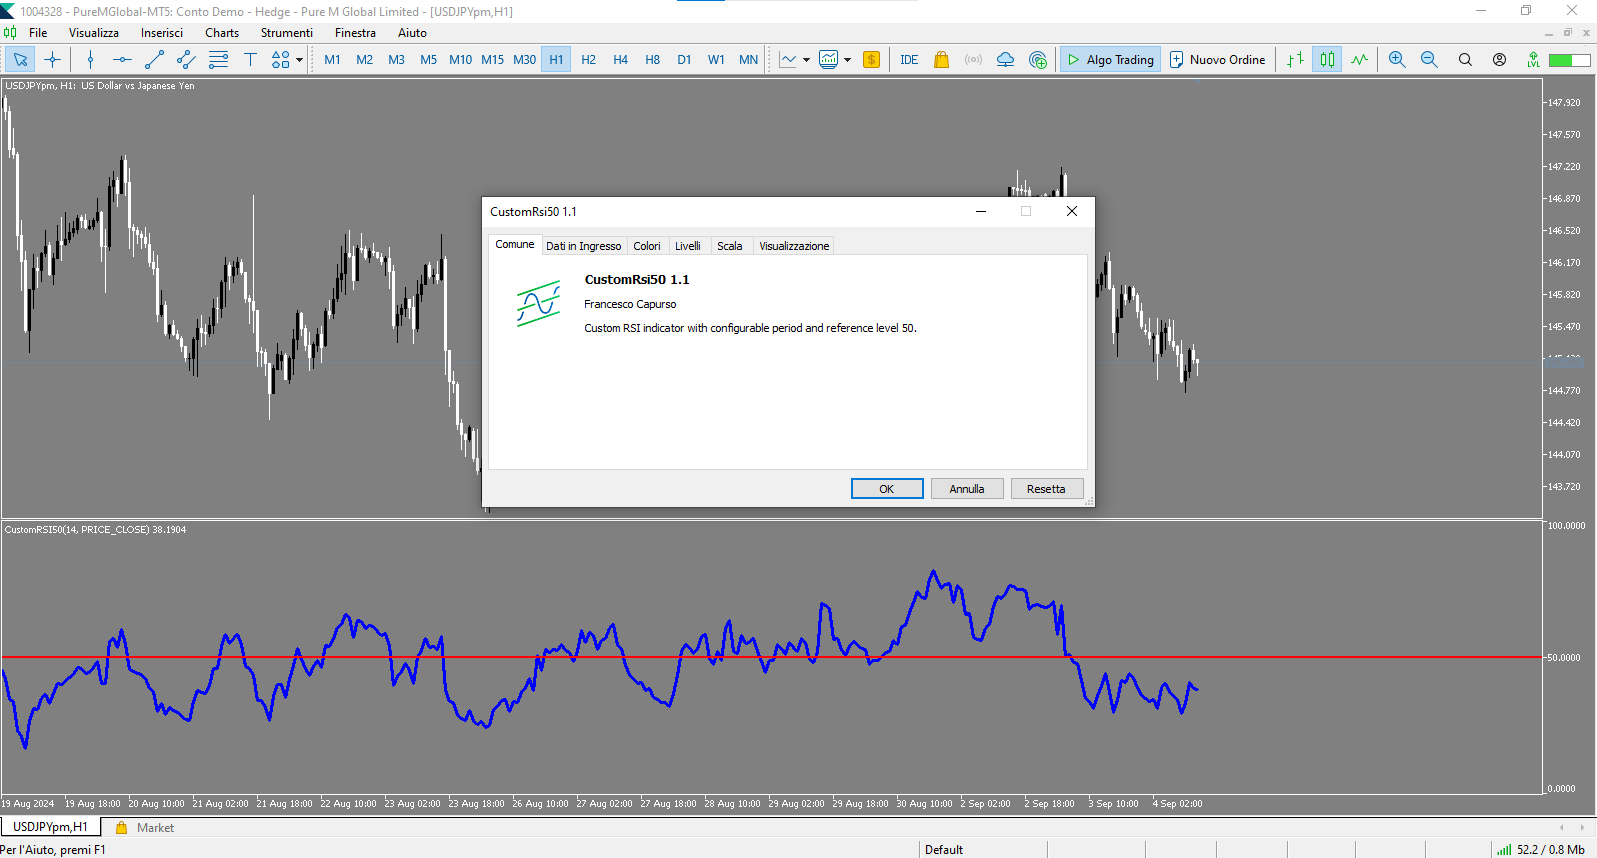
CustomRsi50
- インディケータ
- Francesco Capurso
- バージョン: 1.4
- アップデート済み: 6 9月 2024
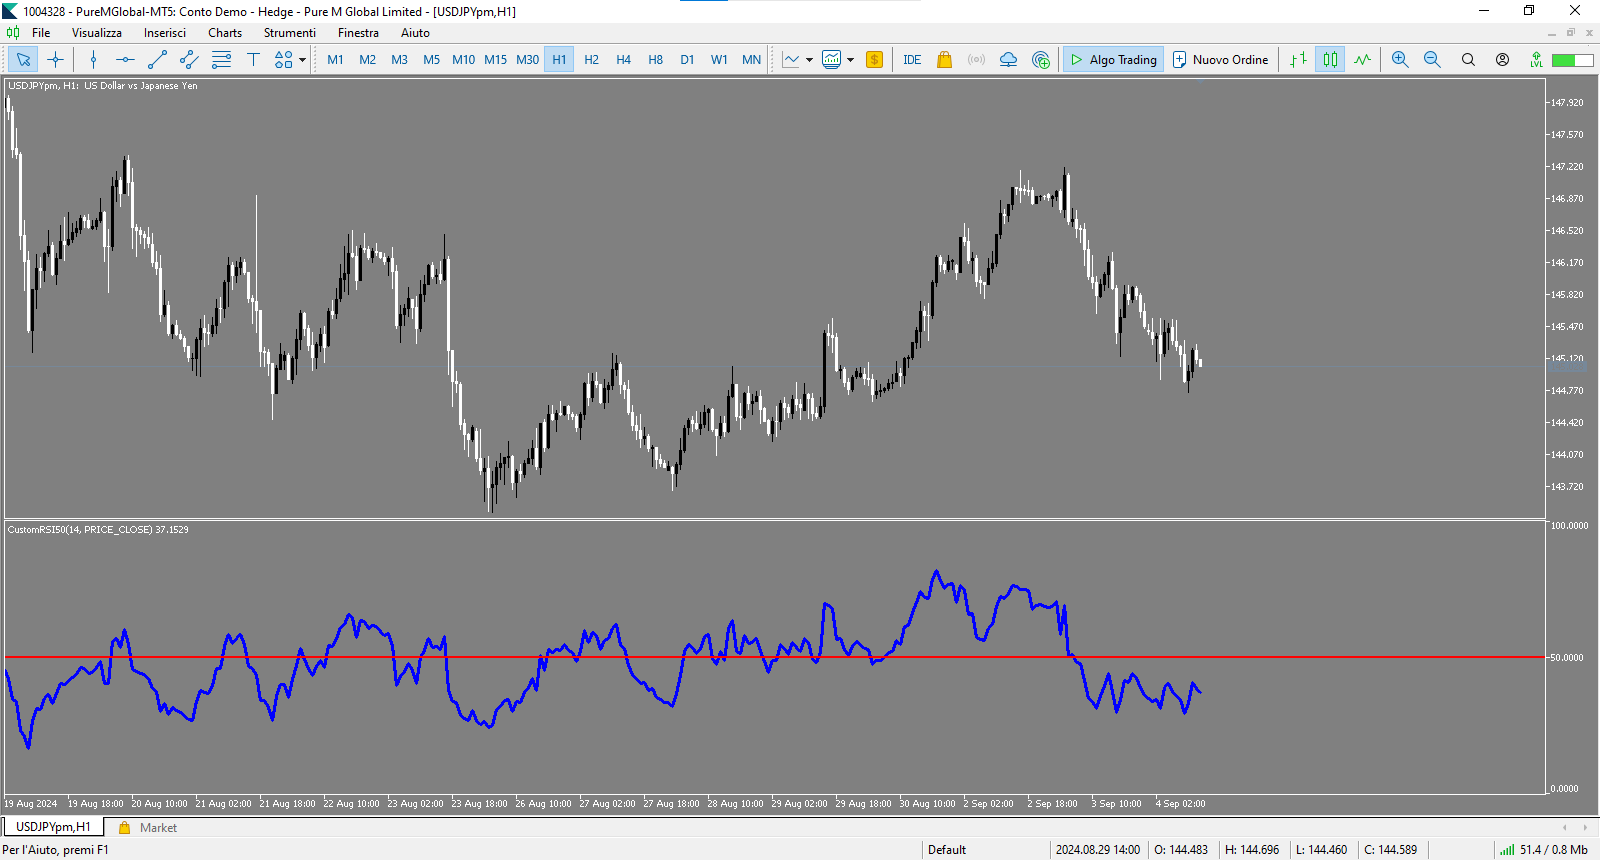
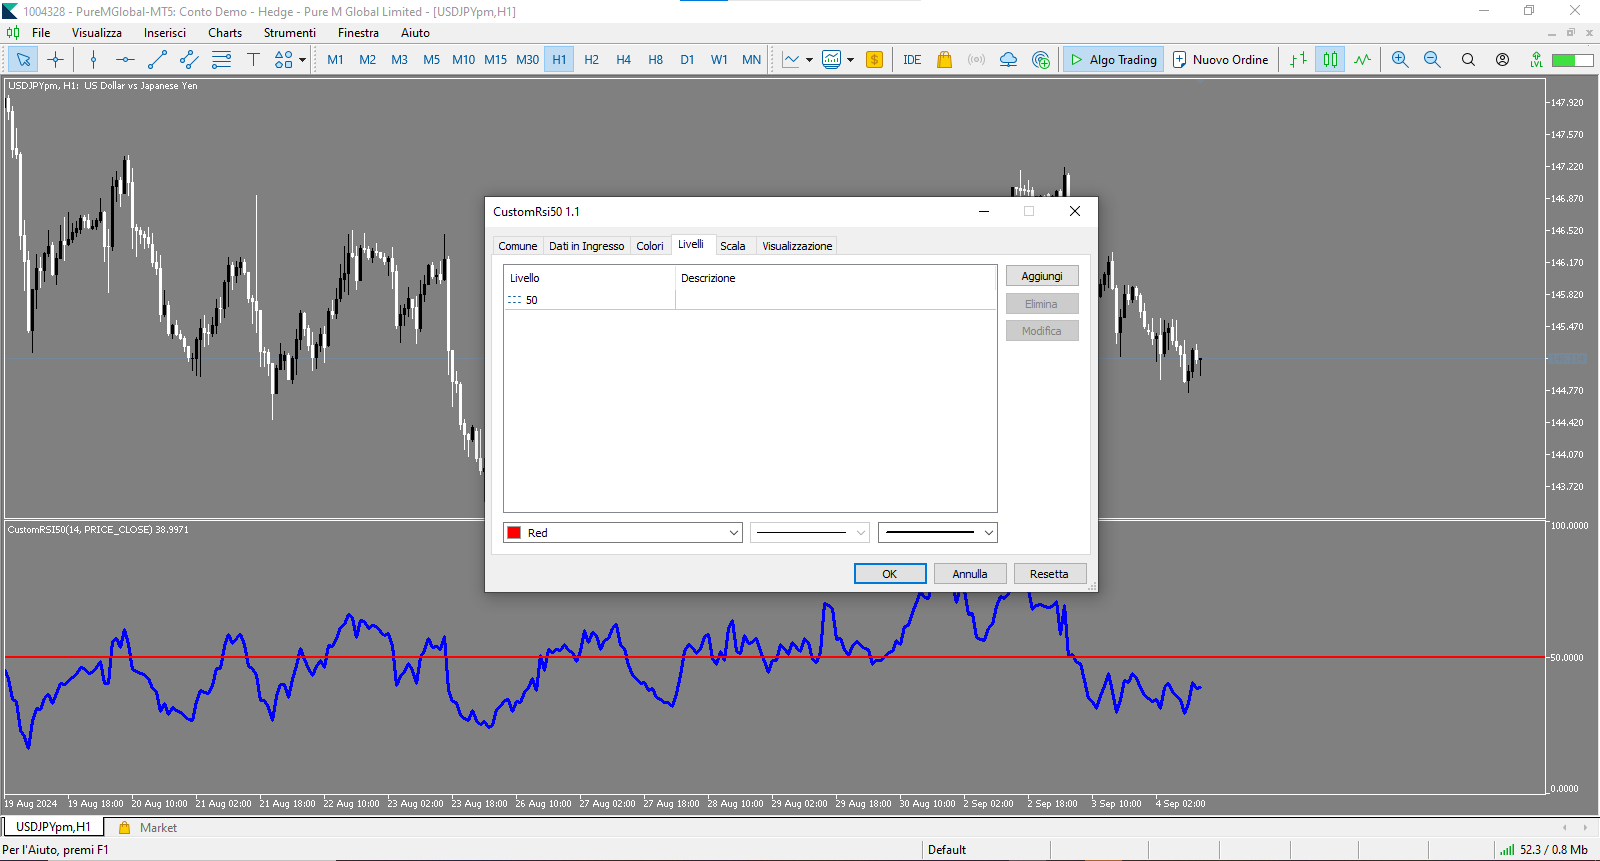
CustomRSI50 - レベル50を備えたカスタムRSIインジケーター
説明
CustomRSI50は、人気のある相対力指数(RSI)に基づいたカスタム技術指標です。このインジケーターは、特にレベル50に重点を置いたRSIの明確でカスタマイズ可能な視覚化を提供し、多くのトレーダーにとってモメンタム分析に不可欠です。
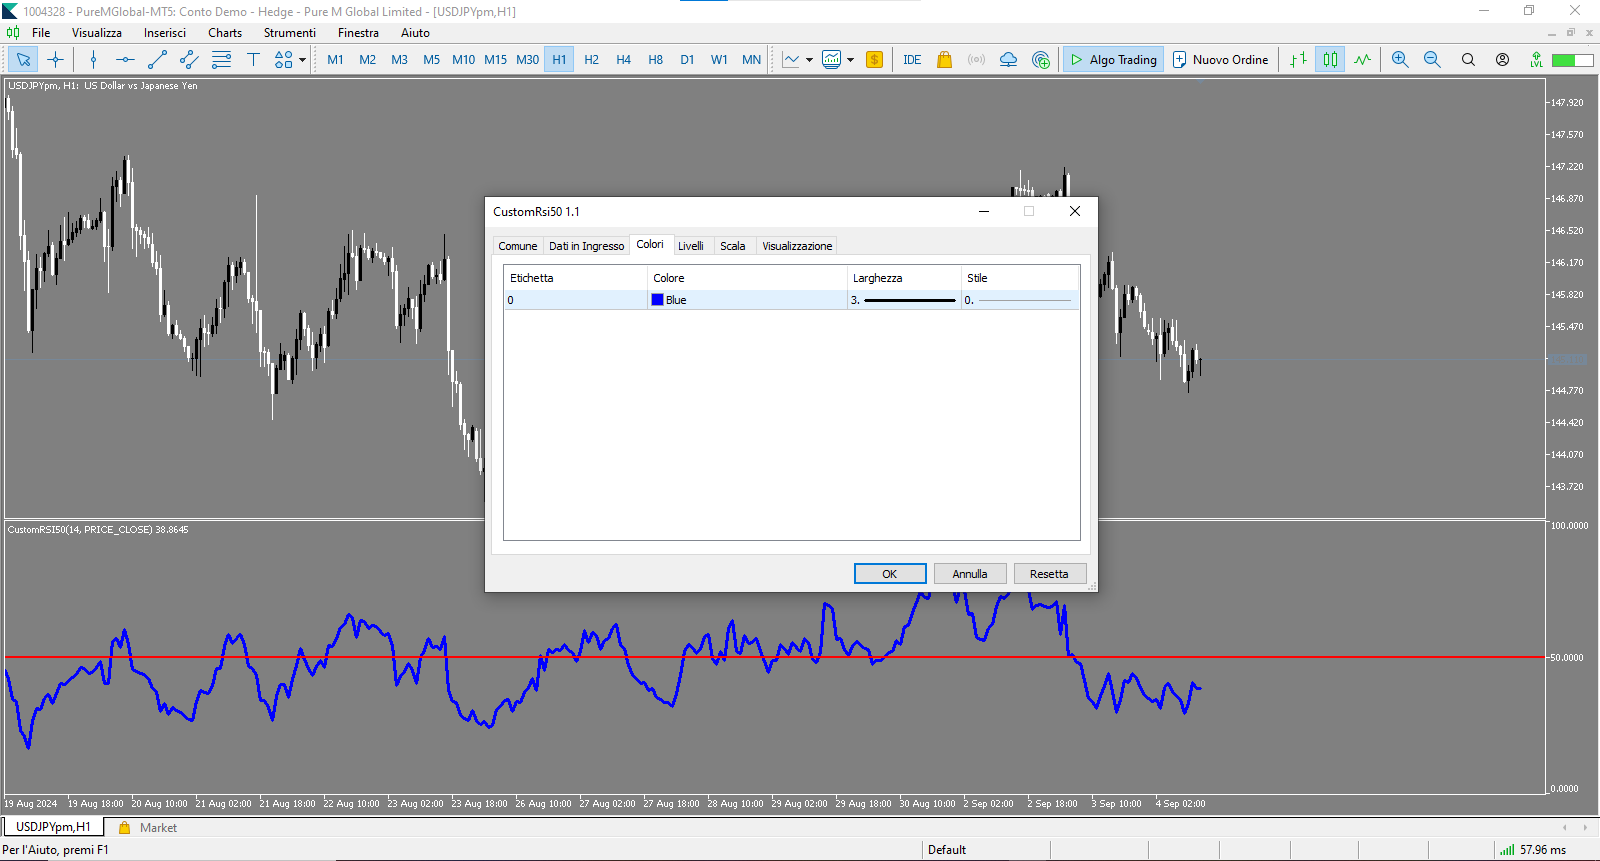
主な特徴
- 設定可能なRSI期間
- 強調表示された50レベルの参照
- カスタマイズ可能な適用価格タイプ
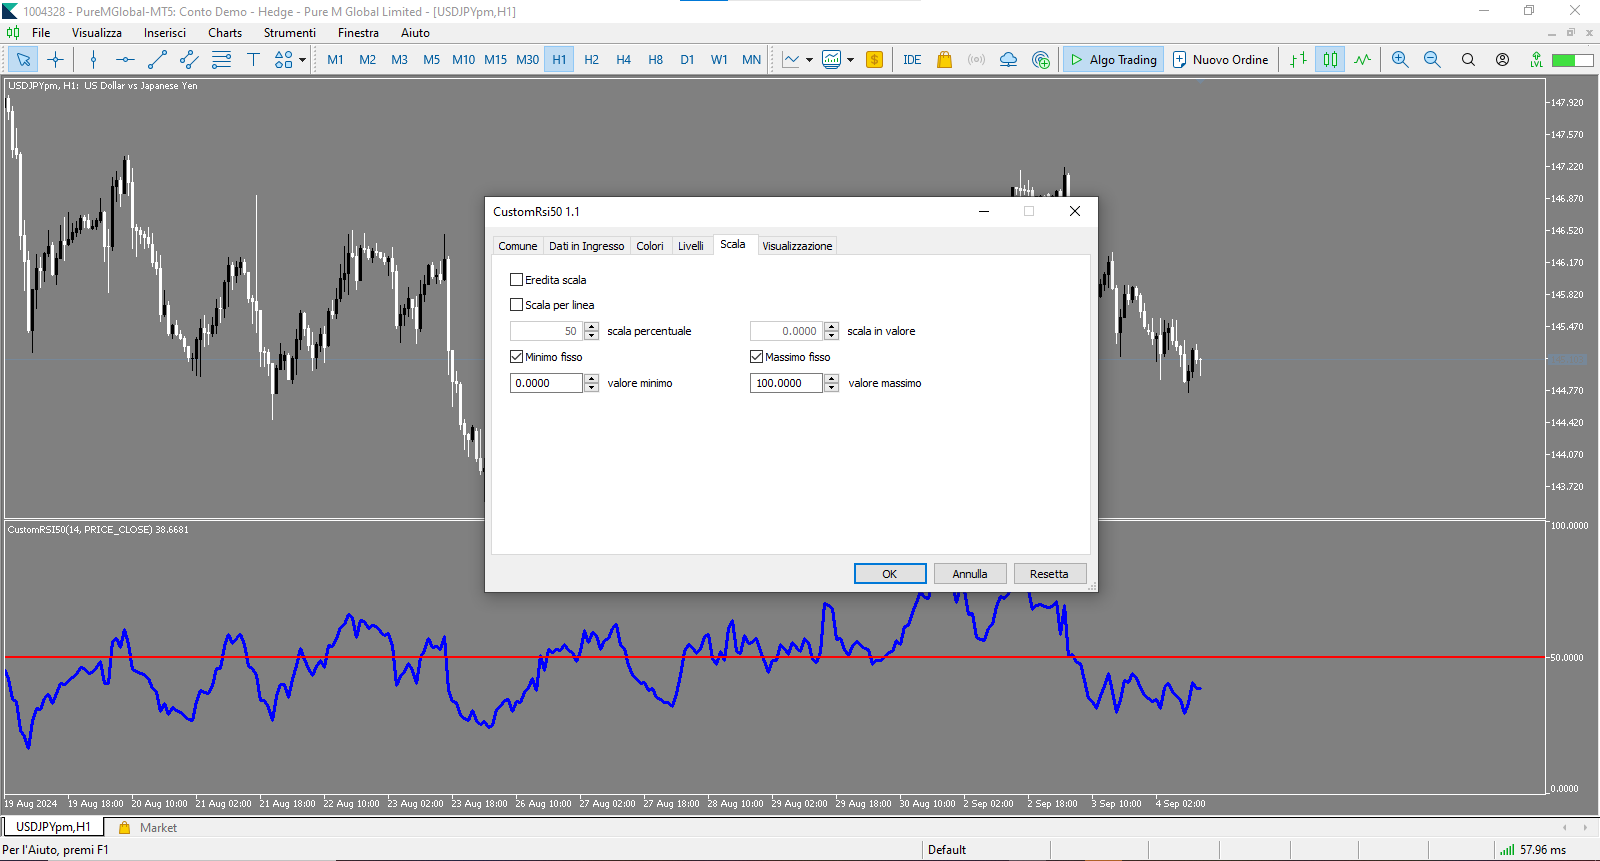
- 別ウィンドウでの表示
- 解釈しやすい0から100までの固定スケール
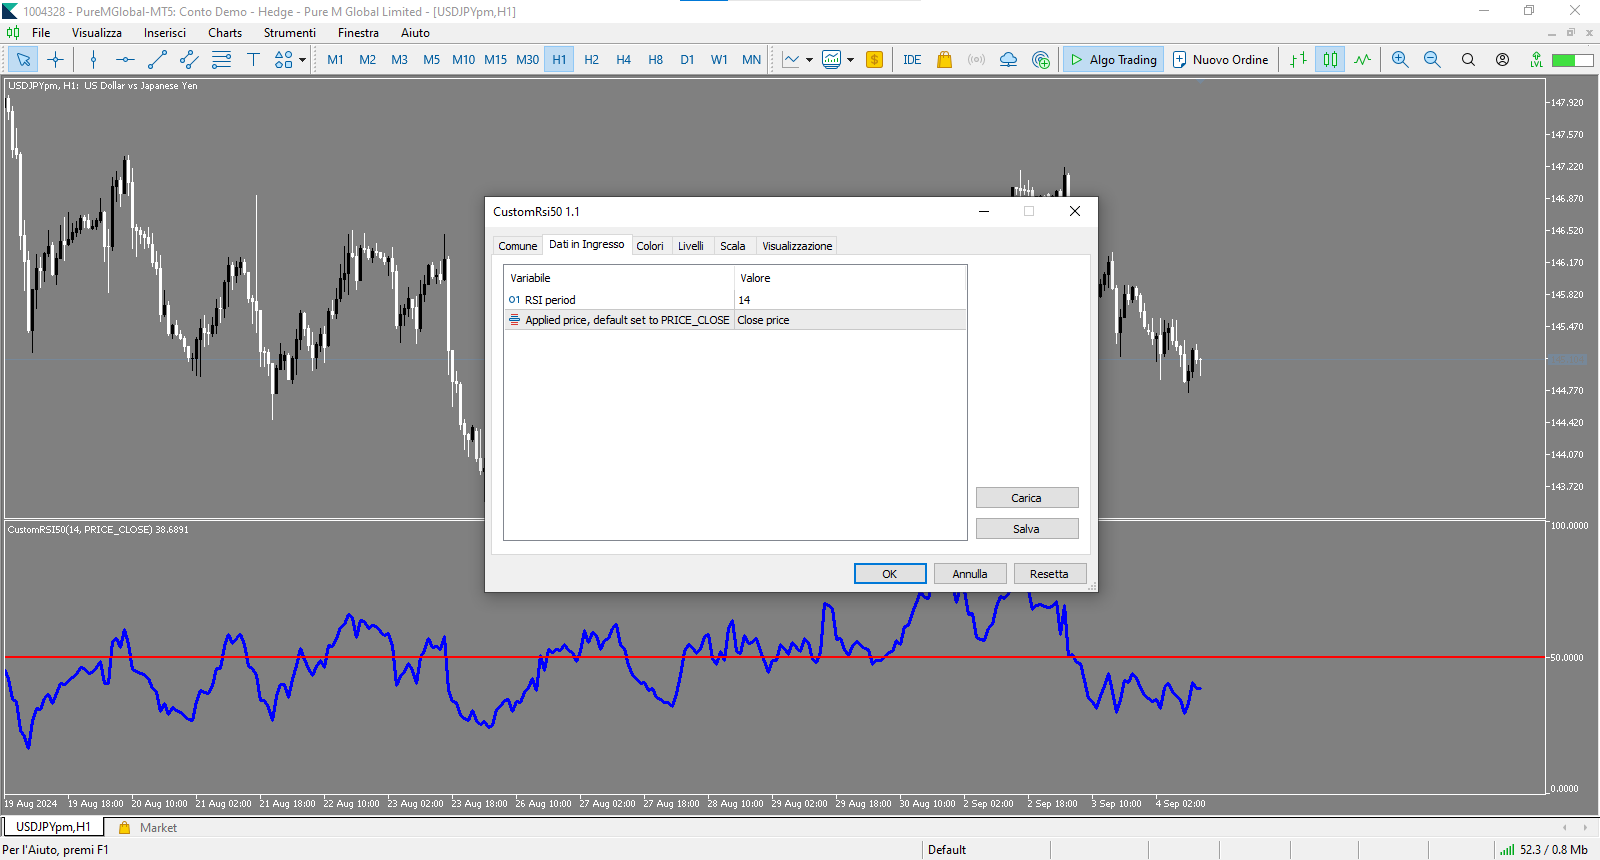
カスタマイズ可能なパラメーター
- RSI_Period: RSI計算の期間を設定可能(デフォルト:14)
- applied_price: 計算に使用する価格タイプを選択可能(デフォルト:終値)
CustomRSI50の使用方法
- MetaTrader 5の任意のチャートにインジケーターを適用
- 好みに応じてRSI期間と価格タイプをカスタマイズ
- 50レベルに関連するRSIの動きを観察:
- 50を上回る値は強気のモメンタムを示す
- 50を下回る値は弱気のモメンタムを示す
利点
- 市場のモメンタムの明確な視覚化
- レベル50周辺のトレンド変化の容易な識別
- 様々な取引戦略に適応するためのカスタマイズ
CustomRSI50は、重要な50レベルに特に焦点を当てた、明確でカスタマイズ可能なRSI分析を望むトレーダーにとって理想的なツールです。
注意
このインジケーターは、トレーディングコミュニティに無料で提供されています。取引に役立つと感じた場合は、フィードバックや評価をお願いします。
Changelog
- バージョン 1.4 - [2024/09/06]
- RSIラインの表示が中断される問題を修正しました。
- グラフ全体でRSI値のより正確な表示を保証するためにバッファ初期化を改善しました。
- RSIの計算を最適化して精度を向上させました。
- 将来の問題解決を容易にするためにデバッグ出力を追加しました。
- インジケーターのよりスムーズな表示のためにデータ管理を改善しました。
これらのアップデートにより、CustomRSI50インジケーターの安定性と精度が大幅に向上し、市場のモメンタムのより信頼性の高い表示が可能になりました。