• Aperçu
  • Avis
  • Commentaires

FVG for MT5

Indicateur "Fair Value Gap" (FVG) - Dévoilez le Pouvoir des Déséquilibres du Marché

Le monde du trading regorge d'opportunités cachées, mais seuls ceux qui possèdent les bons outils peuvent les identifier et les exploiter efficacement. Notre Indicateur FVG est conçu pour vous aider à faire exactement cela. Si vous êtes un trader cherchant à améliorer sa capacité à lire le marché et à identifier les meilleurs points d'entrée et de sortie, l'Indicateur FVG est votre allié idéal.

Qu'est-ce qu'un Fair Value Gap (FVG)?

Le concept de Fair Value Gap fait référence à une différence entre l'offre et la demande qui crée un "écart" dans le graphique des prix. Cet écart représente une zone où le prix pourrait revenir pour combler ce déséquilibre, rendant ces zones potentiellement précieuses pour les opportunités de trading. Ces écarts se créent lors de mouvements de prix rapides et peuvent être une clé pour comprendre le comportement futur du marché.

Pourquoi l'Indicateur FVG est-il Essentiel?

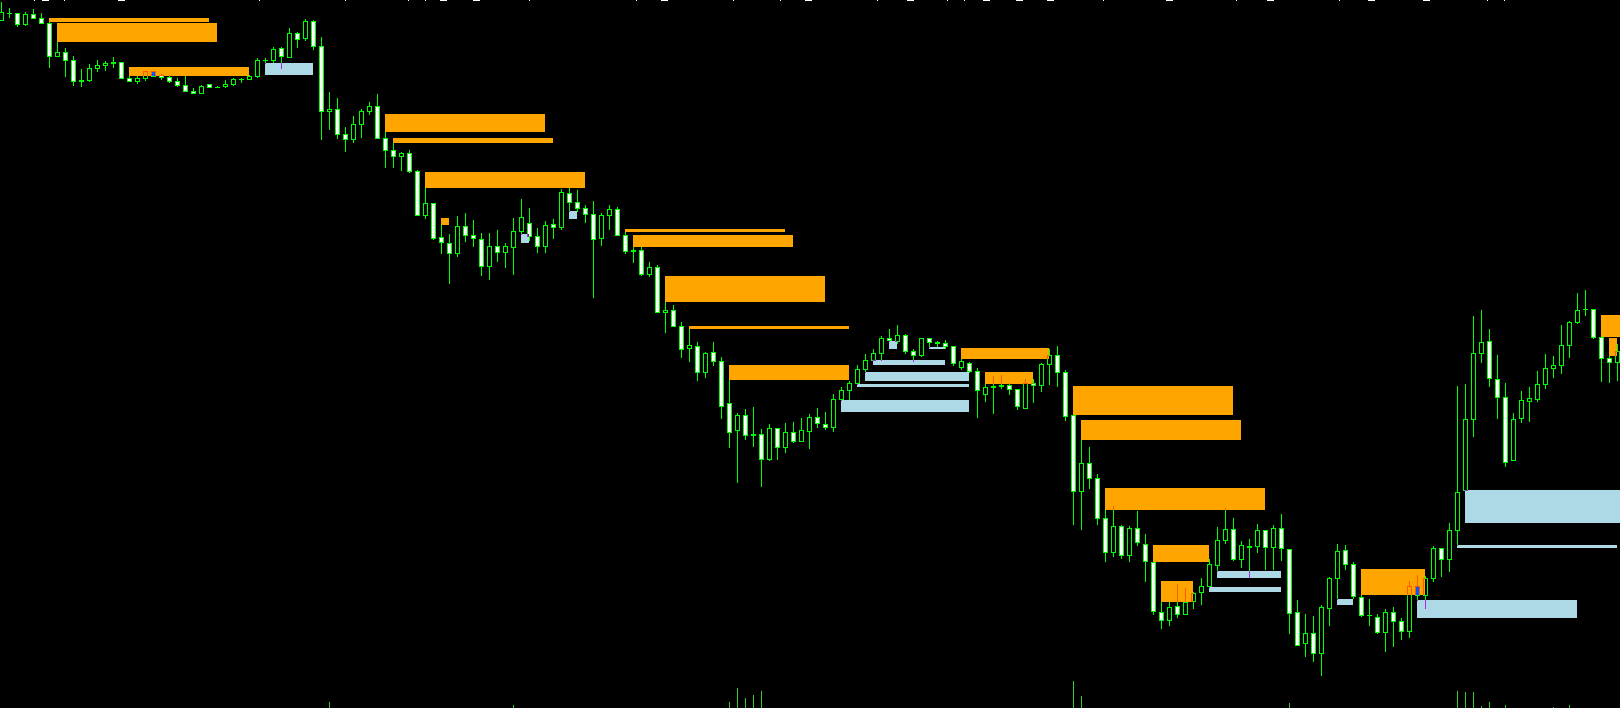
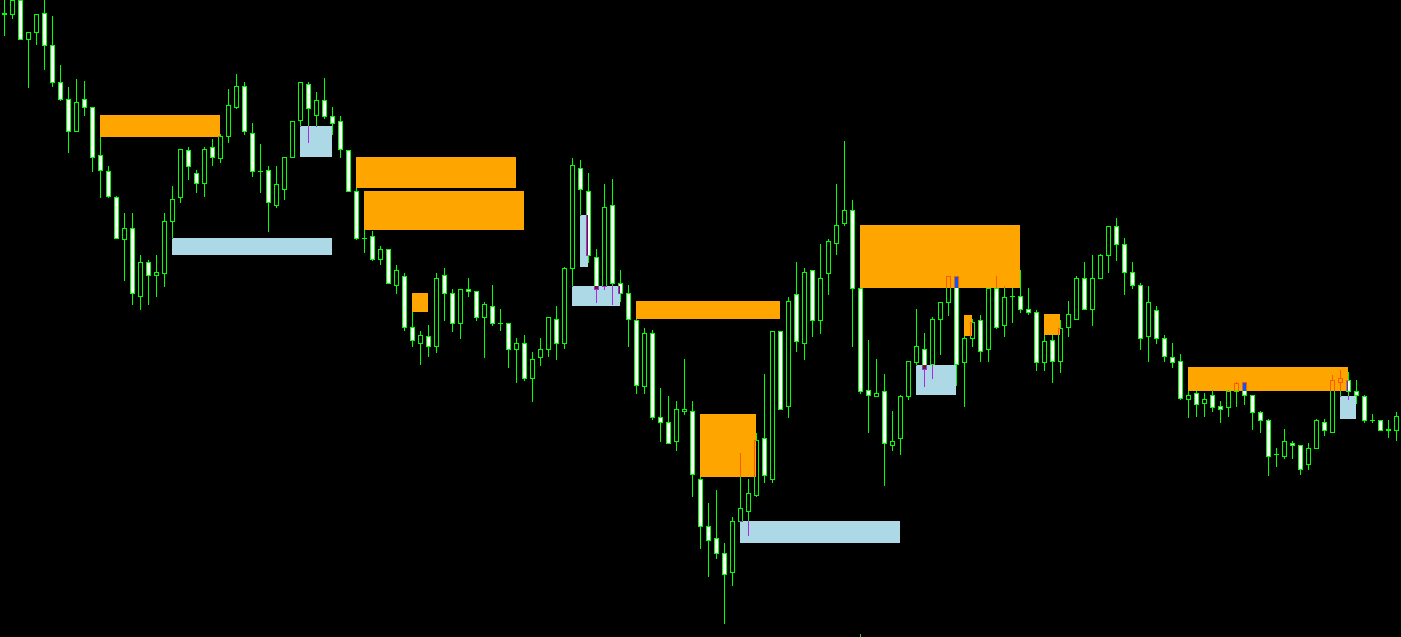
L'Indicateur FVG vous permet de repérer facilement ces zones de déséquilibre sur le graphique, en mettant en évidence les points où le prix pourrait revenir pour combler l'écart. Cette information est cruciale pour toute stratégie de trading, car elle permet aux traders d'identifier des niveaux de prix significatifs où des retracements ou des accélérations peuvent se produire.

Caractéristiques Principales de l'Indicateur FVG

  • Identification Automatique des Gaps: L'Indicateur FVG analyse automatiquement le graphique pour identifier les zones de Fair Value Gap, vous faisant gagner du temps et réduisant les risques d'erreurs humaines.
  • Signaux Visuels Clairs: Les zones de gaps sont clairement marquées sur le graphique avec des indicateurs distincts, vous permettant de voir instantanément où se trouvent les opportunités de trading potentielles.
  • Personnalisation Complète: Vous pouvez configurer l'indicateur en fonction de vos besoins spécifiques, en ajustant les paramètres pour s'adapter à votre stratégie de trading. Que vous préfériez trader sur des périodes courtes ou longues, l'Indicateur FVG s'adapte à vos exigences.
  • Convient à Tous les Traders: Que vous soyez débutant ou professionnel, l'Indicateur FVG est facile à utiliser et peut être intégré dans n'importe quel style de trading.
  • Compatibilité Multi-Plateforme: L'Indicateur FVG est compatible avec diverses plateformes de trading, vous permettant de l'utiliser sur plusieurs instruments et marchés.

Comment Utiliser l'Indicateur FVG dans Votre Stratégie de Trading?

  1. Installation: Ajoutez l'Indicateur FVG au graphique de l'instrument financier de votre choix.
  2. Configuration: Réglez les paramètres de l'indicateur selon vos préférences. Vous pouvez ajuster la sensibilité des gaps et d'autres critères pour affiner les signaux.
  3. Analyse: Observez le graphique et notez où l'Indicateur FVG a identifié des zones de gaps. Ce sont les points clés où vous pourriez vouloir concentrer votre attention.
  4. Décision: Utilisez les informations fournies par l'indicateur pour décider quand entrer ou sortir du marché. L'Indicateur FVG vous aide non seulement à trouver les meilleures opportunités, mais il peut également être utilisé pour la gestion des risques en identifiant des zones de retracement potentielles.

Avantages de l'Indicateur FVG

  • Précision Améliorée: Avec l'Indicateur FVG, vous aurez une vision plus claire de l'orientation probable du marché, améliorant ainsi votre capacité à anticiper les mouvements futurs.
  • Réduction des Risques: En identifiant les zones de déséquilibre, vous pouvez éviter d'entrer dans des trades au mauvais moment et améliorer votre gestion des risques.
  • Opportunités Accrues: En détectant les gaps, vous aurez accès à plus d'opportunités de trading, ce qui vous permettra de choisir les meilleurs points d'entrée et de sortie avec plus de confiance.


Produits recommandés
This indicator is a perfect wave automatic analysis indicator for practical trading! 黄金实战 案例... The standardized definition of the band is no longer a wave of different people, and the art of man-made interference is eliminated, which plays a key role in strict analysis of the approach.=》Increase the choice of international style mode, (red fall green rise style) The  purchase discount is currently in progress! Index content: 1.Basic wave: First, we found the inflection point of the ba
1. Why did I develop this series of indicators I found that most traders need to use multiple time frame indicators. They usually switch time frame to see indicators. However, once the timeframe is switched, you cannot see the  corresponding relationship  between  the price in the smaller timeframe  and  the indicator in the larger timeframe . For example: if your price chart is in H1 timeframe, you can see H4, D1 and W1 indicators in H1 timeframe Chart. This is more helpful for you to find t
The Beta index, also known as the Beta indicator, is one of the key reference indicators for hedging institutions. It allows you to measure the relative risk of individual assets, such as currencies and commodities, in comparison to market portfolios, cross-currency pairs, the U.S. dollar index, and stock indices. By understanding how your assets perform in relation to market benchmarks, you will have a clearer understanding of your investment risk. Key Features: Accurate Risk Assessment: The Be
Plucking Machine I   Plucking Machine I is a trend indicator designed specifically for gold and can also be used on any financial instrument. The indicator does not redraw and does not lag. Recommended time frame H1. The current setting is applicable for all time periods. It shows the current direction of the market based on price movements. Corresponding products of indicators:  https://www.mql5.com/zh/market/product/61388?source=Site+Market+Product+Page#description
To get access to MT4 version please click   here . This is the exact conversion from TradingView: QQE MT4 Glaz-modified by JustUncleL This is a light-load processing and non-repaint indicator. All input options are available. This is not a multi time frame indicator. Buffers are available for processing in EAs. You can message in private chat for further changes you need.
Découvrez RSIScalperPro - un indicateur innovant basé sur le RSI pour MetaTrader 5, optimisé pour le scalping sur des graphiques d'une minute ! Avec RSIScalperPro, vous aurez entre vos mains un puissant outil vous fournissant des signaux d'entrée et de sortie précis. RSIScalperPro utilise deux indicateurs RSI différents pour fournir des signaux clairs pour les niveaux de surachat et de survente. Vous pouvez ajuster les périodes et les valeurs limites des deux RSI selon votre stratégie de tradin
- This is an implementation of OCC ==> open close cross - This indicator applies twelve different averaging methods to open and close prices separately to signal the trend switching. - All MA methods are set as input as well as period and different offsets applied to linear regression and ALMA averaging. - Buffers 16 and 17 can be used in EAs to detect trend direction. - You can message in private chat for further changes you need.
MP Heatmap for MT5
Pierre Ksachikian
4 (2)
A heatmap is a graphical representation of data in two dimensions, using colors to display different factors. Heatmaps are a helpful visual aid for viewers, enabling the quick dissemination of statistical or data-driven information. The MP Heatmap indicator provides a graphical representation of the relative strengths of major currencies compared to others, organizing data from pairs into color-coded results and producing a clear overview of the entire Forex market. The MP Heatmap indicator dis
FREE
The Quantitative Qualitative Estimation (QQE) indicator is derived from Wilder’s famous Relative Strength Index (RSI). In essence, the QQE is a heavily smoothed RSI. Modification of this version: ( converted from tradingview script by Mihkell00, original from Glaz) So there are Two QQEs. One that is shown on the chart as columns, and the other "hidden" in the background which also has a 50 MA   bollinger band   acting as a zero line. When both of them agree - you get a blue or a red bar.
【Super Scanner】Indicator Introduction : The color of the Super Scanner which is green and climbing up means that the price trend is going up.The color of the Super Scanner is red and going down means that the price trend is going down. It is very simple to use it to judge the market trend! What's even better is that the open parameters of the indicators allow investors to adjust. You can adjust【Super Scanner】according to your needs. Adjust it faster to be closer to short-term market fluctuati
Market Ticker Pro MT5
John Louis Fernando Diamante
The only Market Ticker on the market! Add a professional novelty to your workspace, with built in mini-charts A scrolling Market Ticker that displays price changes from all symbols in the Market Watch list. Provides an easy snapshot of symbol prices, and keeps scrolling automatically while you trade and analyse the chart. The ticker color (+/- price changes) are based on either the current or completed candle, and the previous candle. Options include: - MTF, eg choose to show price changes o
The Fat and Slim indicator tracks strong and weak money in the market. It is derived from RSI, MFI and many similar indicators. Input values are closing prices and volumes. The RSI (yellow curve) is in the range -100 ... 100. It is additionally multiplied by a coefficient so that the curve is not compressed to the middle values at higher periods (a problem with the classic RSI with different periods). Strong/Fat red curve is RSI weighted by higher volumes. Weak/Slim blue curve is calculated so t
Triple Machine
Thomas Bradley Butler
Build your own model to predict averages of turning points of the Triple Moving Average Oscillator. It is simple.  Rate me with stars. Just load the indicator Triple Moving Average Oscillator in you platform and choose the period.  Scroll through to observe the averages of the highs and lows over a period of time. Add the levels for a buy and a sell on the Triple Machine and this will show the average of highs and lows to look for buys and sell. You can load multiple copies with multiple levels.
Descriptions A point point is a technical analysis indicator, or calculations, used to determine the overall trend of market over different time frames. This indicator calculate the highest or lowest pivots among left x and right y bars and show the high/low level during that period.   From that, you could clearly see the top resistance & bottom support level and how market goes break out. Instructions pivotLeft - pivot left bar count pivotRight - pivot right bar count pivotHighColor - c
TPO Profile MT5
Kyra Nickaline Watson-gordon
Definition : TPO is a Time Price Opportunity. Instead of using bars or candles with an Open, High, Low, and Close price, each "bar" in a Market Profile is represented by horizontal bars against the price It is called Market Profile terminology. In other words time-price-opportunity (TPO) profiles are histograms of how much time was spent at each price within the span of the profile. By using a TPO chart, you are able to analyze the amount of trading activity, based on time, for each price leve
Introduction This indicator detects volume spread patterns for buy and sell opportunity. The patterns include demand and supply patterns. You might use each pattern for trading. However, these patterns are best used to detect the demand zone (=accumulation area) and supply zone (=distribution area). Demand pattern indicates generally potential buying opportunity. Supply pattern indicates generally potential selling opportunity. These are the underlying patterns rather than direct price action. T
Ce signal DYJ est un système de trading complet basé sur les indicateurs techniques ATR. Ces indicateurs enregistrent l' état actuel de chaque tendance de force dans chaque paire de devises pour chaque période et chaque analyse. En évaluant ces données, les signaux électriques DYJ créent de manière professionnelle une liste de signaux d'intensité de tendance et de point d'entrée. Si l'une des paires correspond exactement, une alerte s'affiche pour l'indiquer. Les données de la liste comprennent
Non-lagging VOLATILITY indicator A radical modification of the ATR indicator, which corrected all of its shortcomings (the picture shows the difference with ATR). The indicator shows the swing size of the current market movement. Features: does not have a time window period, i.e. any subjective settings non-delayed, the extremums of the indicator always coincide with the extremum of the price (note the picture) is normalized by means of a color solution, i.e. it has the properties of an oscillat
Hrum
Yvan Musatov
The Hrum indicator was created to neutralize temporary pauses and rollbacks. It analyzes price behavior and, if there is a temporary weakness in the trend, you can notice this from the indicator readings, as in the case of a pronounced change in trend direction. Entering the market is not difficult, but staying in it is much more difficult. With the Giordano Bruno indicator and its unique trend line, staying on trend will become much easier! Every rise and every fall is reflected in your emot
UR HighsAndLows MT5
Krzysztof Jan Debski
Hauts et bas de l'UR   UR Highs&Lows effectue une analyse approfondie du mouvement des prix et de sa volatilité, et crée un canal dans lequel le prix évolue. Ce canal se déplace maintenant comme un oscillateur et est superposé à la déviation du prix pour signaler les épuisements potentiels et les inversions possibles. Avantages d'utiliser UR Highs&Lows : Aucun paramètre Vous avez 3 lignes qui décrivent le mouvement des prix - White Line qui est une moyenne du prix et Blue Lines qui sont s
Retracement Pip Catcher MT5
Christopher Graham Parish
!! FLASH SALE !!   Over 80% off !!     For ONE week only. Now only $47 - normally $297! >>>      Ends on 30 June 2023 - Don't miss it! Buy and Sell Arrows when price is about to retrace. It Also Sends Alerts – On MT5 To Your Phone To Your Email Does not repaint. Works ony any pair, any timeframe. 10 Activations allowed so you are free from limitations See an example of alerts from today (23 May 2020) using this and 2 other indicators  here . MT4 Version here . Spreads from 0.1p
Gioteen Volatility Index (GVI) - your ultimate solution to overcoming market unpredictability and maximizing trading opportunities. This revolutionary indicator helps you in lowering your losing trades due to choppy market movements. The GVI is designed to measure market volatility, providing you with valuable insights to identify the most favorable trading prospects. Its intuitive interface consists of a dynamic red line representing the volatility index, accompanied by blue line that indicate
ToolBox 360 is the swiss knife of all indicators. It is full packed with useful tools to help you with your trading. It can be used to find best entry and exit points and help you to decide if you should open a trade or not. It shows market trends, candlestick formations outside / inside bars and you can sett time based allerts. Main features: Time based Fibonacci lines Choose a start and end time and the indicator shows you Fibonacci lines within the selected time range including range high
The 4 headed dragon is an indicator that has two functions. 1) Set the background trend. 2) Mark the predominant trend. By combining these two indicator signals, we will be able to trade for or against the trend, adapting the signals to your reading of the market. You can download the demo and test it yourself. 1) Set the background trend.    Define four possibilities of trend that are the four heads of the dragon, marked by colors on the indicator, marking a) Powerful buying trend. b)
** All Symbols x All Timeframes scan just by pressing scanner button ** *** Contact me after the purchase to send you instructions and add you in "ABCD scanner group" for sharing or seeing experiences with other users. Introduction This indicator scans AB=CD retracement patterns in all charts. The ABCD is the basic foundation for all harmonic patterns and highly repetitive with a high success rate . The ABCD Scanner indicator is a scanner reversal ABCD pattern that helps you identify when the pr
Market Chopper Indicator - is the manual system for market scalping. Indicator uses most accurate points to enter, when current trend has lost it's power and new one starts. Indicator shows : Enter points(buy/sell arrows), Exit points(Stoploss/Takeprofit arrows). Indicator makes market analysis and adapts to any market, any timeframe showing most relevant strategy for exact conditions. Main Indicator's Features Signals are NOT repaint, late or disappear; Every signal comes at the open of new bar
The Rocket Trend indicator is trending. The indicator draws two-color points connected by lines along the chart. This is a trend indicator, it is an algorithmic indicator. It is easy to work and understand when a blue circle appears, you need to buy, when a red one appears, sell. The indicator is used for scalping and pipsing, and has proven itself well. Rocket Trend is available for analyzing the direction of the trend for a specific period of time. Ideal for novice traders learning the laws o
Note: If you want to apply this indicators on indicators which are shown in a sub-window, then consider using this indicator instead:  https://www.mql5.com/en/market/product/109066.&nbsp ; AIntel Predict - Your Gateway to Future Trading Success! Unlock the power of predictive analytics with AIntel Predict. Say goodbye to the guesswork and hello to improved forecasting, as AIntel Predict leverages historical data to unveil the future of your trades like never before. Whether you're a seasoned tra
1. Why did I develop this series of indicators I found that most traders need to use multiple time frame indicators. They usually switch time frame to see indicators. However, once the timeframe is switched, you cannot see the  corresponding relationship  between  the price in the smaller timeframe  and  the indicator in the larger timeframe . For example: if your price chart is in H1 timeframe, you can see H4, D1 and W1 indicators in H1 timeframe Chart. This is more helpful for you to find t
Gapless Moving Average  (GMA) Improved version of standard   Moving Average  (MA) from MetaTrader library which provides the possibility to eliminate the 'gaps' between candle sticks which distort the average values mainly during the N ('period') initial candles after market opens due to the spread ('gap') between closing price from previous day and opening price from the next day. The greater these 'gaps' are, the more divergent the standard MA is in order to indicate the current price trend
Les acheteurs de ce produit ont également acheté
Atomic Analyst MT5
Issam Kassas
4.79 (19)
Tout d'abord, il convient de souligner que cet indicateur de trading n'est ni repainting, ni redrawing et ne présente aucun délai, ce qui le rend idéal à la fois pour le trading manuel et automatisé. Manuel de l'utilisateur : réglages, entrées et stratégie. L'Analyste Atomique est un indicateur d'action sur les prix PA qui utilise la force et le momentum du prix pour trouver un meilleur avantage sur le marché. Équipé de filtres avancés qui aident à éliminer les bruits et les faux signaux, et à
Atbot
Zaha Feiz
4.96 (28)
AtBot : Comment ça fonctionne et comment l'utiliser ### Comment ça fonctionne L'indicateur "AtBot" pour la plateforme MT5 génère des signaux d'achat et de vente en utilisant une combinaison d'outils d'analyse technique. Il intègre la Moyenne Mobile Simple (SMA), la Moyenne Mobile Exponentielle (EMA) et l'indice de la Plage Vraie Moyenne (ATR) pour identifier les opportunités de trading. De plus, il peut utiliser des bougies Heikin Ashi pour améliorer la précision des signaux. Laissez un avis ap
Tout d'abord, il convient de souligner que ce système de trading est un indicateur non repeint, non redessiné et non retardé, ce qui le rend idéal pour le trading manuel et automatisé. Cours en ligne, manuel et téléchargement de préréglages. Le "Système de Trading Smart Trend MT5" est une solution de trading complète conçue pour les traders débutants et expérimentés. Il combine plus de 10 indicateurs premium et propose plus de 7 stratégies de trading robustes, ce qui en fait un choix polyvalent
Gold Stuff mt5
Vasiliy Strukov
4.9 (185)
Gold Stuff mt5 est un indicateur de tendance conçu spécifiquement pour l'or et peut également être utilisé sur n'importe quel instrument financier. L'indicateur ne se redessine pas et ne traîne pas. Délai recommandé H1. Contactez-moi immédiatement après l'achat pour obtenir les réglages et un bonus personnel !   Vous pouvez obtenir une copie gratuite de notre indicateur Strong Support et Trend Scanner, veuillez envoyer un message privé. moi!   RÉGLAGES Dessiner la flèche - on off. dessine
TPSproTREND PrO MT5
Roman Podpora
4.89 (9)
TPSpro TREND PRO  - is a trend indicator that automatically analyzes the market and provides information about the trend and each of its changes, as well as giving signals for entering trades without redrawing! The indicator uses each candle, analyzing them separately. referring to different impulses - up or down impulse. Exact entry points into transactions for currencies, crypto, metals, stocks, indices!  Version MT4               DETAILED DESCRIPTION               R ecommended to use with an
TPSpro RFI Levels MT5
Roman Podpora
4.67 (9)
Reversal First Impulse levels (RFI)      INSTRUCTIONS        RUS       -       ENG              R ecommended to use with an indicator   -   TPSpro  TREND PRO -  Version MT4                 A key element in trading is zones or levels from which decisions to buy or sell a trading instrument are made. Despite attempts by major players to conceal their presence in the market, they inevitably leave traces. Our task was to learn how to identify these traces and interpret them correctly. Main functi
Top indicator for MT5   providing accurate signals to enter a trade without repainting! It can be applied to any financial assets:   forex, cryptocurrencies, metals, stocks, indices .  Watch  the video  (6:22) with an example of processing only one signal that paid off the indicator! MT4 version is here It will provide pretty accurate trading signals and tell you when it's best to open a trade and close it. Most traders improve their trading results during the first trading week with the help of
Tout d'abord, il convient de souligner que cet outil de trading est un indicateur non repeint, non redessiné et non retardé, ce qui le rend idéal pour le trading professionnel. Cours en ligne, manuel utilisateur et démonstration. L'indicateur Smart Price Action Concepts est un outil très puissant à la fois pour les nouveaux et les traders expérimentés. Il regroupe plus de 20 indicateurs utiles en un seul, combinant des idées de trading avancées telles que l'analyse du trader Inner Circle et
Quantum Trend Sniper
Bogdan Ion Puscasu
4.92 (48)
Présentation       Quantum Trend Sniper Indicator   , l'indicateur révolutionnaire MQL5 qui transforme la façon dont vous identifiez et négociez les inversions de tendance ! Développé par une équipe de traders expérimentés avec une expérience commerciale de plus de 13 ans,       Indicateur Quantum Trend Sniper       est conçu pour propulser votre parcours de trading vers de nouveaux sommets grâce à sa manière innovante d'identifier les inversions de tendance avec une précision extrêmement élevée
Trend Screener Pro MT5
STE S.S.COMPANY
4.88 (67)
Indicateur de tendance, solution unique révolutionnaire pour le trading et le filtrage des tendances avec toutes les fonctionnalités de tendance importantes intégrées dans un seul outil ! Il s'agit d'un indicateur multi-période et multi-devises 100 % non repeint qui peut être utilisé sur tous les symboles/instruments : forex, matières premières, crypto-monnaies, indices et actions. Trend Screener est un indicateur de suivi de tendance efficace qui fournit des signaux de tendance fléchés avec des
FX Power MT5 NG
Daniel Stein
5 (6)
Obtenez votre mise à jour quotidienne du marché avec des détails et des captures d'écran via notre Morning Briefing ici sur mql5 et sur Telegram ! FX Power MT5 NG est la nouvelle génération de notre très populaire indicateur de force des devises, FX Power. Et qu'est-ce que ce compteur de force de nouvelle génération offre ? Tout ce que vous avez aimé de l'original FX Power PLUS Analyse de la force de l'OR/XAU Des résultats de calcul encore plus précis Périodes d'analyse configurables individuel
FX Volume MT5
Daniel Stein
4.94 (17)
Obtenez votre mise à jour quotidienne du marché avec des détails et des captures d'écran via notre Morning Briefing ici sur mql5 et sur Telegram ! FX Volume est le PREMIER et SEUL indicateur de volume qui fournit un VRAI aperçu du sentiment du marché du point de vue d'un courtier. Il fournit des informations impressionnantes sur la façon dont les acteurs institutionnels du marché, comme les courtiers, sont positionnés sur le marché des changes, bien plus rapidement que les rapports COT. Voir c
IX Power MT5
Daniel Stein
4.17 (6)
IX Power   apporte enfin la précision imbattable de FX Power aux symboles non-Forex. Il détermine avec précision l'intensité des tendances à court, moyen et long terme de vos indices, actions, matières premières, ETF et même crypto-monnaies préférés. Vous pouvez   analyser tout ce que   votre terminal a à offrir. Essayez-le et découvrez comment   votre timing s'améliore considérablement   lors de vos transactions. Caractéristiques principales d'IX Power Résultats de calcul précis à 100 %,
XQ Indicator MetaTrader 5
Marzena Maria Szmit
3.5 (2)
Step into the realm of Forex trading with confidence and precision using XQ, a cutting-edge Forex indicator designed to elevate your trading game to unprecedented heights. Whether you're a seasoned trader or just stepping into the world of currency exchange, XQ Forex Indicator empowers you with the insights and signals needed to make informed trading decisions. The signal conditions are a combination of three indicators, and XQ Forex Indicator only display  medium and long-term trends . The ind
Easy By Sell is a market indicator for opening and closing positions. It becomes easy to track market entries with alerts. It indicates trend reversal points when a price reaches extreme values ​​and the most favorable time to enter the market. it is as effective as a Fibonacci to find a level but it uses different tools such as an algorithm based on ATR indicators and Stochastic Oscillator. You can modify these two parameters as you wish to adapt the settings to the desired period. My othe
Ce tableau de bord affiche les derniers   modèles harmoniques   disponibles pour les symboles sélectionnés, ce qui vous permettra de gagner du temps et d'être plus efficace /   version MT4 . Indicateur gratuit:   Basic Harmonic Pattern Colonnes de l'indicateur Symbol :   les symboles sélectionnés apparaissent Trend   :   haussière ou baissière Pattern :   type de motif (gartley, papillon, chauve-souris, crabe, requin, cypher ou ABCD) Entry:   prix d'entrée SL:   prix du stop loss TP1:   1
TrendMaestro5
Stefano Frisetti
note: this indicator is for METATRADER4, if you want the version for METATRADER5 this is the link:  https://www.mql5.com/it/market/product/108106 TRENDMAESTRO ver 2.4 TRENDMAESTRO recognizes a new TREND in the bud, he never makes mistakes. The certainty of identifying a new TREND is priceless. DESCRIPTION TRENDMAESTRO identifies a new TREND in the bud, this indicator examines the volatility, volumes and momentum to identify the moment in which there is an explosion of one or more of these data a
Golden Spikes Premium
Kwaku Bondzie Ghartey
Golden Spikes Detector Overview: The Golden Spikes Premium is a groundbreaking trading indicator meticulously crafted for the Boom and Crash indices on the Deriv market. Tailored to meet the needs of discerning traders, this powerful tool operates exclusively on the one-minute timeframe, providing timely and precise signals to maximize your trading potential. The Golden Spikes Detector stands out in its ability to deliver accurate signals, ensuring that you capitalize on market opportunities wit
Gartley Hunter Multi
Siarhei Vashchylka
5 (8)
Gartley Hunter Multi - An indicator for searching for harmonic patterns simultaneously on dozens of trading instruments and on all possible timeframes. Manual (Be sure to read before purchasing) | Version for MT4 Advantages 1. Patterns: Gartley, Butterfly, Shark, Crab. Bat, Alternate Bat, Deep Crab, Cypher 2. Simultaneous search for patterns on dozens of trading instruments and on all possible timeframes 3. Search for patterns of all possible sizes. From the smallest to the largest 4. A
Unlock key market insights with automated support and resistance lines Special Offer: Purchase now to receive free bonuses worth $89! (Read more for details) Tired of plotting support and resistance lines? This is a multi-timeframe indicator that detects and plots supports and resistance lines in the chart with the same precision as a human eye would. As price levels are tested over time and its importance increases, the lines become thicker and darker, making price leves easy to glance and ev
Matrix Arrow Indicator MT5
Juvenille Emperor Limited
5 (14)
Matrix Arrow Indicator MT5   est une tendance unique 10 en 1 suivant un indicateur multi-période   100% non repeint   qui peut être utilisé sur tous les symboles/instruments:   forex ,   matières premières ,   crypto-monnaies ,   indices ,  actions .  Matrix Arrow Indicator MT5  déterminera la tendance actuelle à ses débuts, en rassemblant des informations et des données à partir d'un maximum de 10 indicateurs standard, qui sont: Indice de mouvement directionnel moyen (ADX) Indice de canal de m
Volume by Price MT5
Brian Collard
3.6 (5)
The Volumebyprice.com Indicator for MetaTrader 5 features Volume Profile and Market Profile TPO (Time Price Opportunity). Volume and TPO histogram bar and line charts. Volume Footprint charts. TPO letter and block marker collapsed and split structure charts. Static, dynamic and flexible range segmentation and compositing methods with relative and absolute visualizations. Session hours filtering and segment concatenation with Market Watch and custom user specifications. Graphical layering, posit
ICT, SMC, SMART MONEY CONCEPTS, SMART MONEY, Smart Money Concept, Support and Resistance, Trend Analysis, Price Action, Market Structure, Order Blocks, BOS/CHoCH,   Breaker Blocks ,  Momentum Shift,   Supply&Demand Zone/Order Blocks , Strong Imbalance,   HH/LL/HL/LH,    Fair Value Gap, FVG,  Premium  &   Discount   Zones, Fibonacci Retracement, OTE, Buy Side Liquidity, Sell Side Liquidity, BSL/SSL Taken, Equal Highs & Lows, MTF Dashboard, Multiple Time Frame, BigBar, HTF OB, HTF Market Structure
Volatility Trend System - est un système commercial qui fournit des signaux pour les entrées. Le système de volatilité donne des signaux linéaires et ponctuels dans le sens de la tendance, ainsi que des signaux pour en sortir, sans redessin ni délai. L'indicateur de tendance surveille la direction de la tendance à moyen terme, montre la direction et son changement. L'indicateur de signal est basé sur les changements de volatilité et montre les entrées sur le marché. L'indicateur est équipé
Blahtech Supply Demand MT5
Blahtech Limited
4.54 (13)
Was: $299  Now: $99   Supply Demand uses previous price action to identify potential imbalances between buyers and sellers. The key is to identify the better odds zones, not just the untouched ones. Blahtech Supply Demand indicator delivers functionality previously unavailable on any trading platform. This 4-in-1 indicator not only highlights the higher probability zones using a multi-criteria strength engine, but also combines it with multi-timeframe trend analysis, previously confirmed swings
Gold TMAF MTF - il s'agit d'un meilleur indicateur technique boursier. L'algorithme de l'indicateur analyse le mouvement du prix d'un actif et reflète la volatilité et les zones d'entrée potentielles. Les meilleurs signaux de l'indicateur: - Pour VENDRE = limite supérieure rouge de la TMA2 au-dessus de la limite supérieure rouge de la TMA1 + indicateur fractal rouge au-dessus + flèche jaune du signal SR dans la même direction. - Pour l'ACHAT = limite inférieure bleue de la TMA2 en desso
Automated Trendlines MT5
Georgios Kalomoiropoulos
Les lignes de tendance sont l'outil d'analyse technique le plus essentiel dans le trading forex. Malheureusement, la plupart des commerçants ne les dessinent pas correctement. L'indicateur Automated Trendlines est un outil professionnel pour les traders sérieux qui vous aide à visualiser le mouvement de tendance des marchés. Il existe deux types de lignes de tendance, les lignes de tendance haussières et les lignes de tendance baissières. Dans la tendance haussière, la ligne de tendance
TPA True Price Action indicator reveals the true price action of the market makers through 100% non-repainting signals strictly at the close of a candle! TPA shows entries and re-entries, every time the bulls are definitely stronger than the bears and vice versa. Not to confuse with red/green candles. The shift of power gets confirmed at the earliest stage and is ONE exit strategy of several. There are available now two free parts of the TPA User Guide for our customers. The first "The Basics"
** All Symbols x All Timeframes scan just by pressing scanner button ** ***Contact me after purchase to send you instructions and add you in "123 scanner group" for sharing or seeing experiences with other users. After 17 years of experience in the markets and programming, Winner indicator is ready. I would like to share with you! Introduction The 123 Pattern Scanner indicator with a special enhanced algorithm is a very repetitive common pattern finder with a high success rate . Interestingly,
Auto Order Block with break of structure based on ICT and Smart Money Concepts (SMC) Futures Break of Structure ( BoS )             Order block ( OB )            Higher time frame Order block / Point of Interest ( POI )    shown on current chart           Fair value Gap ( FVG ) / Imbalance   -  MTF      ( Multi Time Frame )    HH/LL/HL/LH  -  MTF      ( Multi Time Frame )  Choch  MTF      ( Multi Time Frame )  Volume Imbalance     ,  MTF          vIMB Gap’s Power of 3 Equal High
Plus de l'auteur
L'indicateur Follow Line est un outil essentiel pour les traders qui souhaitent identifier et suivre les tendances du marché avec précision. Cet indicateur s'adapte dynamiquement aux variations de prix, en traçant une ligne qui suit le mouvement des prix de manière fluide et continue. Grâce à sa simplicité visuelle et à son efficacité à signaler les changements de tendance, Follow Line est un excellent ajout à la stratégie de tout trader. Caractéristiques principales : Suivi des tendances : Foll
Améliorez Vos Stratégies de Trading avec l'Indicateur "Order Block" pour MT4 Découvrez l'Indicateur "Order Block": L'Indicateur "Order Block" pour MT4 est conçu pour vous aider à identifier précisément les blocs d'ordres sur le marché, en marquant les sommets et les creux des bougies de blocs d'ordres. Cet outil puissant vous permet de comprendre où les grandes institutions placent leurs ordres, améliorant ainsi votre capacité à prévoir les mouvements du marché. Caractéristiques Principales: Dét
FREE Spread indicator for MetaTrader 4 this indicator includes: -average spread -current spread -minimum spread -maximum spread If you are interested in my products I recommend you visit my page where you can find: Experts Advisors:  https://www.mql5.com/it/market/product/119456?source=Site+Profile indicators:  https://www.mql5.com/it/market/product/120038?source=Site+Profile I hope the spread indicator will be useful to you. https://www.mql5.com/it/users/kappa05
FREE
IMPORTANT: The indicator will remain at the price of $34.90 until the release of the update scheduled for July 16, 2024. The New Price will be $49.90 (taxes excluded) FVG indicator. If you are an SMC trader this indicator will be very useful to you, it automatically identifies the FVGs on the graph distinguishing them into 2 types: bearish FVGs and bullish FVGs (see the photos to understand better). This indicator works on any Timeframe and on any market you want to use it. If you are interested
Indicateur Profil de Volume pour MT4 Obtenez un avantage en trading avec l'indicateur "Profil de Volume" pour MetaTrader 4 (MT4). Cet outil avancé d'analyse technique vous permet d'identifier avec précision les niveaux clés de support et de résistance basés sur le volume des transactions. Visualisez facilement les zones d'intérêt du marché, où les volumes d'échange sont les plus élevés, et utilisez ces informations pour prendre des décisions de trading plus éclairées. Caractéristiques principale
Présentation de l'"Indicateur de Plage de Couleur" L'"Indicateur de Plage de Couleur" est un outil puissant d'analyse technique conçu pour la plateforme MT4, parfait pour les traders qui souhaitent avoir une vue claire et immédiate des tendances du marché. Cet indicateur trace une ligne colorée en fonction de la tendance actuelle, facilitant l'interprétation des mouvements de prix. Description de l'indicateur : Ligne verte : Indique une tendance haussière. Utilisez ce signal pour envisager des o
Qu'est-ce que "Automatic BE"? "Automatic BE" est un outil essentiel pour chaque trader manuel, conçu pour améliorer considérablement la gestion des risques. Cet indicateur avancé peut protéger automatiquement vos profits en ajustant le stop loss au niveau de break even une fois que le marché évolue en votre faveur. Avec "Automatic BE", vous pouvez continuer à trader en toute confiance, sachant que vos gains seront protégés, même lorsque vous n'êtes pas devant l'écran. Pourquoi choisir "Automatic
Qu'est-ce que "Real Time MultiIndicator"? "Real Time MultiIndicator" est un outil de trading avancé conçu pour simplifier et optimiser votre analyse technique. Cet indicateur révolutionnaire recueille des signaux provenant de plusieurs timeframes et indicateurs techniques, les affichant dans un tableau unique, clair et facile à lire. Si vous souhaitez une vision complète et détaillée du marché sans avoir à changer constamment de graphique ou à analyser manuellement chaque indicateur, "Real Time
Indicateur de bloc de commande, hauts et bas ; l'indicateur se concentre principalement sur les OB, sur le graphique, ils sont représentés par une ligne horizontale sur le minimum et le maximum de cette candle. Alors que pour les maximums et les minimums une seule ligne est marquée (voir les images pour mieux comprendre). L'indicateur est pour MT5, il fonctionne sur tous les TimeFrame, sur tous le paire Forex, sur toud les indice et sur les marchés de crypto (Pour toute les  information sur l'in
Expert Advisor for scalping; This EA was built for monthly profitability. Works on any asset: Forex, Indices, Crypto and Stocks. Perfectly usable in MT5 tester and usable on any TimeFrame. The EA has various inputs available to customize operations: -Lots -Risk% (0 = Fix) -OrderDist (the distance between one order and another, the distance is calculated in points not pips) -TP (in points) -Sl (in points) -TrailingStopTrigger(the trailing stop trigger point in points) -TrailingStop(distance from
Highs, Lows and Bos Indicator for MT5; The indicator works on any type of market and on all TimeFrames. It also works on the MetaTrader5 Tester. the main function of the indicator is to identify the highs and lows by marking them with a point above/below the candle, then with a horizontal line it marks the Bos. It is very simple and intuitive, there are only 2 inputs: -the color of the maximums -the color of the minima For any other information do not hesitate to contact me.
Panel Info Trade For MT5; The indicator has 2 main objects: -An icon chart that you can change Timeframe, zoom, Forex Pair, crypto....the position of the graph can be modified via the (x;y) inputs. The chart is perfectly usable in the MT5 tester. If the graph isn't for you and doesn't help you with anything, you can press the button on the top right to make it smaller. -the second object is a dynamic control panel where you can change plots, place sl and tp, BE, close partial... (if you watch th
Indicateur de Force de la Monnaie (Currency Strength Index - CSI) AVANT D'ACTIVER L'INDICATEUR, RAPPELEZ-VOUS DE METTRE "TRUE" POUR AFFICHER LES PAIRES L'indicateur de Force de la Monnaie (Currency Strength Index - CSI) est un outil puissant utilisé dans le trading forex pour mesurer la force relative des principales devises. Cet indicateur aide les traders à identifier les devises les plus fortes et les plus faibles à un moment donné, leur permettant de prendre des décisions de trading plus in
Dans le monde du trading, la clé du succès réside dans la possession des bons outils au bon moment. Notre indicateur de profil de volume innovant a été développé avec un seul objectif en tête : offrir aux traders un accès sans précédent aux informations essentielles sur l'activité du marché. Cet outil de pointe vous permet de voir non seulement où et quand les volumes sont échangés, mais aussi de comprendre la profondeur du marché avec une clarté jamais vue auparavant. Caractéristiques Principal
Maximisez Vos Opportunités de Trading avec l'Indicateur "Auto Trendlines" Découvrez l'Indicateur "Auto Trendlines": "Auto Trendlines" est l'outil essentiel pour tout trader technique. Cet indicateur trace automatiquement les lignes de tendance, identifiant les niveaux de soutien et de résistance avec une précision chirurgicale. Il est idéal pour ceux qui cherchent à capitaliser sur les breakouts et les renversements du marché. Caractéristiques Principales: Traçage Automatique des Lignes de Tenda
Optimisez Vos Décisions de Trading avec l'Indicateur "autoFibo" Découvrez l'Indicateur "autoFibo": "autoFibo" est l'outil d'analyse essentiel pour les traders souhaitant exploiter pleinement les niveaux de Fibonacci sans avoir à les tracer manuellement. Cet indicateur automatise le processus de retracement de Fibonacci, offrant un accès visuel instantané aux zones clés de support et de résistance. Caractéristiques Principales: Retracement Automatique de Fibonacci: Trace automatiquement les nivea
Améliorez Votre Performance de Trading avec l'Indicateur "Better Volume" Découvrez l'Indicateur "Better Volume": Le "Better Volume" est l'outil essentiel d'analyse du volume du marché pour les traders souhaitant se démarquer. Il analyse les volumes de ticks avec une précision inégalée, grâce à sa fonction avancée de moyenne mobile (PERIOD_MA) et à des alertes d'achat et de vente personnalisables. Caractéristiques Principales: Analyse Avancée du Volume: Reconnaissez les pics de volume signalant d
Le SuperTrend est l'un des indicateurs techniques les plus efficaces et les plus utilisés dans le trading, idéal pour identifier la direction de la tendance et générer des signaux d'entrée et de sortie. Basé sur la volatilité et la tendance, cet indicateur s'adapte dynamiquement aux conditions du marché, offrant une référence visuelle claire pour les traders. Caractéristiques Principales : Détection de Tendance : Le SuperTrend suit la tendance du marché, dessinant une ligne qui se positionne au-
Nouvel Indicateur Combiné - 3 en 1 Vous cherchez des outils de trading qui peuvent améliorer votre analyse de marché et vos stratégies d'investissement ? Nous avons combiné trois de nos meilleurs indicateurs en une seule solution puissante et pratique, vous permettant de maximiser la valeur de votre trading. 1. Indicateur de Bloc d'Ordre (vendu précédemment à 32,90$) L'Indicateur de Bloc d'Ordre est un outil essentiel pour identifier les zones d'intérêt institutionnel fort sur le marché. Cet ind
Qu'est-ce que le "Schaff RSX" ? Le "Schaff RSX" combine l'efficacité de l'indice de force relative (RSX) avec la précision du cycle Schaff, créant ainsi un indicateur unique qui vous aidera à identifier facilement les meilleurs moments pour entrer et sortir du marché. C'est comme avoir un radar qui détecte les opportunités de trading cachées, vous offrant un avantage concurrentiel que les autres traders ne peuvent tout simplement pas se permettre d'ignorer. Pourquoi choisir le "Schaff RSX" ? Sim
Qu'est-ce que "Automatic BE"? "Automatic BE" est un outil essentiel pour chaque trader manuel, conçu pour améliorer considérablement la gestion des risques. Cet indicateur avancé peut protéger automatiquement vos profits en ajustant le stop loss au niveau de break even une fois que le marché évolue en votre faveur. Avec "Automatic BE", vous pouvez continuer à trader en toute confiance, sachant que vos gains seront protégés, même lorsque vous n'êtes pas devant l'écran. Pourquoi choisir "Automatic
Filtrer:
Aucun avis
Répondre à l'avis