• Übersicht
  • Bewertungen
  • Diskussion

FVG for MT5

"Fair Value Gap" (FVG) Indikator - Entdecken Sie die Kraft von Marktungleichgewichten

Die Welt des Tradings ist voller versteckter Chancen, aber nur diejenigen, die die richtigen Werkzeuge besitzen, können sie effektiv erkennen und nutzen. Unser FVG Indikator wurde entwickelt, um Ihnen dabei zu helfen. Wenn Sie ein Trader sind, der seine Fähigkeit zur Marktanalyse verbessern und die besten Ein- und Ausstiegspunkte identifizieren möchte, ist der FVG Indikator Ihr perfekter Begleiter.

Was ist das Fair Value Gap (FVG)?

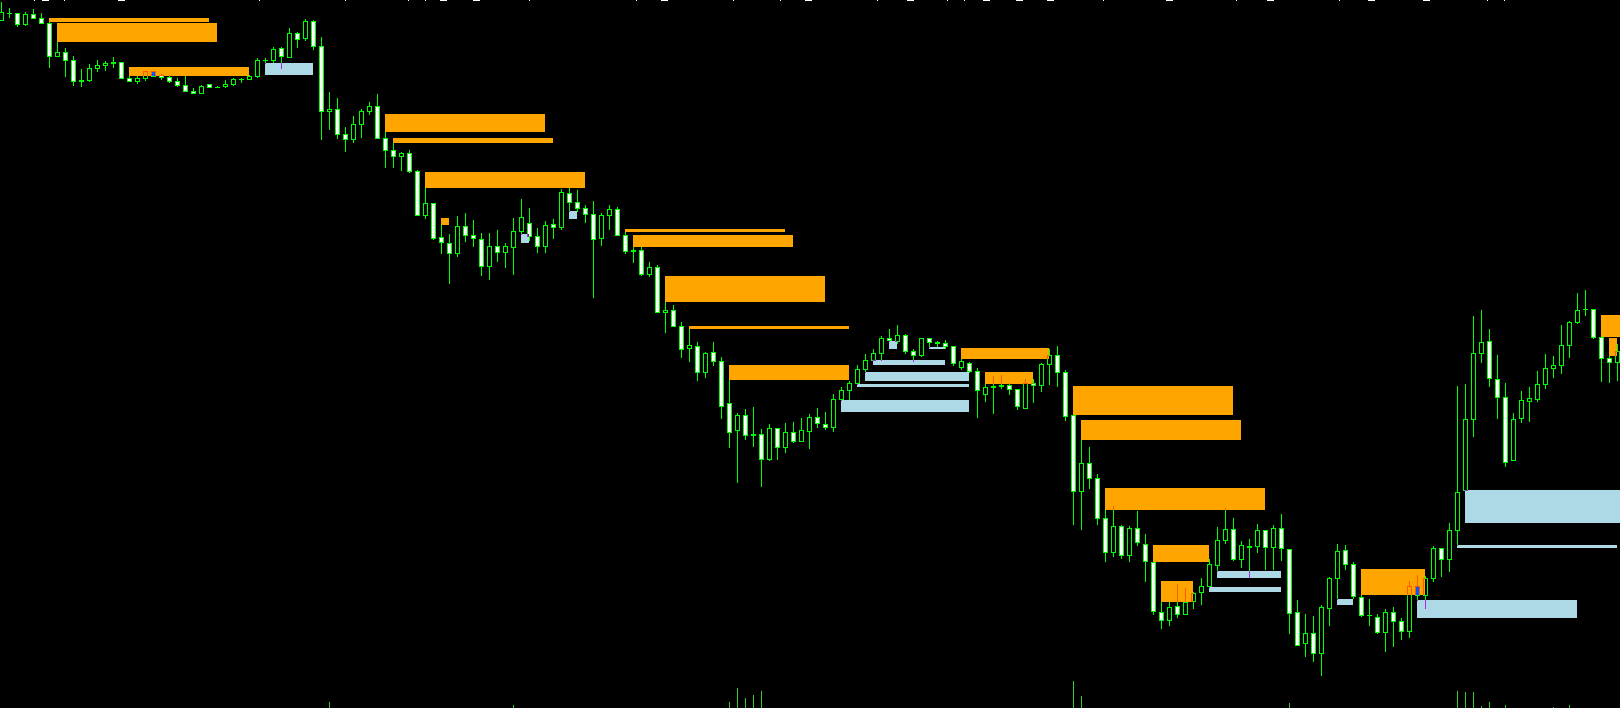
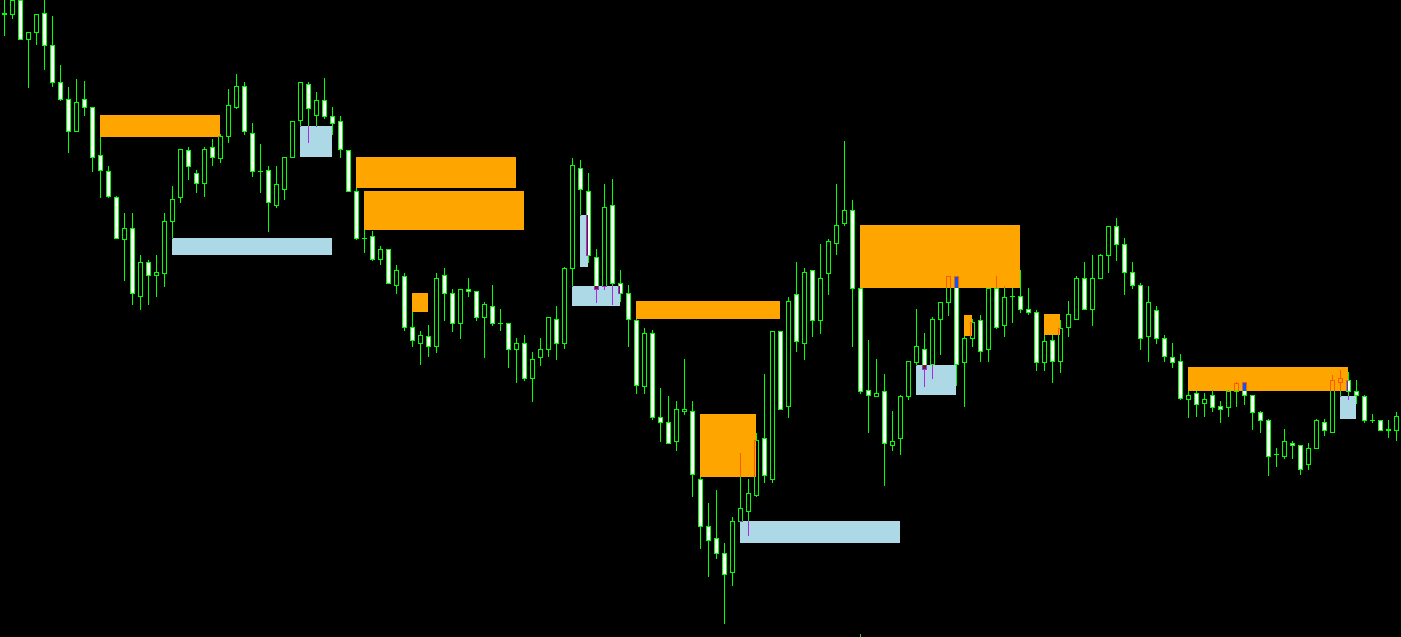
Das Konzept des Fair Value Gap bezieht sich auf eine Diskrepanz zwischen Angebot und Nachfrage, die eine "Lücke" im Preisdiagramm erzeugt. Diese Lücke stellt einen Bereich dar, in dem der Preis möglicherweise zurückkehren könnte, um dieses Ungleichgewicht auszugleichen, was diese Zonen für potenzielle Handelsmöglichkeiten wertvoll macht. Diese Lücken entstehen während schneller Preisbewegungen und können der Schlüssel zum Verständnis des zukünftigen Marktverhaltens sein.

Warum ist der FVG Indikator unverzichtbar?

Der FVG Indikator ermöglicht es Ihnen, diese Ungleichgewichtsbereiche leicht im Diagramm zu identifizieren und hebt die Punkte hervor, an denen der Preis zurückkehren könnte, um die Lücke zu schließen. Diese Informationen sind für jede Handelsstrategie von entscheidender Bedeutung, da sie den Tradern die Fähigkeit geben, wichtige Preisniveaus zu identifizieren, an denen Rücksetzer oder Beschleunigungen auftreten können.

Hauptmerkmale des FVG Indikators

  • Automatische Lückenerkennung: Der FVG Indikator scannt das Diagramm automatisch, um Fair Value Gaps zu identifizieren, spart Ihnen Zeit und reduziert die Möglichkeit menschlicher Fehler.
  • Klare visuelle Signale: Die Lückenbereiche werden deutlich im Diagramm markiert, sodass Sie sofort erkennen können, wo sich potenzielle Handelsmöglichkeiten befinden.
  • Vollständig anpassbar: Sie können den Indikator nach Ihren spezifischen Bedürfnissen konfigurieren und Parameter anpassen, um Ihre Handelsstrategie zu unterstützen. Egal, ob Sie kurzfristig oder langfristig handeln, der FVG Indikator passt sich Ihren Anforderungen an.
  • Geeignet für alle Trader: Egal, ob Sie Anfänger oder Profi sind, der FVG Indikator ist benutzerfreundlich und kann in jeden Handelsstil integriert werden.
  • Kompatibilität mit mehreren Plattformen: Der FVG Indikator ist mit verschiedenen Handelsplattformen kompatibel, sodass Sie ihn auf mehreren Instrumenten und Märkten verwenden können.

Wie nutzen Sie den FVG Indikator in Ihrer Handelsstrategie?

  1. Installation: Fügen Sie den FVG Indikator zu dem Diagramm des von Ihnen gewählten Finanzinstruments hinzu.
  2. Einstellungen: Passen Sie die Indikatorparameter nach Ihren Vorlieben an. Sie können die Lückenempfindlichkeit und andere Kriterien anpassen, um die Signale zu optimieren.
  3. Analyse: Beobachten Sie das Diagramm und achten Sie auf die Stellen, an denen der FVG Indikator Lückenbereiche identifiziert hat. Dies sind Schlüsselstellen, auf die Sie Ihre Aufmerksamkeit richten sollten.
  4. Entscheidungsfindung: Nutzen Sie die vom Indikator bereitgestellten Informationen, um zu entscheiden, wann Sie in den Markt ein- oder aussteigen. Der FVG Indikator hilft Ihnen nicht nur, die besten Chancen zu finden, sondern kann auch zur Risikoverwaltung verwendet werden, indem potenzielle Rückzugszonen identifiziert werden.

Vorteile des FVG Indikators

  • Erhöhte Genauigkeit: Mit dem FVG Indikator erhalten Sie eine klarere Vorstellung davon, wohin sich der Markt bewegen könnte, was Ihre Fähigkeit zur Vorhersage zukünftiger Bewegungen verbessert.
  • Reduziertes Risiko: Durch die Identifizierung von Ungleichgewichtsbereichen können Sie vermeiden, zu den falschen Zeiten in den Markt einzutreten, und Ihr Risikomanagement verbessern.
  • Erweiterte Chancen: Durch das Erkennen der Lücken erhalten Sie Zugang zu mehr Handelsmöglichkeiten, sodass Sie die besten Ein- und Ausstiegspunkte mit größerem Vertrauen auswählen können.


Empfohlene Produkte
Dieser Indikator ist ein perfekter automatischer Wellenanalyse-Indikator für den praktischen Handel! Die standardisierte Definition des Bandes ist nicht mehr eine Welle von verschiedenen Leuten, und das Ziehen von menschengemachten Interferenzen wird eliminiert, was eine Schlüsselrolle bei der gründlichen Analyse des Ansatzes spielt. =>Increase the choice of international style mode, (red fall green rise style)           Derzeit Kaufrabatt!   Inhalt des Index: 1.       Grundwelle:   Zue
1. Why did I develop this series of indicators I found that most traders need to use multiple time frame indicators. They usually switch time frame to see indicators. However, once the timeframe is switched, you cannot see the  corresponding relationship  between  the price in the smaller timeframe  and  the indicator in the larger timeframe . For example: if your price chart is in H1 timeframe, you can see H4, D1 and W1 indicators in H1 timeframe Chart. This is more helpful for you to find t
The Beta index, also known as the Beta indicator, is one of the key reference indicators for hedging institutions. It allows you to measure the relative risk of individual assets, such as currencies and commodities, in comparison to market portfolios, cross-currency pairs, the U.S. dollar index, and stock indices. By understanding how your assets perform in relation to market benchmarks, you will have a clearer understanding of your investment risk. Key Features: Accurate Risk Assessment: The Be
Plucking Machine I   Plucking Machine I is a trend indicator designed specifically for gold and can also be used on any financial instrument. The indicator does not redraw and does not lag. Recommended time frame H1. The current setting is applicable for all time periods. It shows the current direction of the market based on price movements. Corresponding products of indicators:  https://www.mql5.com/zh/market/product/61388?source=Site+Market+Product+Page#description
To get access to MT4 version please click   here . This is the exact conversion from TradingView: QQE MT4 Glaz-modified by JustUncleL This is a light-load processing and non-repaint indicator. All input options are available. This is not a multi time frame indicator. Buffers are available for processing in EAs. You can message in private chat for further changes you need.
Entdecken Sie den RSIScalperPro - den revolutionären RSI-basierten Indikator für den Metatrader 5, der speziell für das Scalptrading im einminütigen Chart entwickelt wurde. Mit RSIScalperPro erhalten Sie einen leistungsstarken Werkzeugkasten für den präzisen Einstieg und Ausstieg aus Trades, um Ihr Trading auf die nächste Stufe zu bringen. RSIScalperPro verwendet zwei verschiedene RSI-Indikatoren, die Ihnen klare Signale für überkaufte und überverkaufte Bereiche liefern. Sie können die Zeitperi
- This is an implementation of OCC ==> open close cross - This indicator applies twelve different averaging methods to open and close prices separately to signal the trend switching. - All MA methods are set as input as well as period and different offsets applied to linear regression and ALMA averaging. - Buffers 16 and 17 can be used in EAs to detect trend direction. - You can message in private chat for further changes you need.
MP Heatmap for MT5
Pierre Ksachikian
4 (2)
A heatmap is a graphical representation of data in two dimensions, using colors to display different factors. Heatmaps are a helpful visual aid for viewers, enabling the quick dissemination of statistical or data-driven information. The MP Heatmap indicator provides a graphical representation of the relative strengths of major currencies compared to others, organizing data from pairs into color-coded results and producing a clear overview of the entire Forex market. The MP Heatmap indicator dis
FREE
The Quantitative Qualitative Estimation (QQE) indicator is derived from Wilder’s famous Relative Strength Index (RSI). In essence, the QQE is a heavily smoothed RSI. Modification of this version: ( converted from tradingview script by Mihkell00, original from Glaz) So there are Two QQEs. One that is shown on the chart as columns, and the other "hidden" in the background which also has a 50 MA   bollinger band   acting as a zero line. When both of them agree - you get a blue or a red bar.
【Super Scanner】Indicator Introduction : The color of the Super Scanner which is green and climbing up means that the price trend is going up.The color of the Super Scanner is red and going down means that the price trend is going down. It is very simple to use it to judge the market trend! What's even better is that the open parameters of the indicators allow investors to adjust. You can adjust【Super Scanner】according to your needs. Adjust it faster to be closer to short-term market fluctuati
Market Ticker Pro MT5
John Louis Fernando Diamante
The only Market Ticker on the market! Add a professional novelty to your workspace, with built in mini-charts A scrolling Market Ticker that displays price changes from all symbols in the Market Watch list. Provides an easy snapshot of symbol prices, and keeps scrolling automatically while you trade and analyse the chart. The ticker color (+/- price changes) are based on either the current or completed candle, and the previous candle. Options include: - MTF, eg choose to show price changes o
The Fat and Slim indicator tracks strong and weak money in the market. It is derived from RSI, MFI and many similar indicators. Input values are closing prices and volumes. The RSI (yellow curve) is in the range -100 ... 100. It is additionally multiplied by a coefficient so that the curve is not compressed to the middle values at higher periods (a problem with the classic RSI with different periods). Strong/Fat red curve is RSI weighted by higher volumes. Weak/Slim blue curve is calculated so t
Triple Machine
Thomas Bradley Butler
Build your own model to predict averages of turning points of the Triple Moving Average Oscillator. It is simple.  Rate me with stars. Just load the indicator Triple Moving Average Oscillator in you platform and choose the period.  Scroll through to observe the averages of the highs and lows over a period of time. Add the levels for a buy and a sell on the Triple Machine and this will show the average of highs and lows to look for buys and sell. You can load multiple copies with multiple levels.
Descriptions A point point is a technical analysis indicator, or calculations, used to determine the overall trend of market over different time frames. This indicator calculate the highest or lowest pivots among left x and right y bars and show the high/low level during that period.   From that, you could clearly see the top resistance & bottom support level and how market goes break out. Instructions pivotLeft - pivot left bar count pivotRight - pivot right bar count pivotHighColor - c
TPO Profile MT5
Kyra Nickaline Watson-gordon
Definition : TPO is a Time Price Opportunity. Instead of using bars or candles with an Open, High, Low, and Close price, each "bar" in a Market Profile is represented by horizontal bars against the price It is called Market Profile terminology. In other words time-price-opportunity (TPO) profiles are histograms of how much time was spent at each price within the span of the profile. By using a TPO chart, you are able to analyze the amount of trading activity, based on time, for each price leve
Introduction This indicator detects volume spread patterns for buy and sell opportunity. The patterns include demand and supply patterns. You might use each pattern for trading. However, these patterns are best used to detect the demand zone (=accumulation area) and supply zone (=distribution area). Demand pattern indicates generally potential buying opportunity. Supply pattern indicates generally potential selling opportunity. These are the underlying patterns rather than direct price action. T
Dieses DYJ-Signal ist ein vollständiges Handelssystem, das auf ATR-Spezifikationen basiert. Diese Indikatoren zeichnen den aktuellen Status jedes Krafttrends in jedem Zeitrahmen und in jedem analysierten Währungspaar auf. Durch die Auswertung dieser Daten erstellt das DYJ-Energiesignal eine Liste von Trendintensität und Eingangssignalen. Wenn eines der beiden Paare genau übereinstimmt, wird eine entsprechende Warnung angezeigt. Zu den Listendaten gehören Symbol, M5 MN1, BuTypeContent, SellPerce
Non-lagging VOLATILITY indicator A radical modification of the ATR indicator, which corrected all of its shortcomings (the picture shows the difference with ATR). The indicator shows the swing size of the current market movement. Features: does not have a time window period, i.e. any subjective settings non-delayed, the extremums of the indicator always coincide with the extremum of the price (note the picture) is normalized by means of a color solution, i.e. it has the properties of an oscillat
Hrum
Yvan Musatov
The Hrum indicator was created to neutralize temporary pauses and rollbacks. It analyzes price behavior and, if there is a temporary weakness in the trend, you can notice this from the indicator readings, as in the case of a pronounced change in trend direction. Entering the market is not difficult, but staying in it is much more difficult. With the Giordano Bruno indicator and its unique trend line, staying on trend will become much easier! Every rise and every fall is reflected in your emot
UR HighsAndLows MT5
Krzysztof Jan Debski
UR-Hochs und -Tiefs   UR Highs&Lows führt eine eingehende Analyse der Preisbewegung und ihrer Volatilität durch und erstellt einen Kanal, innerhalb dessen sich der Preis bewegt. Dieser Kanal bewegt sich jetzt als Oszillator und wird mit der Abweichung des Preises überlagert, um potenzielle Erschöpfungen und mögliche Umkehrungen anzuzeigen. Vorteile der Verwendung von UR Highs&Lows: Keine Parameter Sie haben 3 Linien, die die Preisbewegung beschreiben – die weiße Linie, die einen Durchschn
Retracement Pip Catcher MT5
Christopher Graham Parish
!! FLASH SALE !!   Over 80% off !!     For ONE week only. Now only $47 - normally $297! >>>      Ends on 30 June 2023 - Don't miss it! Buy and Sell Arrows when price is about to retrace. It Also Sends Alerts – On MT5 To Your Phone To Your Email Does not repaint. Works ony any pair, any timeframe. 10 Activations allowed so you are free from limitations See an example of alerts from today (23 May 2020) using this and 2 other indicators  here . MT4 Version here . Spreads from 0.1p
Gioteen Volatility Index (GVI) - your ultimate solution to overcoming market unpredictability and maximizing trading opportunities. This revolutionary indicator helps you in lowering your losing trades due to choppy market movements. The GVI is designed to measure market volatility, providing you with valuable insights to identify the most favorable trading prospects. Its intuitive interface consists of a dynamic red line representing the volatility index, accompanied by blue line that indicate
ToolBox 360 is the swiss knife of all indicators. It is full packed with useful tools to help you with your trading. It can be used to find best entry and exit points and help you to decide if you should open a trade or not. It shows market trends, candlestick formations outside / inside bars and you can sett time based allerts. Main features: Time based Fibonacci lines Choose a start and end time and the indicator shows you Fibonacci lines within the selected time range including range high
The 4 headed dragon is an indicator that has two functions. 1) Set the background trend. 2) Mark the predominant trend. By combining these two indicator signals, we will be able to trade for or against the trend, adapting the signals to your reading of the market. You can download the demo and test it yourself. 1) Set the background trend.    Define four possibilities of trend that are the four heads of the dragon, marked by colors on the indicator, marking a) Powerful buying trend. b)
** All Symbols x All Timeframes scan just by pressing scanner button ** *** Contact me after the purchase to send you instructions and add you in "ABCD scanner group" for sharing or seeing experiences with other users. Introduction This indicator scans AB=CD retracement patterns in all charts. The ABCD is the basic foundation for all harmonic patterns and highly repetitive with a high success rate . The ABCD Scanner indicator is a scanner reversal ABCD pattern that helps you identify when the pr
Market Chopper Indicator - is the manual system for market scalping. Indicator uses most accurate points to enter, when current trend has lost it's power and new one starts. Indicator shows : Enter points(buy/sell arrows), Exit points(Stoploss/Takeprofit arrows). Indicator makes market analysis and adapts to any market, any timeframe showing most relevant strategy for exact conditions. Main Indicator's Features Signals are NOT repaint, late or disappear; Every signal comes at the open of new bar
The Rocket Trend indicator is trending. The indicator draws two-color points connected by lines along the chart. This is a trend indicator, it is an algorithmic indicator. It is easy to work and understand when a blue circle appears, you need to buy, when a red one appears, sell. The indicator is used for scalping and pipsing, and has proven itself well. Rocket Trend is available for analyzing the direction of the trend for a specific period of time. Ideal for novice traders learning the laws o
Note: If you want to apply this indicators on indicators which are shown in a sub-window, then consider using this indicator instead:  https://www.mql5.com/en/market/product/109066.&nbsp ; AIntel Predict - Your Gateway to Future Trading Success! Unlock the power of predictive analytics with AIntel Predict. Say goodbye to the guesswork and hello to improved forecasting, as AIntel Predict leverages historical data to unveil the future of your trades like never before. Whether you're a seasoned tra
1. Why did I develop this series of indicators I found that most traders need to use multiple time frame indicators. They usually switch time frame to see indicators. However, once the timeframe is switched, you cannot see the  corresponding relationship  between  the price in the smaller timeframe  and  the indicator in the larger timeframe . For example: if your price chart is in H1 timeframe, you can see H4, D1 and W1 indicators in H1 timeframe Chart. This is more helpful for you to find t
Gapless Moving Average  (GMA) Improved version of standard   Moving Average  (MA) from MetaTrader library which provides the possibility to eliminate the 'gaps' between candle sticks which distort the average values mainly during the N ('period') initial candles after market opens due to the spread ('gap') between closing price from previous day and opening price from the next day. The greater these 'gaps' are, the more divergent the standard MA is in order to indicate the current price trend
Käufer dieses Produkts erwarben auch
Atomic Analyst MT5
Issam Kassas
4.79 (19)
Zunächst einmal ist es erwähnenswert, dass dieser Handelsindikator nicht neu malt, nicht neu zeichnet und keine Verzögerung aufweist, was ihn sowohl für manuellen als auch für Roboterhandel ideal macht. Benutzerhandbuch: Einstellungen, Eingaben und Strategie. Der Atom-Analyst ist ein PA-Preisaktionsindikator, der die Stärke und das Momentum des Preises nutzt, um einen besseren Vorteil auf dem Markt zu finden. Ausgestattet mit fortschrittlichen Filtern, die helfen, Rauschen und falsche Signale z
Atbot
Zaha Feiz
4.96 (28)
AtBot: Wie es funktioniert und wie man es benutzt ### Wie es funktioniert Der "AtBot"-Indikator für die MT5-Plattform generiert Kauf- und Verkaufssignale mithilfe einer Kombination von technischen Analysetools. Er integriert den einfachen gleitenden Durchschnitt (SMA), den exponentiellen gleitenden Durchschnitt (EMA) und den Durchschnitt der wahren Reichweite (ATR)-Index, um Handelsmöglichkeiten zu identifizieren. Darüber hinaus kann er Heikin Ashi-Kerzen verwenden, um die Signalgenauigkeit zu
Zunächst einmal ist es wichtig zu betonen, dass dieses Handelssystem ein Nicht-Repainting-, Nicht-Redrawing- und Nicht-Verzögerungsindikator ist, was es sowohl für manuelles als auch für automatisches Trading ideal macht. Online-Kurs, Handbuch und Vorlagen herunterladen. Das "Smart Trend Trading System MT5" ist eine umfassende Handelslösung, die für neue und erfahrene Trader maßgeschneidert ist. Es kombiniert über 10 Premium-Indikatoren und bietet mehr als 7 robuste Handelsstrategien, was es zu
Gold Stuff mt5
Vasiliy Strukov
4.9 (185)
Gold Stuff mt5-Ein Trendindikator, der speziell für Gold entwickelt wurde, kann auch auf allen Finanzinstrumenten verwendet werden. Der Indikator wird nicht neu gezeichnet und verzögert sich nicht. Empfohlener Zeitrahmen H1. WICHTIG! Kontaktieren Sie mich sofort nach dem Kauf, um Anweisungen und Bonus zu erhalten!     Sie können eine kostenlose Kopie unseres Strong Support- und Trendscanner-Indikators erhalten, bitte senden Sie uns eine persönliche Nachricht. Mich! DATEN Draw Arrow - in
TPSproTREND PrO MT5
Roman Podpora
4.89 (9)
TPSpro TREND PRO   ist ein Trendindikator, der den Markt automatisch analysiert und Informationen über den Trend und jede seiner Änderungen liefert sowie Signale für den Einstieg in Geschäfte ohne Neuzeichnung gibt! Der Indikator verwendet jede Kerze und analysiert sie separat. bezieht sich auf verschiedene Impulse – Aufwärts- oder Abwärtsimpuls. Exakte Einstiegspunkte in Transaktionen für Währungen, Krypto, Metalle, Aktien, Indizes! Version MT5                   VOLLSTÄNDIGE BESCHREIBUNG DES I
TPSpro RFI Levels MT5
Roman Podpora
4.67 (9)
Umkehr der ersten Impulsniveaus (RFI)       ANWEISUNGEN       Russland       -        ENG    Die Empfehlung basiert auf dem Indikator -   TPSpro   TREND PRO -   Version MT5 Die wichtigsten Elemente in der Branche sind entweder in Zonen oder in der Fabrik enthalten, oder sie führen zu einer Lösung bei einem Kauf oder dem Verkauf eines anderen Instruments. Wenn viele Menschen ihre Rechte nicht auf dem Händlerkonto verschlüsseln, werden die Folgen nicht schnell genug sein. Ich habe es damit abgesch
Dies ist ein Indikator für MT5, der genaue Signale für den Einstieg in einen Handel ohne Repainting (Neuzeichnen) liefert. Er kann auf alle Finanzwerte angewendet werden: Forex, Kryptowährungen, Metalle, Aktien, Indizes. Er liefert ziemlich genaue Schätzungen und sagt Ihnen, wann es am besten ist, eine Position zu eröffnen und zu schließen. Sehen Sie sich das Video (6:22) mit einem Beispiel für die Verarbeitung nur eines Signals an, das sich für den Indikator gelohnt hat! Die meisten Händler ver
Zunächst einmal ist es wichtig zu betonen, dass dieses Handelstool ein Nicht-Repaint-, Nicht-Redraw- und Nicht-Verzögerungsindikator ist, was es ideal für professionelles Trading macht. Online-Kurs, Benutzerhandbuch und Demo. Der Smart Price Action Concepts Indikator ist ein sehr leistungsstarkes Werkzeug sowohl für neue als auch erfahrene Händler. Er vereint mehr als 20 nützliche Indikatoren in einem und kombiniert fortgeschrittene Handelsideen wie die Analyse des Inner Circle Traders und S
Quantum Trend Sniper
Bogdan Ion Puscasu
4.92 (48)
Wir stellen vor       Quantum Trend Sniper Indicator   , der bahnbrechende MQL5-Indikator, der die Art und Weise, wie Sie Trendumkehrungen erkennen und handeln, verändert! Entwickelt von einem Team erfahrener Händler mit über 13 Jahren Handelserfahrung,       Quantum Trend Sniper-Indikator       wurde entwickelt, um Ihre Trading-Reise mit seiner innovativen Methode zur Identifizierung von Trendumkehrungen mit extrem hoher Genauigkeit auf ein neues Niveau zu heben. ***Kaufe Quantum Trend Snipe
Trend Screener Pro MT5
STE S.S.COMPANY
4.88 (67)
Nutzen Sie die Macht des Trendhandels mit Trend Screener Indicator: Ihrer ultimativen Trendhandelslösung, die auf Fuzzy-Logik und einem System mit mehreren Währungen basiert! Steigern Sie Ihren Trendhandel mit Trend Screener, dem revolutionären Trendindikator mit Fuzzy-Logik. Es handelt sich um einen leistungsstarken Trendfolgeindikator, der über 13 Premium-Tools und -Funktionen sowie 3 Handelsstrategien kombiniert und ihn zu einer vielseitigen Wahl macht, um Ihren Metatrader in einen Trendanaly
FX Power MT5 NG
Daniel Stein
5 (6)
Erhalten Sie Ihr tägliches Marktupdate mit Details und Screenshots über unser Morning Briefing hier auf mql5 und auf Telegram ! FX Power MT5 NG ist die nächste Generation unseres langjährig sehr beliebten Währungsstärkemessers FX Power. Und was bietet dieser Stärkezähler der nächsten Generation? Alles, was Sie am ursprünglichen FX Power geliebt haben PLUS GOLD/XAU-Stärkeanalyse Noch präzisere Berechnungsergebnisse Individuell konfigurierbare Analysezeiträume Anpassbares Berechnungslimit für noc
FX Volume MT5
Daniel Stein
4.94 (17)
Erhalten Sie Ihr tägliches Marktupdate mit Details und Screenshots über unser Morning Briefing hier auf mql5 und auf Telegram ! FX Volume ist der ERSTE und EINZIGE Volumenindikator, der einen ECHTEN Einblick in die Marktstimmung aus Sicht eines Brokers bietet. Es bietet fantastische Einblicke in die Positionierung von institutionellen Marktteilnehmern, wie z.B. Brokern, auf dem Forex-Markt, viel schneller als COT-Berichte. Diese Informationen direkt auf Ihrem Chart zu sehen, ist der wahre Game
IX Power MT5
Daniel Stein
4.17 (6)
IX Power   bringt die unschlagbare Präzision von FX Power endlich auch zu Nicht-Forex-Symbolen. Es bestimmt präzise die Intensität von kurz-, mittel- und langfristigen Trends in Ihren Lieblingsindizes, Aktien, Rohstoffen, ETFs und sogar Kryptowährungen. Sie können   alles analysieren, was   Ihr Terminal zu bieten hat. Probieren Sie es aus und erleben Sie, wie   sich Ihr Timing   beim Handel   deutlich verbessert . IX Power Hauptmerkmale 100% präzise, nicht nachpinselnde Berechnungsergebni
XQ Indicator MetaTrader 5
Marzena Maria Szmit
3.5 (2)
Step into the realm of Forex trading with confidence and precision using XQ, a cutting-edge Forex indicator designed to elevate your trading game to unprecedented heights. Whether you're a seasoned trader or just stepping into the world of currency exchange, XQ Forex Indicator empowers you with the insights and signals needed to make informed trading decisions. The signal conditions are a combination of three indicators, and XQ Forex Indicator only display  medium and long-term trends . The ind
Easy By Sell is a market indicator for opening and closing positions. It becomes easy to track market entries with alerts. It indicates trend reversal points when a price reaches extreme values ​​and the most favorable time to enter the market. it is as effective as a Fibonacci to find a level but it uses different tools such as an algorithm based on ATR indicators and Stochastic Oscillator. You can modify these two parameters as you wish to adapt the settings to the desired period. My othe
Dieses Dashboard zeigt die   neuesten verfügbaren harmonischen   Muster für die ausgewählten Symbole, so dass Sie Zeit sparen und effizienter sein werden /   MT4-Version . Kostenloser Indikator:   Basic Harmonic Pattern Spalten des Indikators Symbol:   die ausgewählten Symbole werden angezeigt Trend:   bullish oder bearish Pattern :   Art des Musters (Gartley, Schmetterling, Fledermaus, Krabbe, Hai, Cypher oder ABCD) Entry :   Einstiegskurs SL:   Stop-Loss-Kurs TP1:   1. Take-Profit-Kurs
TrendMaestro5
Stefano Frisetti
note: this indicator is for METATRADER4, if you want the version for METATRADER5 this is the link:  https://www.mql5.com/it/market/product/108106 TRENDMAESTRO ver 2.4 TRENDMAESTRO recognizes a new TREND in the bud, he never makes mistakes. The certainty of identifying a new TREND is priceless. DESCRIPTION TRENDMAESTRO identifies a new TREND in the bud, this indicator examines the volatility, volumes and momentum to identify the moment in which there is an explosion of one or more of these data a
Golden Spikes Premium
Kwaku Bondzie Ghartey
Golden Spikes Detector Overview: The Golden Spikes Premium is a groundbreaking trading indicator meticulously crafted for the Boom and Crash indices on the Deriv market. Tailored to meet the needs of discerning traders, this powerful tool operates exclusively on the one-minute timeframe, providing timely and precise signals to maximize your trading potential. The Golden Spikes Detector stands out in its ability to deliver accurate signals, ensuring that you capitalize on market opportunities wit
Gartley Hunter Multi
Siarhei Vashchylka
5 (8)
Gartley Hunter Multi - An indicator for searching for harmonic patterns simultaneously on dozens of trading instruments and on all possible timeframes. Manual (Be sure to read before purchasing) | Version for MT4 Advantages 1. Patterns: Gartley, Butterfly, Shark, Crab. Bat, Alternate Bat, Deep Crab, Cypher 2. Simultaneous search for patterns on dozens of trading instruments and on all possible timeframes 3. Search for patterns of all possible sizes. From the smallest to the largest 4. A
Sind Sie es leid, Unterstützungs- und Widerstandslinien zu zeichnen? Der Unterstützungswiderstand ist ein Multi-Zeitrahmen-Indikator, der Unterstützungs- und Widerstandslinien mit einer sehr interessanten Wendung automatisch erkennt und zeichnet: Wenn das Preisniveau im Laufe der Zeit getestet wird und seine Bedeutung zunimmt, werden die Linien dicker und dunkler. [ Installationsanleitung | Update-Anleitung | Fehlerbehebung | FAQ | Alle Produkte ] Steigern Sie Ihre technische Analyse über Nacht
Matrix Arrow Indicator MT5
Juvenille Emperor Limited
5 (14)
Matrix Arrow Indicator MT5   ist ein einzigartiger 10-in-1-Trend, der zu   100 % nicht neu gezeichnet   werden kann. Multi-Timeframe-Indikator, der für alle Symbole/Instrumente verwendet werden kann:   Forex ,   Rohstoffe ,   Kryptowährungen ,   Indizes ,   Aktien .  Der  Matrix Arrow Indicator MT5  wird den aktuellen Trend in seinen frühen Stadien bestimmen und Informationen und Daten von bis zu 10 Standardindikatoren sammeln, die sind: Durchschnittlicher Richtungsbewegungsindex (ADX) Rohstoff
Volume by Price MT5
Brian Collard
3.6 (5)
The Volumebyprice.com Indicator for MetaTrader 5 features Volume Profile and Market Profile TPO (Time Price Opportunity). Volume and TPO histogram bar and line charts. Volume Footprint charts. TPO letter and block marker collapsed and split structure charts. Static, dynamic and flexible range segmentation and compositing methods with relative and absolute visualizations. Session hours filtering and segment concatenation with Market Watch and custom user specifications. Graphical layering, posit
ICT, SMC, SMART MONEY CONCEPTS, SMART MONEY, Smart Money Concept, Support and Resistance, Trend Analysis, Price Action, Market Structure, Order Blocks, BOS/CHoCH,   Breaker Blocks ,  Momentum Shift,   Supply&Demand Zone/Order Blocks , Strong Imbalance,   HH/LL/HL/LH,    Fair Value Gap, FVG,  Premium  &   Discount   Zones, Fibonacci Retracement, OTE, Buy Side Liquidity, Sell Side Liquidity, BSL/SSL Taken, Equal Highs & Lows, MTF Dashboard, Multiple Time Frame, BigBar, HTF OB, HTF Market Structure
Das Volatility Trend System ist ein Handelssystem, das Signale für Einstiege liefert. Das Volatilitätssystem liefert lineare und punktuelle Signale in Richtung des Trends sowie Signale zum Verlassen des Trends, ohne Neuzeichnung oder Verzögerungen. Der Trendindikator überwacht die Richtung des mittelfristigen Trends, zeigt die Richtung und deren Änderung an. Der Signalindikator basiert auf Änderungen der Volatilität und zeigt Markteintritte an. Der Indikator ist mit mehreren Arten von Warn
Blahtech Supply Demand MT5
Blahtech Limited
4.54 (13)
Was: $299  Now: $99   Supply Demand uses previous price action to identify potential imbalances between buyers and sellers. The key is to identify the better odds zones, not just the untouched ones. Blahtech Supply Demand indicator delivers functionality previously unavailable on any trading platform. This 4-in-1 indicator not only highlights the higher probability zones using a multi-criteria strength engine, but also combines it with multi-timeframe trend analysis, previously confirmed swings
Gold TMAF MTF - dies ist ein bester technischer Indikator für Aktien. Der Algorithmus des Indikators analysiert die Preisbewegung eines Vermögenswertes und spiegelt die Volatilität und potenzielle Einstiegszonen wider. Die besten Indikatorsignale: - Für VERKAUF = rote obere Begrenzung von TMA2 über der roten oberen Begrenzung von TMA1 + roter Fraktalindikator oben + gelber SR-Signalpfeil in die gleiche Richtung. - Für KAUFEN = blaue untere Grenze von TMA2 unterhalb der blauen unteren Gr
Automated Trendlines MT5
Georgios Kalomoiropoulos
Trendlinien sind das wichtigste Werkzeug der technischen Analyse im Devisenhandel. Leider zeichnen die meisten Händler sie nicht richtig. Der automatische Trendlinien-Indikator ist ein professionelles Tool für ernsthafte Trader, das Ihnen hilft, die Trendbewegung der Märkte zu visualisieren. Es gibt zwei Arten von Trendlinien Bullische Trendlinien und Bärische Trendlinien. Im Aufwärtstrend wird die Forex-Trendlinie durch die niedrigsten Swing-Punkte der Preisbewegung gezogen. Wenn man m
Der Forex TPA Indikator deckt die wahren Aktionen der Marktmacher auf, immer dann wenn sie passieren. "Kämpfe nicht gegen die Marktmacher an, sondern folge ihnen", ist wohl der beste Rat, den ein Trader bekommen kann. Der TPA Indikator zeigt jedesmal seine Signale an wenn die Bullen definitiv stärker sind als die Bären und umgekehrt. Dieser Indikator wurde VON Tradern FÜR Trader gemacht und ist 100% NICHT NACHZEICHNEND! Signale werden STRENG am Schluss einer Kerze  generiert. Das sagen unsere Ku
** All Symbols x All Timeframes scan just by pressing scanner button ** ***Contact me after purchase to send you instructions and add you in "123 scanner group" for sharing or seeing experiences with other users. After 17 years of experience in the markets and programming, Winner indicator is ready. I would like to share with you! Introduction The 123 Pattern Scanner indicator with a special enhanced algorithm is a very repetitive common pattern finder with a high success rate . Interestingly,
Auto Order Block with break of structure based on ICT and Smart Money Concepts (SMC) Futures Break of Structure ( BoS )             Order block ( OB )            Higher time frame Order block / Point of Interest ( POI )    shown on current chart           Fair value Gap ( FVG ) / Imbalance   -  MTF      ( Multi Time Frame )    HH/LL/HL/LH  -  MTF      ( Multi Time Frame )  Choch  MTF      ( Multi Time Frame )  Volume Imbalance     ,  MTF          vIMB Gap’s Power of 3 Equal High
Weitere Produkte dieses Autors
Der Follow Line Indikator ist ein unverzichtbares Werkzeug für Trader, die Markttrends präzise erkennen und verfolgen möchten. Dieser Indikator passt sich dynamisch an Preisänderungen an und zeichnet eine Linie, die die Preisbewegungen flüssig und kontinuierlich nachverfolgt. Dank seiner visuellen Einfachheit und Effektivität bei der Signalisierung von Trendwechseln ist Follow Line eine hervorragende Ergänzung zu jeder Handelsstrategie. Hauptmerkmale: Trendverfolgung: Follow Line folgt eng dem P
Verbessere Deine Handelsstrategien mit dem "Order Block" Indikator für MT4 Entdecke den "Order Block" Indikator: Der "Order Block" Indikator für MT4 ist darauf ausgelegt, Orderblöcke im Markt präzise zu identifizieren, indem er die Hochs und Tiefs der Orderblock-Kerzen markiert. Dieses leistungsstarke Tool ermöglicht es dir, zu verstehen, wo große Institutionen ihre Aufträge platzieren und so deine Fähigkeit zur Vorhersage von Marktbewegungen zu verbessern. Hauptmerkmale: Präzise Orderblock-Erke
FREE Spread indicator for MetaTrader 4 this indicator includes: -average spread -current spread -minimum spread -maximum spread If you are interested in my products I recommend you visit my page where you can find: Experts Advisors:  https://www.mql5.com/it/market/product/119456?source=Site+Profile indicators:  https://www.mql5.com/it/market/product/120038?source=Site+Profile I hope the spread indicator will be useful to you. https://www.mql5.com/it/users/kappa05
FREE
IMPORTANT: The indicator will remain at the price of $34.90 until the release of the update scheduled for July 16, 2024. The New Price will be $49.90 (taxes excluded) FVG indicator. If you are an SMC trader this indicator will be very useful to you, it automatically identifies the FVGs on the graph distinguishing them into 2 types: bearish FVGs and bullish FVGs (see the photos to understand better). This indicator works on any Timeframe and on any market you want to use it. If you are interested
Volumenprofil-Indikator für MT4 Erhalten Sie einen Trading-Vorteil mit dem "Volumenprofil"-Indikator für MetaTrader 4 (MT4). Dieses fortschrittliche technische Analysetool ermöglicht es Ihnen, Schlüsselunterstützungs- und Widerstandsniveaus basierend auf dem Handelsvolumen präzise zu identifizieren. Visualisieren Sie mühelos Marktbereiche mit hohem Interesse, in denen das Handelsvolumen am höchsten ist, und nutzen Sie diese Informationen, um fundiertere Handelsentscheidungen zu treffen. Hauptmer
Präsentation des "Color Range Indicator" Der "Color Range Indicator" ist ein leistungsstarkes technisches Analysetool, das für die MT4-Plattform entwickelt wurde, ideal für Händler, die einen klaren und unmittelbaren Überblick über die Markttrends wünschen. Dieser Indikator zeichnet eine farbige Linie basierend auf dem aktuellen Trend, was die Interpretation der Preisbewegungen erleichtert. Beschreibung des Indikators: Grüne Linie : Zeigt einen Aufwärtstrend an. Verwenden Sie dieses Signal, um K
Was ist "Automatic BE"? "Automatic BE" ist ein unverzichtbares Tool für jeden manuellen Trader, das entwickelt wurde, um das Risikomanagement erheblich zu verbessern. Dieser fortschrittliche Indikator kann automatisch Ihre Gewinne schützen, indem er den Stop-Loss auf das Break-Even-Niveau anpasst, sobald sich der Markt zu Ihren Gunsten bewegt. Mit "Automatic BE" können Sie weiterhin handeln, in dem Wissen, dass Ihre Gewinne geschützt sind, selbst wenn Sie nicht vor dem Bildschirm sitzen. Warum "
Was ist "Real Time MultiIndicator"? "Real Time MultiIndicator" ist ein fortschrittliches Handelswerkzeug, das entwickelt wurde, um Ihre technische Analyse zu vereinfachen und zu optimieren. Dieser revolutionäre Indikator sammelt Signale aus mehreren Zeitrahmen und technischen Indikatoren und zeigt sie in einer einzigen, klaren und leicht verständlichen Tabelle an. Wenn Sie eine vollständige und detaillierte Marktübersicht wünschen, ohne ständig das Diagramm wechseln oder jeden Indikator manuell
Order Block indicator, highs and lows; the indicator focuses mainly on OBs, on the chart they are represented with a horizontal line on the minimum and maximum of that candle. While for the maximums and minimums only one line is marked (see the images to understand better). The indicator is for MT5, it works on all Timeframes, on any Forex Pair, on any index and on crypto markets. (For any information on the indicator do not hesitate to contact me). Limited time discount (50%) 74.90$ -> 38.60$
Expert Advisor for scalping; This EA was built for monthly profitability. Works on any asset: Forex, Indices, Crypto and Stocks. Perfectly usable in MT5 tester and usable on any TimeFrame. The EA has various inputs available to customize operations: -Lots -Risk% (0 = Fix) -OrderDist (the distance between one order and another, the distance is calculated in points not pips) -TP (in points) -Sl (in points) -TrailingStopTrigger(the trailing stop trigger point in points) -TrailingStop(distance from
Highs, Lows and Bos Indicator for MT5; The indicator works on any type of market and on all TimeFrames. It also works on the MetaTrader5 Tester. the main function of the indicator is to identify the highs and lows by marking them with a point above/below the candle, then with a horizontal line it marks the Bos. It is very simple and intuitive, there are only 2 inputs: -the color of the maximums -the color of the minima For any other information do not hesitate to contact me.
Panel Info Trade For MT5; The indicator has 2 main objects: -An icon chart that you can change Timeframe, zoom, Forex Pair, crypto....the position of the graph can be modified via the (x;y) inputs. The chart is perfectly usable in the MT5 tester. If the graph isn't for you and doesn't help you with anything, you can press the button on the top right to make it smaller. -the second object is a dynamic control panel where you can change plots, place sl and tp, BE, close partial... (if you watch th
Währungsstärke-Index (Currency Strength Index - CSI) Indikator BEVOR SIE DEN INDIKATOR AKTIVIEREN, DENKEN SIE DARAN, "TRUE" EINZUSTELLEN, UM DIE PAARE ANZUZEIGEN Der Währungsstärke-Index (Currency Strength Index - CSI) Indikator ist ein leistungsstarkes Werkzeug, das im Forex-Handel verwendet wird, um die relative Stärke der wichtigsten Währungen zu messen. Dieser Indikator hilft Tradern, die stärksten und schwächsten Währungen zu identifizieren, was es ihnen ermöglicht, fundiertere Handelsents
Im Trading-Bereich ist der Schlüssel zum Erfolg, die richtigen Werkzeuge zur richtigen Zeit zu haben. Unser innovativer Volumenprofil-Indikator wurde mit einem einzigen Ziel entwickelt: Tradern einen beispiellosen Zugang zu wichtigen Marktaktivitätsinformationen zu bieten. Dieses hochmoderne Werkzeug ermöglicht es Ihnen nicht nur zu sehen, wo und wann Volumen gehandelt wird, sondern auch die Markttiefe mit einer nie dagewesenen Klarheit zu verstehen. Hauptmerkmale: Zeitliche Flexibilität: Stelle
Maximiere deine Trading-Chancen mit dem "Auto Trendlines" Indikator Entdecke den "Auto Trendlines" Indikator: "Auto Trendlines" ist das essentielle Werkzeug für jeden technischen Trader. Dieser Indikator zeichnet automatisch Trendlinien und identifiziert Unterstützungs- und Widerstandsniveaus mit chirurgischer Präzision. Ideal für diejenigen, die Marktausbrüche und Umkehrungen nutzen möchten. Hauptmerkmale: Automatisches Zeichnen von Trendlinien: Identifiziert und zeichnet wichtige Trendlinien o
Optimiere deine Handelsentscheidungen mit dem "autoFibo" Indikator Entdecke den "autoFibo" Indikator: "autoFibo" ist das essenzielle Analysewerkzeug für Trader, die Fibonacci-Niveaus voll ausnutzen möchten, ohne manuell zeichnen zu müssen. Dieser Indikator automatisiert den Fibonacci-Retracement-Prozess und bietet sofortigen visuellen Zugang zu wichtigen Unterstützungs- und Widerstandszonen. Hauptmerkmale: Automatisches Fibonacci-Retracement: Zeichnet automatisch Fibonacci-Niveaus, was die Ident
Verbessere deine Trading-Leistung mit dem "Better Volume" Indikator Entdecke den "Better Volume" Indikator: Der "Better Volume" ist das essenzielle Werkzeug zur Analyse des Marktvolumens für Trader, die sich abheben möchten. Es analysiert Tick-Volumen mit beispielloser Genauigkeit und bietet eine fortgeschrittene Gleitende-Durchschnitt-Funktion (PERIOD_MA) sowie anpassbare Kauf- und Verkaufsalarme. Hauptmerkmale: Fortgeschrittene Volumenanalyse: Erkenne Volumenspitzen, die wichtige Preisbewegung
Der SuperTrend ist einer der effektivsten und am weitesten verbreiteten technischen Indikatoren im Trading, ideal zur Identifizierung der Trendrichtung und zur Generierung von Ein- und Ausstiegssignalen. Basierend auf Volatilität und Trend passt sich dieser Indikator dynamisch den Marktbedingungen an und bietet Händlern eine klare visuelle Orientierung. Hauptmerkmale: Trend-Erkennung: Der SuperTrend folgt dem Markttrend und zeichnet eine Linie, die bei einem Abwärtstrend über dem Preis und bei e
Neues Kombi-Indikator - 3 in 1 Suchen Sie nach Trading-Tools, die Ihre Marktanalyse und Anlagestrategien verbessern können? Wir haben drei unserer besten Indikatoren zu einer leistungsstarken und praktischen Lösung kombiniert, mit der Sie das Beste aus Ihrem Handel herausholen können. 1. Orderblock-Indikator (ehemals für 32,90$ verkauft) Der Orderblock-Indikator ist ein wesentliches Werkzeug zur Identifizierung von Bereichen von institutionellem Interesse im Markt. Dieser Indikator markiert die
Was ist der "Schaff RSX"? Der "Schaff RSX" kombiniert die Effizienz des Relative Strength Index (RSX) mit der Präzision des Schaff-Zyklus und schafft so einen einzigartigen Indikator, der Ihnen hilft, die besten Zeitpunkte für den Ein- und Ausstieg in den Markt mühelos zu identifizieren. Es ist, als hätten Sie ein Radar, das versteckte Handelsmöglichkeiten erkennt und Ihnen einen Wettbewerbsvorteil verschafft, den andere Trader einfach nicht ignorieren können. Warum den "Schaff RSX" wählen? Klar
Was ist "Automatic BE"? "Automatic BE" ist ein unverzichtbares Tool für jeden manuellen Trader, das entwickelt wurde, um das Risikomanagement erheblich zu verbessern. Dieser fortschrittliche Indikator kann automatisch Ihre Gewinne schützen, indem er den Stop-Loss auf das Break-Even-Niveau anpasst, sobald sich der Markt zu Ihren Gunsten bewegt. Mit "Automatic BE" können Sie weiterhin handeln, in dem Wissen, dass Ihre Gewinne geschützt sind, selbst wenn Sie nicht vor dem Bildschirm sitzen. Warum "
Auswahl:
Keine Bewertungen
Antwort auf eine Rezension