• Panoramica
  • Recensioni
  • Commenti

FVG for MT5

Indicator "Fair Value Gap" (FVG) - Scopri il Potere delle Aree di Sbilanciamento nel Mercato

Il mondo del trading è pieno di opportunità nascoste, ma solo chi ha gli strumenti giusti può identificarle e sfruttarle al meglio. Il nostro Indicatore FVG è stato progettato per aiutarti a fare proprio questo. Se sei un trader che cerca di migliorare la sua capacità di leggere il mercato e di trovare i migliori punti di ingresso e uscita, l'Indicatore FVG è l'alleato perfetto per te.

Cos'è un Fair Value Gap (FVG)?

Il concetto di Fair Value Gap si riferisce a una discrepanza tra domanda e offerta che crea un "gap" o una lacuna nel grafico dei prezzi. Questo gap rappresenta un'area in cui il prezzo potrebbe ritornare per colmare quella discrepanza, rendendo queste zone potenzialmente preziose per le opportunità di trading. Questi gap sono creati durante movimenti di prezzo rapidi e possono essere una chiave importante per comprendere il futuro comportamento del mercato.

Perché l'Indicatore FVG è Essenziale?

L'Indicatore FVG ti permette di individuare facilmente queste aree di squilibrio sul grafico, evidenziando i punti in cui il prezzo potrebbe tornare per riempire il gap. Questa informazione è cruciale per qualsiasi strategia di trading, poiché offre ai trader la possibilità di identificare i livelli di prezzo significativi dove potrebbero verificarsi ritracciamenti o accelerazioni.

Caratteristiche Principali dell'Indicatore FVG

  • Identificazione Automatica dei Gap: L'Indicatore FVG analizza automaticamente il grafico per individuare le aree di Fair Value Gap, risparmiandoti tempo e riducendo la possibilità di errori umani.
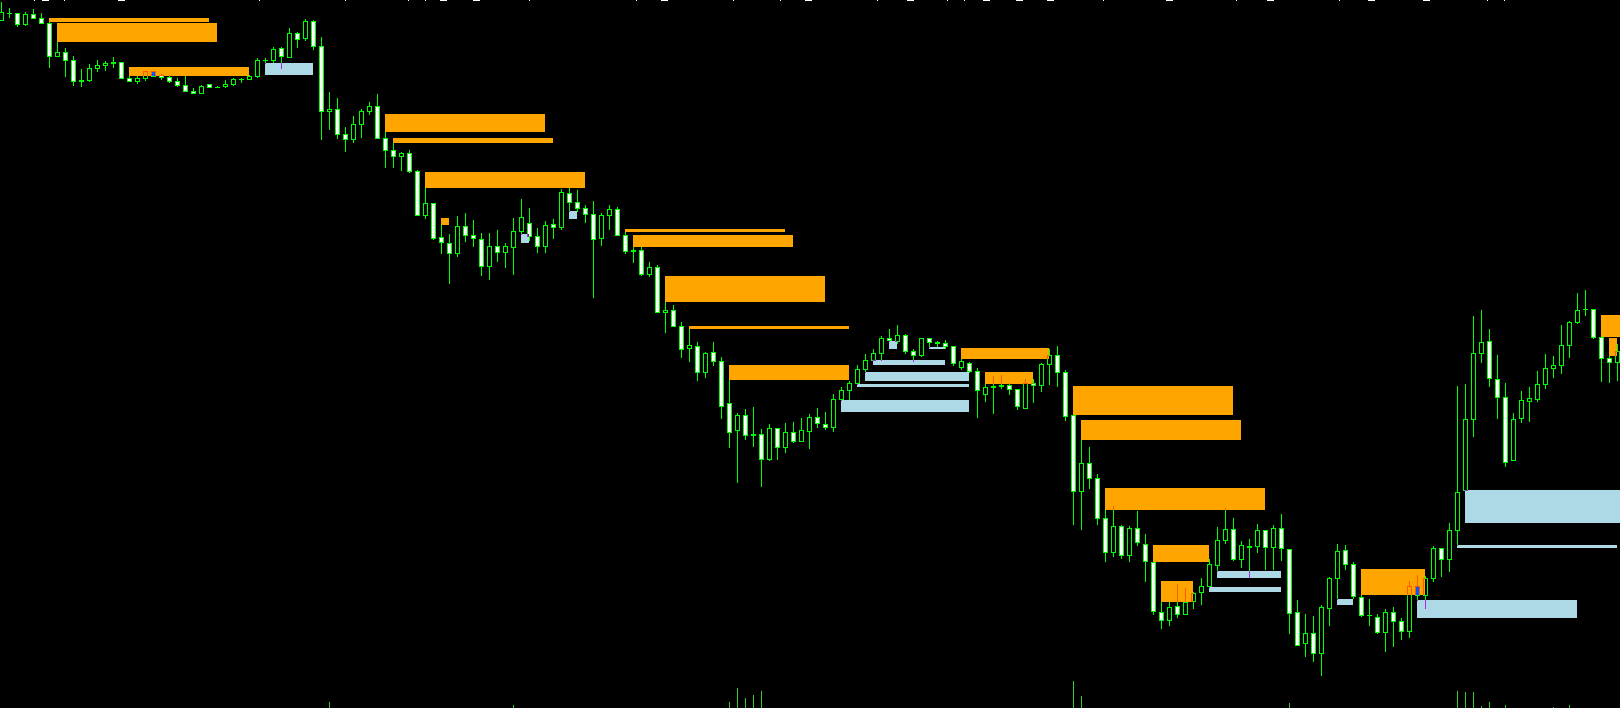
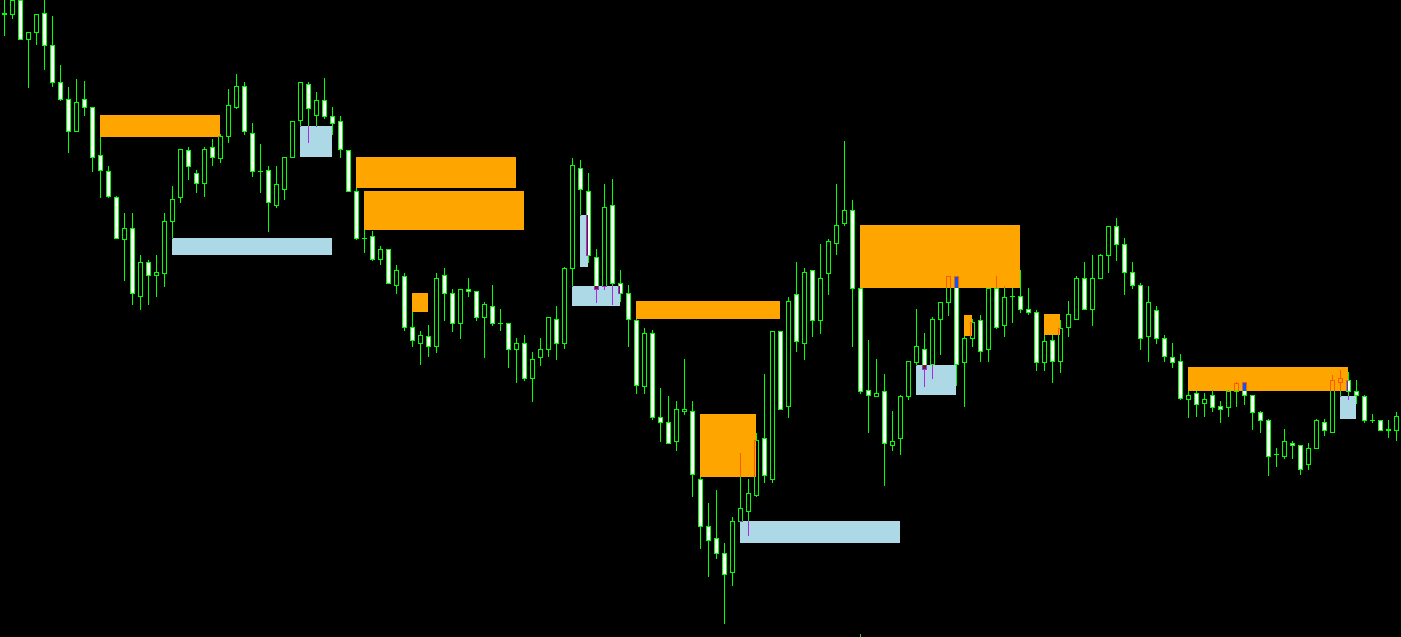
  • Segnalazioni Visive Chiare: Le aree di gap vengono chiaramente visualizzate sul grafico con marcatori distinti, permettendoti di vedere immediatamente dove si trovano le opportunità di trading potenziali.
  • Personalizzazione Completa: Puoi configurare l'indicatore in base alle tue esigenze specifiche, modificando i parametri per adattarsi alla tua strategia di trading. Che tu preferisca operare su timeframe brevi o lunghi, l'Indicatore FVG si adatta alle tue necessità.
  • Adatto a Tutti i Trader: Sia che tu sia un principiante che un professionista, l'Indicatore FVG è facile da usare e può essere integrato in qualsiasi stile di trading.
  • Compatibilità Cross-Piattaforma: L'Indicatore FVG è compatibile con diverse piattaforme di trading, permettendoti di usarlo su più strumenti e mercati.

Come Usare l'Indicatore FVG nella Tua Strategia di Trading?

  1. Installazione: Aggiungi l'Indicatore FVG al grafico dello strumento finanziario di tua scelta.
  2. Configurazione: Imposta i parametri dell'indicatore secondo le tue preferenze. Puoi regolare la sensibilità del gap e altri criteri per affinare i segnali.
  3. Analisi: Osserva il grafico e nota dove l'Indicatore FVG ha identificato delle aree di gap. Questi sono i punti chiave dove potresti voler concentrare la tua attenzione.
  4. Decisione: Utilizza le informazioni fornite dall'indicatore per decidere quando entrare o uscire dal mercato. L'Indicatore FVG non solo ti aiuta a trovare le migliori opportunità, ma può anche essere utilizzato per gestire il rischio, identificando potenziali zone di ritracciamento.

Vantaggi dell'Indicatore FVG

  • Precisione Migliorata: Con l'Indicatore FVG, avrai una visione più chiara di dove il mercato potrebbe dirigersi, migliorando la tua capacità di prevedere movimenti futuri.
  • Riduzione del Rischio: Identificando le aree di squilibrio, puoi evitare di entrare in trade in momenti sbagliati e migliorare la gestione del rischio.
  • Opportunità Aumentate: Rilevando i gap, avrai accesso a più opportunità di trading, potendo scegliere con maggiore sicurezza i migliori punti di ingresso e uscita.


Prodotti consigliati
This indicator is a perfect wave automatic analysis indicator for practical trading! 黄金实战 案例... The standardized definition of the band is no longer a wave of different people, and the art of man-made interference is eliminated, which plays a key role in strict analysis of the approach.=》Increase the choice of international style mode, (red fall green rise style) The  purchase discount is currently in progress! Index content: 1.Basic wave: First, we found the inflection point of the ba
1. Why did I develop this series of indicators I found that most traders need to use multiple time frame indicators. They usually switch time frame to see indicators. However, once the timeframe is switched, you cannot see the  corresponding relationship  between  the price in the smaller timeframe  and  the indicator in the larger timeframe . For example: if your price chart is in H1 timeframe, you can see H4, D1 and W1 indicators in H1 timeframe Chart. This is more helpful for you to find t
The Beta index, also known as the Beta indicator, is one of the key reference indicators for hedging institutions. It allows you to measure the relative risk of individual assets, such as currencies and commodities, in comparison to market portfolios, cross-currency pairs, the U.S. dollar index, and stock indices. By understanding how your assets perform in relation to market benchmarks, you will have a clearer understanding of your investment risk. Key Features: Accurate Risk Assessment: The Be
Plucking Machine I   Plucking Machine I is a trend indicator designed specifically for gold and can also be used on any financial instrument. The indicator does not redraw and does not lag. Recommended time frame H1. The current setting is applicable for all time periods. It shows the current direction of the market based on price movements. Corresponding products of indicators:  https://www.mql5.com/zh/market/product/61388?source=Site+Market+Product+Page#description
To get access to MT4 version please click   here . This is the exact conversion from TradingView: QQE MT4 Glaz-modified by JustUncleL This is a light-load processing and non-repaint indicator. All input options are available. This is not a multi time frame indicator. Buffers are available for processing in EAs. You can message in private chat for further changes you need.
RSIScalperPro
PATRICK WENNING
Introducing RSIScalperPro - the revolutionary RSI-based indicator for Metatrader 5, specifically designed for scalping in the one-minute chart. With RSIScalperPro, you'll have a powerful toolkit for precise entry and exit signals to take your trading to the next level. RSIScalperPro utilizes two different RSI indicators that provide clear signals for overbought and oversold areas. You can customize the time periods and limit values of the two RSIs according to your preferences to achieve the be
- This is an implementation of OCC ==> open close cross - This indicator applies twelve different averaging methods to open and close prices separately to signal the trend switching. - All MA methods are set as input as well as period and different offsets applied to linear regression and ALMA averaging. - Buffers 16 and 17 can be used in EAs to detect trend direction. - You can message in private chat for further changes you need.
MP Heatmap for MT5
Pierre Ksachikian
4 (2)
A heatmap is a graphical representation of data in two dimensions, using colors to display different factors. Heatmaps are a helpful visual aid for viewers, enabling the quick dissemination of statistical or data-driven information. The MP Heatmap indicator provides a graphical representation of the relative strengths of major currencies compared to others, organizing data from pairs into color-coded results and producing a clear overview of the entire Forex market. The MP Heatmap indicator dis
FREE
The Quantitative Qualitative Estimation (QQE) indicator is derived from Wilder’s famous Relative Strength Index (RSI). In essence, the QQE is a heavily smoothed RSI. Modification of this version: ( converted from tradingview script by Mihkell00, original from Glaz) So there are Two QQEs. One that is shown on the chart as columns, and the other "hidden" in the background which also has a 50 MA   bollinger band   acting as a zero line. When both of them agree - you get a blue or a red bar.
【Super Scanner】Indicator Introduction : The color of the Super Scanner which is green and climbing up means that the price trend is going up.The color of the Super Scanner is red and going down means that the price trend is going down. It is very simple to use it to judge the market trend! What's even better is that the open parameters of the indicators allow investors to adjust. You can adjust【Super Scanner】according to your needs. Adjust it faster to be closer to short-term market fluctuati
Market Ticker Pro MT5
John Louis Fernando Diamante
The only Market Ticker on the market! Add a professional novelty to your workspace, with built in mini-charts A scrolling Market Ticker that displays price changes from all symbols in the Market Watch list. Provides an easy snapshot of symbol prices, and keeps scrolling automatically while you trade and analyse the chart. The ticker color (+/- price changes) are based on either the current or completed candle, and the previous candle. Options include: - MTF, eg choose to show price changes o
The Fat and Slim indicator tracks strong and weak money in the market. It is derived from RSI, MFI and many similar indicators. Input values are closing prices and volumes. The RSI (yellow curve) is in the range -100 ... 100. It is additionally multiplied by a coefficient so that the curve is not compressed to the middle values at higher periods (a problem with the classic RSI with different periods). Strong/Fat red curve is RSI weighted by higher volumes. Weak/Slim blue curve is calculated so t
Triple Machine
Thomas Bradley Butler
Build your own model to predict averages of turning points of the Triple Moving Average Oscillator. It is simple.  Rate me with stars. Just load the indicator Triple Moving Average Oscillator in you platform and choose the period.  Scroll through to observe the averages of the highs and lows over a period of time. Add the levels for a buy and a sell on the Triple Machine and this will show the average of highs and lows to look for buys and sell. You can load multiple copies with multiple levels.
Descriptions A point point is a technical analysis indicator, or calculations, used to determine the overall trend of market over different time frames. This indicator calculate the highest or lowest pivots among left x and right y bars and show the high/low level during that period.   From that, you could clearly see the top resistance & bottom support level and how market goes break out. Instructions pivotLeft - pivot left bar count pivotRight - pivot right bar count pivotHighColor - c
TPO Profile MT5
Kyra Nickaline Watson-gordon
Definition : TPO is a Time Price Opportunity. Instead of using bars or candles with an Open, High, Low, and Close price, each "bar" in a Market Profile is represented by horizontal bars against the price It is called Market Profile terminology. In other words time-price-opportunity (TPO) profiles are histograms of how much time was spent at each price within the span of the profile. By using a TPO chart, you are able to analyze the amount of trading activity, based on time, for each price leve
Introduction This indicator detects volume spread patterns for buy and sell opportunity. The patterns include demand and supply patterns. You might use each pattern for trading. However, these patterns are best used to detect the demand zone (=accumulation area) and supply zone (=distribution area). Demand pattern indicates generally potential buying opportunity. Supply pattern indicates generally potential selling opportunity. These are the underlying patterns rather than direct price action. T
Questo segnale DYJ è UN sistema di trading completo basato sulle specifiche tecniche ATR. Tali metriche registrano lo stato corrente di ogni tendenza di forza in ogni coppia di periodi di tempo e valuta analizzata. Il segnale di alimentazione DYJ valuta questi dati per creare in modo professionale una visualizzazione Dell' intensità della tendenza e UN elenco dei segnali del punto di ingresso. Se una delle due coppie corrisponde esattamente a tale condizione, viene visualizzato UN avviso. I dat
Non-lagging VOLATILITY indicator A radical modification of the ATR indicator, which corrected all of its shortcomings (the picture shows the difference with ATR). The indicator shows the swing size of the current market movement. Features: does not have a time window period, i.e. any subjective settings non-delayed, the extremums of the indicator always coincide with the extremum of the price (note the picture) is normalized by means of a color solution, i.e. it has the properties of an oscillat
Hrum
Yvan Musatov
The Hrum indicator was created to neutralize temporary pauses and rollbacks. It analyzes price behavior and, if there is a temporary weakness in the trend, you can notice this from the indicator readings, as in the case of a pronounced change in trend direction. Entering the market is not difficult, but staying in it is much more difficult. With the Giordano Bruno indicator and its unique trend line, staying on trend will become much easier! Every rise and every fall is reflected in your emot
UR HighsAndLows MT5
Krzysztof Jan Debski
UR Massimi e minimi   UR Highs&Lows esegue un'analisi approfondita del movimento del prezzo e della sua volatilità e crea un canale all'interno del quale il prezzo si muove. Quel canale ora si muove come un oscillatore ed è ricoperto dalla deviazione del prezzo per segnalare potenziali esaurimenti e possibili inversioni. Vantaggi dell'utilizzo di UR Highs&Lows: Nessun parametro Hai 3 linee che descrivono il movimento del prezzo: la linea bianca che è una media del prezzo e le linee blu ch
Retracement Pip Catcher MT5
Christopher Graham Parish
!! FLASH SALE !!   Over 80% off !!     For ONE week only. Now only $47 - normally $297! >>>      Ends on 30 June 2023 - Don't miss it! Buy and Sell Arrows when price is about to retrace. It Also Sends Alerts – On MT5 To Your Phone To Your Email Does not repaint. Works ony any pair, any timeframe. 10 Activations allowed so you are free from limitations See an example of alerts from today (23 May 2020) using this and 2 other indicators  here . MT4 Version here . Spreads from 0.1p
Gioteen Volatility Index (GVI) - your ultimate solution to overcoming market unpredictability and maximizing trading opportunities. This revolutionary indicator helps you in lowering your losing trades due to choppy market movements. The GVI is designed to measure market volatility, providing you with valuable insights to identify the most favorable trading prospects. Its intuitive interface consists of a dynamic red line representing the volatility index, accompanied by blue line that indicate
ToolBox 360 is the swiss knife of all indicators. It is full packed with useful tools to help you with your trading. It can be used to find best entry and exit points and help you to decide if you should open a trade or not. It shows market trends, candlestick formations outside / inside bars and you can sett time based allerts. Main features: Time based Fibonacci lines Choose a start and end time and the indicator shows you Fibonacci lines within the selected time range including range high
The 4 headed dragon is an indicator that has two functions. 1) Set the background trend. 2) Mark the predominant trend. By combining these two indicator signals, we will be able to trade for or against the trend, adapting the signals to your reading of the market. You can download the demo and test it yourself. 1) Set the background trend.    Define four possibilities of trend that are the four heads of the dragon, marked by colors on the indicator, marking a) Powerful buying trend. b)
ABCD Pattern Scanner MT5
Reza Aghajanpour
5 (9)
** All Symbols x All Timeframes scan just by pressing scanner button ** *** Contact me after the purchase to send you instructions and add you in "ABCD scanner group" for sharing or seeing experiences with other users. Introduction This indicator scans AB=CD retracement patterns in all charts. The ABCD is the basic foundation for all harmonic patterns and highly repetitive with a high success rate . The ABCD Scanner indicator is a scanner reversal ABCD pattern that helps you identify when the pr
Market Chopper Indicator - is the manual system for market scalping. Indicator uses most accurate points to enter, when current trend has lost it's power and new one starts. Indicator shows : Enter points(buy/sell arrows), Exit points(Stoploss/Takeprofit arrows). Indicator makes market analysis and adapts to any market, any timeframe showing most relevant strategy for exact conditions. Main Indicator's Features Signals are NOT repaint, late or disappear; Every signal comes at the open of new bar
Rocket Trend
Andriy Sydoruk
The Rocket Trend indicator is trending. The indicator draws two-color points connected by lines along the chart. This is a trend indicator, it is an algorithmic indicator. It is easy to work and understand when a blue circle appears, you need to buy, when a red one appears, sell. The indicator is used for scalping and pipsing, and has proven itself well. Rocket Trend is available for analyzing the direction of the trend for a specific period of time. Ideal for novice traders learning the laws o
Note: If you want to apply this indicators on indicators which are shown in a sub-window, then consider using this indicator instead:  https://www.mql5.com/en/market/product/109066.&nbsp ; AIntel Predict - Your Gateway to Future Trading Success! Unlock the power of predictive analytics with AIntel Predict. Say goodbye to the guesswork and hello to improved forecasting, as AIntel Predict leverages historical data to unveil the future of your trades like never before. Whether you're a seasoned tra
1. Why did I develop this series of indicators I found that most traders need to use multiple time frame indicators. They usually switch time frame to see indicators. However, once the timeframe is switched, you cannot see the  corresponding relationship  between  the price in the smaller timeframe  and  the indicator in the larger timeframe . For example: if your price chart is in H1 timeframe, you can see H4, D1 and W1 indicators in H1 timeframe Chart. This is more helpful for you to find t
Gapless Moving Average  (GMA) Improved version of standard   Moving Average  (MA) from MetaTrader library which provides the possibility to eliminate the 'gaps' between candle sticks which distort the average values mainly during the N ('period') initial candles after market opens due to the spread ('gap') between closing price from previous day and opening price from the next day. The greater these 'gaps' are, the more divergent the standard MA is in order to indicate the current price trend
Gli utenti di questo prodotto hanno anche acquistato
Atomic Analyst MT5
Issam Kassas
4.79 (19)
Innanzitutto, vale la pena sottolineare che questo indicatore di trading non è repaint, non è ridisegno e non presenta ritardi, il che lo rende ideale sia per il trading manuale che per quello automatico. Manuale utente: impostazioni, input e strategia. L'Analista Atomico è un indicatore di azione del prezzo PA che utilizza la forza e il momentum del prezzo per trovare un miglior vantaggio sul mercato. Dotato di filtri avanzati che aiutano a rimuovere rumori e segnali falsi, e aumentare il pote
Atbot
Zaha Feiz
4.96 (28)
AtBot:  Come funziona e come usarlo ### Come funziona L'indicatore "AtBot" per la piattaforma MT5 genera segnali di acquisto e vendita utilizzando una combinazione di strumenti di analisi tecnica. Integra la Media Mobile Semplice (SMA), la Media Mobile Esponenziale (EMA) e l'indice di Gamma Vero Medio (ATR) per identificare opportunità di trading. Inoltre, può utilizzare le candele Heikin Ashi per migliorare la precisione dei segnali. Lascia una recensione dopo l'acquisto e ricevi un regalo bon
Innanzitutto è importante sottolineare che questo sistema di trading è un indicatore Non-Repainting, Non-Redrawing e Non-Lagging, il che lo rende ideale sia per il trading manuale che per quello automatico. Corso online, manuale e download di preset. Il "Sistema di Trading Smart Trend MT5" è una soluzione completa pensata sia per i trader principianti che per quelli esperti. Combina oltre 10 indicatori premium e offre più di 7 robuste strategie di trading, rendendolo una scelta versatile per div
Gold Stuff mt5
Vasiliy Strukov
4.9 (185)
Gold Stuff mt5 è un indicatore di tendenza progettato specificamente per l'oro e può essere utilizzato anche su qualsiasi strumento finanziario. L'indicatore non ridisegna e non è in ritardo. Periodo consigliato H1. Contattami subito dopo l'acquisto per avere le impostazioni e un bonus personale!   I risultati in tempo reale possono essere visualizzati qui.  Puoi ottenere una copia gratuita del nostro indicatore Strong Support e Trend Scanner, per favore scrivi in ​​privato. M   IMPOSTAZION
TPSproTREND PrO MT5
Roman Podpora
4.89 (9)
TPSpro TREND PRO   è un indicatore di tendenza che analizza automaticamente il mercato, fornisce informazioni sulla tendenza e sui rispettivi cambiamenti e fornisce segnali per entrare nelle operazioni senza ridisegnare. L'indicatore utilizza ciascuna candela e la analizza separatamente. Si riferisce a vari shock al rialzo o al ribasso. Punto di ingresso preciso per il trading di valute, criptovalute, metalli, azioni e indici! Versione MT5                   Descrizione completa dell'indicatore
TPSpro RFI Levels MT5
Roman Podpora
4.67 (9)
Inverti il primo livello di impulso (RFI)       istruire       Russia       -        ESP   Raccomandazione di utilizzare   l'indicatore -   TPSpro   Trend Edizione Professional -Versione   MT5 La cosa più importante nel comercio son è la cosa più importante in futuro. La cosa più importante è la cosa più importante. Funzioni principali: La maggior parte delle zone sono attivate da venditori e compradores! Indicador mostra tutti i livelli/zone dei primi impulsi corretti per acquisti e vendite. LO
Top indicator for MT5   providing accurate signals to enter a trade without repainting! It can be applied to any financial assets:   forex, cryptocurrencies, metals, stocks, indices .  Watch  the video  (6:22) with an example of processing only one signal that paid off the indicator! MT4 version is here It will provide pretty accurate trading signals and tell you when it's best to open a trade and close it. Most traders improve their trading results during the first trading week with the help of
Innanzitutto, vale la pena sottolineare che questo Strumento di Trading è un Indicatore Non-Ridipingente, Non-Ridisegnante e Non-Laggante, il che lo rende ideale per il trading professionale. Corso online, manuale utente e demo. L'Indicatore Smart Price Action Concepts è uno strumento molto potente sia per i nuovi che per i trader esperti. Racchiude più di 20 utili indicatori in uno solo, combinando idee di trading avanzate come l'Analisi del Trader del Circolo Interno e le Strategie di Trad
Quantum Trend Sniper
Bogdan Ion Puscasu
4.92 (48)
Presentazione       Quantum Trend Sniper Indicator   , l'innovativo indicatore MQL5 che sta trasformando il modo in cui identifichi e scambi le inversioni di tendenza! Sviluppato da un team di trader esperti con un'esperienza di trading di oltre 13 anni,       Indicatore Quantum Trend Sniper       è progettato per spingere il tuo viaggio di trading verso nuove vette con il suo modo innovativo di identificare le inversioni di tendenza con una precisione estremamente elevata. *** Acquista Quant
Trend Screener Pro MT5
STE S.S.COMPANY
4.88 (67)
Indicatore di tendenza, soluzione unica rivoluzionaria per il trading di tendenze e il filtraggio con tutte le importanti funzionalità di tendenza integrate in un unico strumento! È un indicatore multi-timeframe e multi-valuta al 100% non ridipingibile che può essere utilizzato su tutti i simboli/strumenti: forex, materie prime, criptovalute, indici e azioni. Trend Screener è un indicatore di tendenza che segue un indicatore efficiente che fornisce segnali di tendenza a freccia con punti nel gra
FX Power MT5 NG
Daniel Stein
5 (6)
Ricevi il tuo aggiornamento quotidiano sul mercato con dettagli e schermate tramite il nostro Morning Briefing qui su mql5 e su Telegram ! FX Power MT5 NG è la nuova generazione del nostro popolare misuratore di forza delle valute, FX Power. Cosa offre questo misuratore di forza di nuova generazione? Tutto ciò che avete amato dell'FX Power originale IN PIÙ Analisi della forza di ORO/XAU Risultati di calcolo ancora più precisi Periodi di analisi configurabili individualmente Limite di calcolo pe
FX Volume MT5
Daniel Stein
4.94 (17)
Ricevi il tuo aggiornamento quotidiano sul mercato con dettagli e schermate tramite il nostro Morning Briefing qui su mql5 e su Telegram ! FX Volume è il PRIMO e UNICO indicatore di volume che fornisce una visione REALE del sentiment del mercato dal punto di vista del broker. Fornisce informazioni straordinarie su come gli operatori di mercato istituzionali, come i broker, sono posizionati sul mercato Forex, molto più velocemente dei rapporti COT. Vedere queste informazioni direttamente sul vo
IX Power MT5
Daniel Stein
4.17 (6)
IX Power   porta finalmente l'imbattibile precisione di FX Power ai simboli non-Forex. Determina con precisione l'intensità delle tendenze a breve, medio e lungo termine dei vostri indici preferiti, azioni, materie prime, ETF e persino criptovalute. Potete   analizzare tutto ciò che   il vostro terminale ha da offrire. Provatelo e sperimentate come   il vostro tempismo migliori significativamente   durante il trading. Caratteristiche principali di IX Power Risultati di calcolo precisi al
XQ Indicator MetaTrader 5
Marzena Maria Szmit
3.5 (2)
Step into the realm of Forex trading with confidence and precision using XQ, a cutting-edge Forex indicator designed to elevate your trading game to unprecedented heights. Whether you're a seasoned trader or just stepping into the world of currency exchange, XQ Forex Indicator empowers you with the insights and signals needed to make informed trading decisions. The signal conditions are a combination of three indicators, and XQ Forex Indicator only display  medium and long-term trends . The ind
Easy By Sell is a market indicator for opening and closing positions. It becomes easy to track market entries with alerts. It indicates trend reversal points when a price reaches extreme values ​​and the most favorable time to enter the market. it is as effective as a Fibonacci to find a level but it uses different tools such as an algorithm based on ATR indicators and Stochastic Oscillator. You can modify these two parameters as you wish to adapt the settings to the desired period. My othe
Questo cruscotto mostra gli ultimi   pattern armonici   disponibili per i simboli selezionati, in modo da risparmiare tempo ed essere più efficienti /   versione MT4 . Indicatore gratuito:   Basic Harmonic Pattern Colonne dell'indicatore Symbol :   vengono visualizzati i simboli selezionati Trend:   rialzista o ribassista Pattern:   tipo di pattern (gartley, butterfly, bat, crab, shark, cypher o ABCD) Entry:   prezzo di ingresso SL:   prezzo di stop loss TP1:   1 prezzo di take profit TP
TrendMaestro5
Stefano Frisetti
nota: questo indicatore e' per METATRADER5, se vuoi la versione per  METATRADER4 questo e' il link:   https://www.mql5.com/it/market/product/108106 TRENDMAESTRO ver 2.4 TRENDMAESTRO   riconosce un nuovo TREND sul nascere, non sbaglia mai. La sicurezza di identificare un nuovo TREND non ha prezzo. DESCRIZIONE TRENDMAESTRO identifica un nuovo TREND sul nascere, questo indicatore prende in esame la volatilita' i volumi ed il momentum per identificare il momento in cui c'e' un'esplosione di uno
Golden Spikes Premium
Kwaku Bondzie Ghartey
Golden Spikes Detector Overview: The Golden Spikes Premium is a groundbreaking trading indicator meticulously crafted for the Boom and Crash indices on the Deriv market. Tailored to meet the needs of discerning traders, this powerful tool operates exclusively on the one-minute timeframe, providing timely and precise signals to maximize your trading potential. The Golden Spikes Detector stands out in its ability to deliver accurate signals, ensuring that you capitalize on market opportunities wit
Gartley Hunter Multi
Siarhei Vashchylka
5 (8)
Gartley Hunter Multi - An indicator for searching for harmonic patterns simultaneously on dozens of trading instruments and on all possible timeframes. Manual (Be sure to read before purchasing) | Version for MT4 Advantages 1. Patterns: Gartley, Butterfly, Shark, Crab. Bat, Alternate Bat, Deep Crab, Cypher 2. Simultaneous search for patterns on dozens of trading instruments and on all possible timeframes 3. Search for patterns of all possible sizes. From the smallest to the largest 4. A
PZ Support Resistance MT5
PZ TRADING SLU
4.17 (6)
Unlock key market insights with automated support and resistance lines Special Offer: Purchase now to receive free bonuses worth $89! (Read more for details) Tired of plotting support and resistance lines? This is a multi-timeframe indicator that detects and plots supports and resistance lines in the chart with the same precision as a human eye would. As price levels are tested over time and its importance increases, the lines become thicker and darker, making price leves easy to glance and ev
Matrix Arrow Indicator MT5
Juvenille Emperor Limited
5 (14)
Matrix Arrow Indicator MT5   è un trend unico 10 in 1 che segue un indicatore multi-timeframe al   100% non ridipinto   che può essere utilizzato su tutti i simboli/strumenti:   forex ,   materie prime ,   criptovalute ,   indici ,   azioni .  Matrix Arrow Indicator MT5  determinerà la tendenza attuale nelle sue fasi iniziali, raccogliendo informazioni e dati da un massimo di 10 indicatori standard, che sono: Indice di movimento direzionale medio (ADX) Indice del canale delle materie prime (CCI
Volume by Price MT5
Brian Collard
3.6 (5)
The Volumebyprice.com Indicator for MetaTrader 5 features Volume Profile and Market Profile TPO (Time Price Opportunity). Volume and TPO histogram bar and line charts. Volume Footprint charts. TPO letter and block marker collapsed and split structure charts. Static, dynamic and flexible range segmentation and compositing methods with relative and absolute visualizations. Session hours filtering and segment concatenation with Market Watch and custom user specifications. Graphical layering, posit
ICT, SMC, SMART MONEY CONCEPTS, SMART MONEY, Smart Money Concept, Support and Resistance, Trend Analysis, Price Action, Market Structure, Order Blocks, BOS/CHoCH,   Breaker Blocks ,  Momentum Shift,   Supply&Demand Zone/Order Blocks , Strong Imbalance,   HH/LL/HL/LH,    Fair Value Gap, FVG,  Premium  &   Discount   Zones, Fibonacci Retracement, OTE, Buy Side Liquidity, Sell Side Liquidity, BSL/SSL Taken, Equal Highs & Lows, MTF Dashboard, Multiple Time Frame, BigBar, HTF OB, HTF Market Structure
Volatility Trend System - è un sistema di trading che fornisce segnali per le entrate. Il sistema di volatilità fornisce segnali lineari e puntuali nella direzione del trend, nonché segnali per uscirne, senza ridisegnare o ritardi. L'indicatore di tendenza monitora la direzione del trend a medio termine, mostra la direzione e il suo cambiamento. L'indicatore del segnale si basa sui cambiamenti della volatilità e mostra gli ingressi nel mercato. L'indicatore è dotato di diversi tipi di avvi
Blahtech Supply Demand MT5
Blahtech Limited
4.54 (13)
Was: $299  Now: $99   Supply Demand uses previous price action to identify potential imbalances between buyers and sellers. The key is to identify the better odds zones, not just the untouched ones. Blahtech Supply Demand indicator delivers functionality previously unavailable on any trading platform. This 4-in-1 indicator not only highlights the higher probability zones using a multi-criteria strength engine, but also combines it with multi-timeframe trend analysis, previously confirmed swings
Gold TMAF MTF - questo è il miglior indicatore tecnico azionario. L'algoritmo dell'indicatore analizza il movimento del prezzo di un asset e riflette la volatilità e le potenziali zone di ingresso. I migliori segnali dell'indicatore: - Per SELL = limite superiore rosso del TMA2 sopra il limite superiore rosso del TMA1 + indicatore frattale rosso sopra + freccia gialla del segnale SR nella stessa direzione. - Per BUY = limite inferiore blu di TMA2 sotto il limite inferiore blu di TMA1 +
Automated Trendlines MT5
Georgios Kalomoiropoulos
Le linee di tendenza sono lo strumento più essenziale di analisi tecnica nel forex trading. Sfortunatamente, la maggior parte dei trader non li disegna correttamente. L'indicatore automatizzato delle linee di tendenza è uno strumento professionale per i trader seri che ti aiuta a visualizzare il movimento di tendenza dei mercati. Esistono due tipi di linee di tendenza, linee di tendenza rialziste e linee di tendenza ribassiste. Nella tendenza rialzista, la linea di tendenza Forex viene t
TPA True Price Action indicator reveals the true price action of the market makers through 100% non-repainting signals strictly at the close of a candle! TPA shows entries and re-entries, every time the bulls are definitely stronger than the bears and vice versa. Not to confuse with red/green candles. The shift of power gets confirmed at the earliest stage and is ONE exit strategy of several. There are available now two free parts of the TPA User Guide for our customers. The first "The Basics"
** All Symbols x All Timeframes scan just by pressing scanner button ** ***Contact me after purchase to send you instructions and add you in "123 scanner group" for sharing or seeing experiences with other users. After 17 years of experience in the markets and programming, Winner indicator is ready. I would like to share with you! Introduction The 123 Pattern Scanner indicator with a special enhanced algorithm is a very repetitive common pattern finder with a high success rate . Interestingly,
Auto Order Block with break of structure based on ICT and Smart Money Concepts (SMC) Futures Break of Structure ( BoS )             Order block ( OB )            Higher time frame Order block / Point of Interest ( POI )    shown on current chart           Fair value Gap ( FVG ) / Imbalance   -  MTF      ( Multi Time Frame )    HH/LL/HL/LH  -  MTF      ( Multi Time Frame )  Choch  MTF      ( Multi Time Frame )  Volume Imbalance     ,  MTF          vIMB Gap’s Power of 3 Equal High
Altri dall’autore
L'indicatore Follow Line è uno strumento essenziale per i trader che desiderano identificare e seguire le tendenze di mercato con precisione. Questo indicatore si adatta dinamicamente alle variazioni di prezzo, disegnando una linea che traccia il movimento dei prezzi in modo fluido e continuo. Grazie alla sua semplicità visiva e all'efficacia nel segnalare i cambiamenti di tendenza, Follow Line è un'ottima aggiunta alla strategia di qualsiasi trader. Caratteristiche principali: Tracciamento dell
Potenzia le Tue Strategie di Trading con l'Indicatoare "Order Block" per MT4 Scopri l'Indicatatore "Order Block": L'Indicatoare "Order Block" per MT4 è progettato per aiutarti a identificare con precisione i blocchi d'ordine nel mercato, segnalando i massimi e i minimi delle candele dell'order block. Questo potente strumento ti consente di capire dove le grandi istituzioni posizionano i loro ordini, migliorando la tua capacità di prevedere i movimenti del mercato. Caratteristiche Principali: Ril
FREE Spread indicator for MetaTrader 4 this indicator includes: -average spread -current spread -minimum spread -maximum spread If you are interested in my products I recommend you visit my page where you can find: Experts Advisors:  https://www.mql5.com/it/market/product/119456?source=Site+Profile indicators:  https://www.mql5.com/it/market/product/120038?source=Site+Profile I hope the spread indicator will be useful to you. https://www.mql5.com/it/users/kappa05
FREE
IMPORTANTE: L'indicatore rimarrà al prezzo di 34.90$ fino all'uscita dell'update previsto per il 16 luglio 2024. Il Nuovo Prezzo sarà di 49.90$ (tasse escluse) Indicatore di FVG. Sei sei un SMC trader questo indicatore ti sarà molto utile, individua in automatico i FVG a grafico distinguendoli in 2 tipi:FVG ribassisti e FVG rialzisti(guarda le foto per capire meglio). Questo idicatore funziona a qualsiasi Timeframe e su qualsiasi mercato tu lo voglia usare. Se sei interessato a questo indicatore
Indicatore Volume Profile per MT4 Ottieni un vantaggio nel trading con l'indicatore "Volume Profile" per MetaTrader 4 (MT4). Questo strumento avanzato di analisi tecnica ti permette di identificare con precisione i livelli chiave di supporto e resistenza basati sul volume delle transazioni. Visualizza facilmente le aree di maggiore interesse del mercato, dove i volumi di scambio sono più alti, e sfrutta queste informazioni per prendere decisioni di trading più informate. Caratteristiche principa
Il "Color Range Indicator" è un potente strumento di analisi tecnica progettato per la piattaforma MT4, ideale per i trader che desiderano avere una visione chiara e immediata delle tendenze di mercato. Questo indicatore disegna una linea colorata in funzione del trend corrente, facilitando l'interpretazione del movimento dei prezzi. Descrizione dell'indicatore: Linea verde : Indica un trend rialzista. Utilizzare questa segnalazione per considerare opportunità di acquisto. Linea rossa : Indica u
Cos'è "Automatic BE"? "Automatic BE" è uno strumento essenziale per ogni trader che opera manualmente, progettato per migliorare significativamente la gestione del rischio. Questo indicatore avanzato è in grado di proteggere automaticamente i tuoi profitti, regolando lo stop loss al livello di pareggio (break even) una volta che il mercato si muove a tuo favore. Con "Automatic BE", puoi continuare a operare sapendo che i tuoi guadagni saranno protetti, anche se non sei davanti al monitor. Perché
Cos'è "Real Time MultiIndicator"? "Real Time MultiIndicator" è uno strumento di trading avanzato progettato per semplificare e ottimizzare la tua analisi tecnica. Questo indicatore rivoluzionario raccoglie i segnali da più timeframe e più indicatori tecnici, mostrandoli in un'unica tabella chiara e di facile lettura. Se desideri una visione completa e dettagliata del mercato senza dover cambiare continuamente grafico o analizzare manualmente ogni indicatore, "Real Time MultiIndicator" è la soluz
OB Indicator
Nicola Capatti
Indicatore di Order Block, massimi e minimi; l'indicatore si concentra principalmente sugli OB,a grafico sono rappresentati con una linea orizzontale sul minimo e sul massimo di quella candela. Mentre per i massimi e minimi viene segnata solo una linea(guarda le immagini per capire meglio). L'indicatore è per MT5, funziona su tutti i Timeframe, su qualsiasi Coppia Forex, su qualsiasi indice e sui mercati cripto. (Per qualsiasi informazione sull'indicatore non esitate a contattarmi). sconto a tem
Expert Advisor for scalping; This EA was built for monthly profitability. Works on any asset: Forex, Indices, Crypto and Stocks. Perfectly usable in MT5 tester and usable on any TimeFrame. The EA has various inputs available to customize operations: -Lots -Risk% (0 = Fix) -OrderDist (the distance between one order and another, the distance is calculated in points not pips) -TP (in points) -Sl (in points) -TrailingStopTrigger(the trailing stop trigger point in points) -TrailingStop(distance from
Indicatore di massimi, minimi e Bos per MT5; L'indicatore funziona su qualsiasi tipo di mercato e su tutti i TimeFrame. Funziona anche sul Tester di MetaTrader5. la funzione principale dell'indicatore è individuare i massimi e i minimi segnandoli con un punto sopra/sotto la candela, poi con una linea orizzontale va a segnare i Bos. E' molto semplice ed intuitivo, sono presenti solo 2 input: -il colore dei massimi -il colore dei minimi Per qualsiasi altra informazione non esitare a contattarmi.
Panel Info Trade For  MT5; L'indicatore ha 2 oggetti principali: -Un grafico icona a cui puoi cambiare Timeframe, zoomare, Coppia Forex, cripto....la posizione del grafico è modificabile tramite gli input (x;y). Il grafico è perfettamente utilizzabile nel tester di MT5. Se il grafico non fa per te e non ti aiuta in niente, puoi premere il guadrato in altro a destra per rimpicciolirlo. -il secondo oggetto è un pannello di controllo dinamico in cui puoi cambiare ilotti, piazzare sl e tp, BE, close
Indicatore di Forza della Valuta (Currency Strength Index - CSI) PRIMA DI ATTIVARE L'INDICATORE RICORDA DI METTERE "TRUE" PER VISUALIZZARE LE COPPIE L'indicatore di Forza della Valuta (Currency Strength Index - CSI) è uno strumento potente utilizzato nel trading forex per misurare la forza relativa delle principali valute. Questo indicatore aiuta i trader a identificare le valute più forti e più deboli in un dato momento, permettendo di prendere decisioni di trading più informate. Caratteristic
Nel mondo del trading, la chiave per il successo si trova nell'avere gli strumenti giusti al momento giusto. Il nostro innovativo indicatore di Volume Profile è stato sviluppato con un unico obiettivo in mente: fornire ai trader un accesso senza precedenti alle informazioni vitali sulle attività di mercato. Questo strumento all'avanguardia ti permette di vedere non solo dove e quando si scambiano i volumi, ma anche di comprendere la profondità del mercato con una chiarezza mai vista prima. Carat
Massimizza le Tue Opportunità di Trading con l'Indicatore "Auto Trendlines" Scopri l'Indicatore "Auto Trendlines": "Auto Trendlines" è lo strumento essenziale per ogni trader tecnico. Questo indicatore traccia automaticamente le linee di tendenza, identificando i livelli di supporto e resistenza con precisione chirurgica. È ideale per coloro che cercano di capitalizzare sui breakout e sui movimenti di inversione del mercato. Caratteristiche Principali: Tracciamento Automatico delle Linee di Tend
Ottimizza le Tue Decisioni di Trading con l'Indicatore "autoFibo" Scopri l'Indicatore "autoFibo": "autoFibo" è l'indispensabile strumento di analisi per i trader che vogliono sfruttare al massimo i livelli di Fibonacci senza il fastidio di tracciare manualmente. Questo indicatore automatizza il processo di ritracciamento di Fibonacci, offrendo un immediato accesso visivo a supporti e resistenze chiave. Caratteristiche Principali: Ritracciamento Automatico di Fibonacci: Traccia automaticamente i
Migliora le Tue Performance di Trading con l'Indicatore "Better Volume" Scopri l'Indicatore "Better Volume": Il "Better Volume" è l'indispensabile strumento di analisi dei volumi di mercato per i trader che desiderano distinguersi. Analizza i volumi dei tick con una precisione senza precedenti, grazie alla sua funzione avanzata di media mobile (PERIOD_MA) e allerte personalizzabili per buy e sell. Caratteristiche Principali: Analisi Avanzata dei Volumi: Riconosci i picchi di volume che segnalano
Il SuperTrend è uno degli indicatori tecnici più efficaci e utilizzati nel trading, ideale per identificare la direzione della tendenza e generare segnali di ingresso e uscita dal mercato. Basato su volatilità e trend, questo indicatore si adatta dinamicamente alle condizioni di mercato, offrendo un riferimento visivo chiaro per i trader. Caratteristiche Principali: Rilevazione della Tendenza: Il SuperTrend segue il trend di mercato, disegnando una linea che si posiziona al di sopra del prezzo i
Nuovo Indicatore Combinato - 3 in 1 Sei alla ricerca di strumenti di trading che possano migliorare la tua analisi di mercato e le tue strategie di investimento? Abbiamo unito tre dei nostri migliori indicatori in un'unica soluzione potente e conveniente, permettendoti di ottenere il massimo valore per il tuo trading. 1. Order Block Indicator (precedentemente venduto a 32,90$) L'Order Block Indicator è uno strumento essenziale per identificare le aree di forte interesse istituzionale all'interno
Cos'è il "Schaff RSX"? Il "Schaff RSX" combina l'efficacia dell'Indice di Forza Relativa (RSX) con la precisione del Ciclo Schaff, creando un indicatore unico che ti aiuterà a identificare con facilità i migliori momenti per entrare e uscire dal mercato. È come avere un radar che rileva opportunità di trading nascoste, dandoti un vantaggio competitivo che altri trader semplicemente non possono permettersi di ignorare. Perché Scegliere il "Schaff RSX"? Semplicità Visiva Intuitiva : I colori e le
Cos'è "Automatic BE"? "Automatic BE" è uno strumento essenziale per ogni trader che opera manualmente, progettato per migliorare significativamente la gestione del rischio. Questo indicatore avanzato è in grado di proteggere automaticamente i tuoi profitti, regolando lo stop loss al livello di pareggio (break even) una volta che il mercato si muove a tuo favore. Con "Automatic BE", puoi continuare a operare sapendo che i tuoi guadagni saranno protetti, anche se non sei davanti al monitor. Perché
Filtro:
Nessuna recensione
Rispondi alla recensione