• Aperçu
  • Avis
  • Commentaires

MultiSymbol and TF Chart Integrated

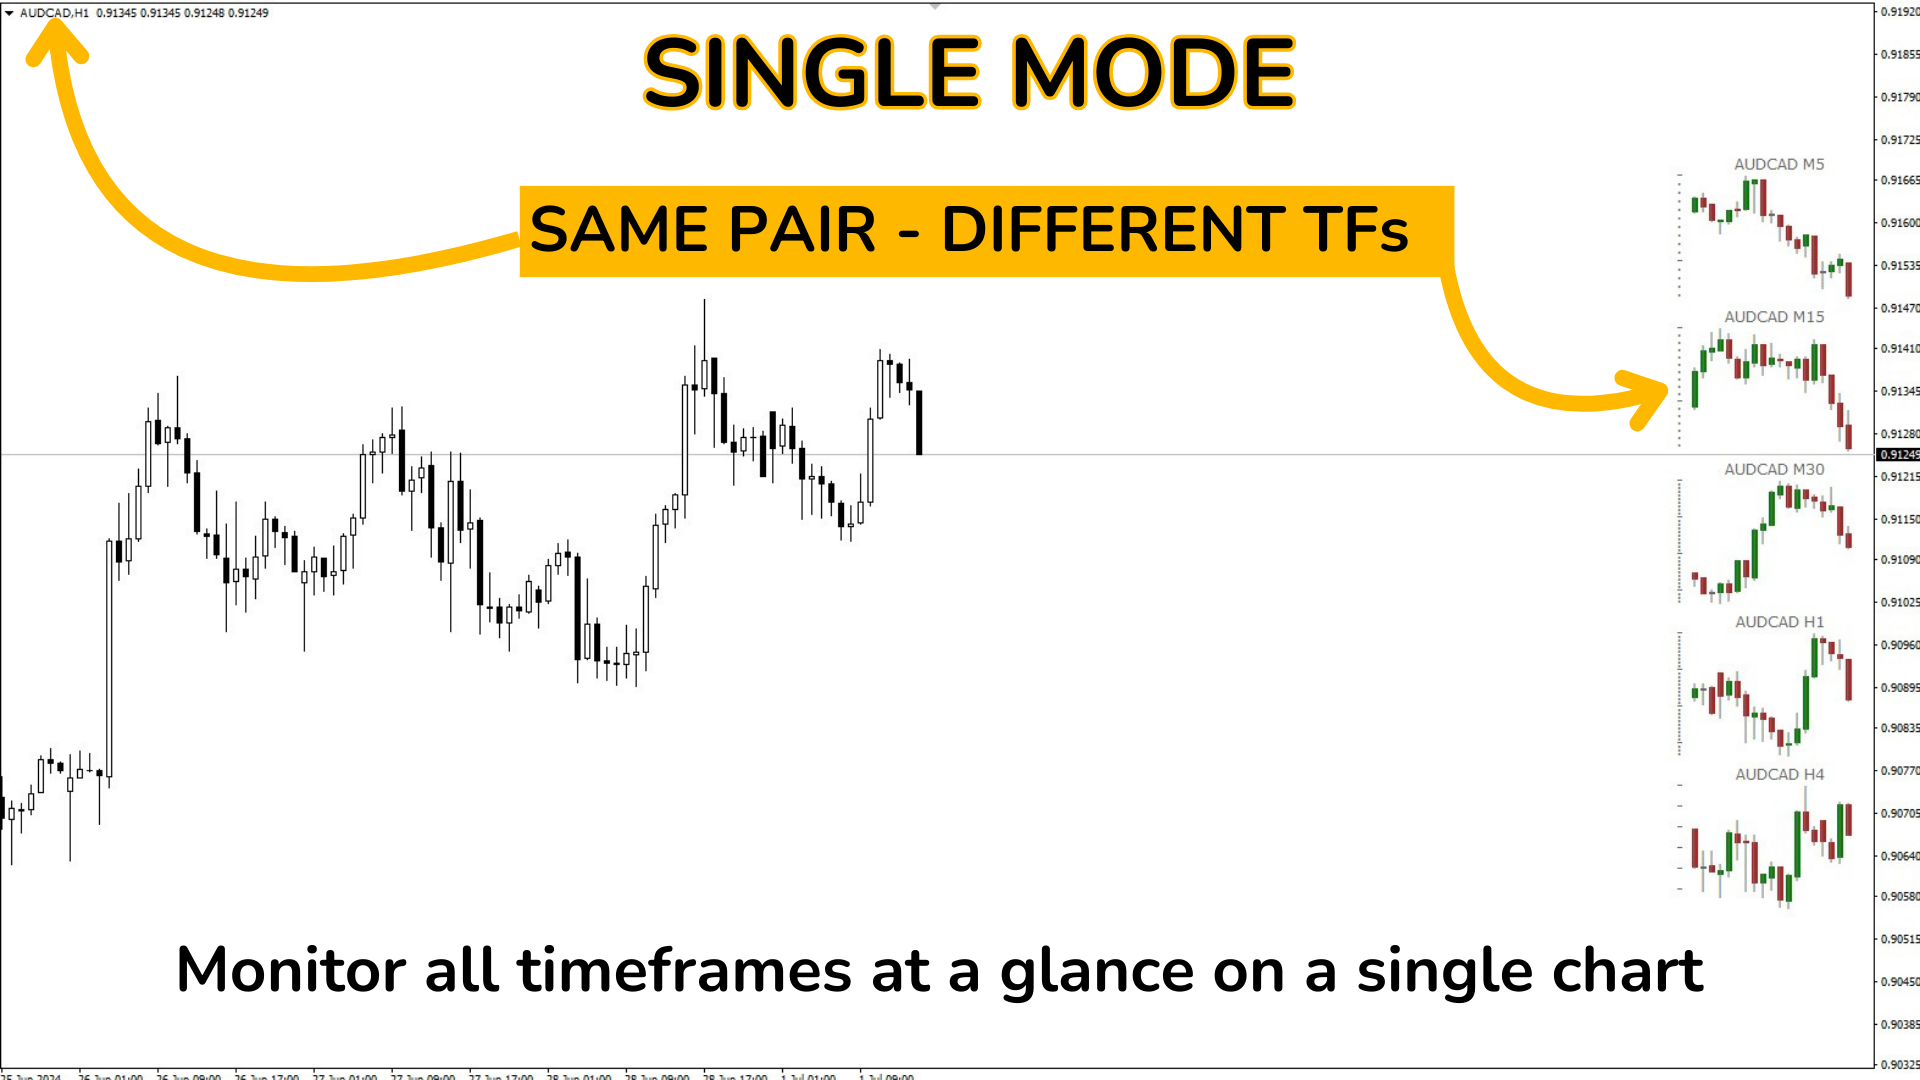
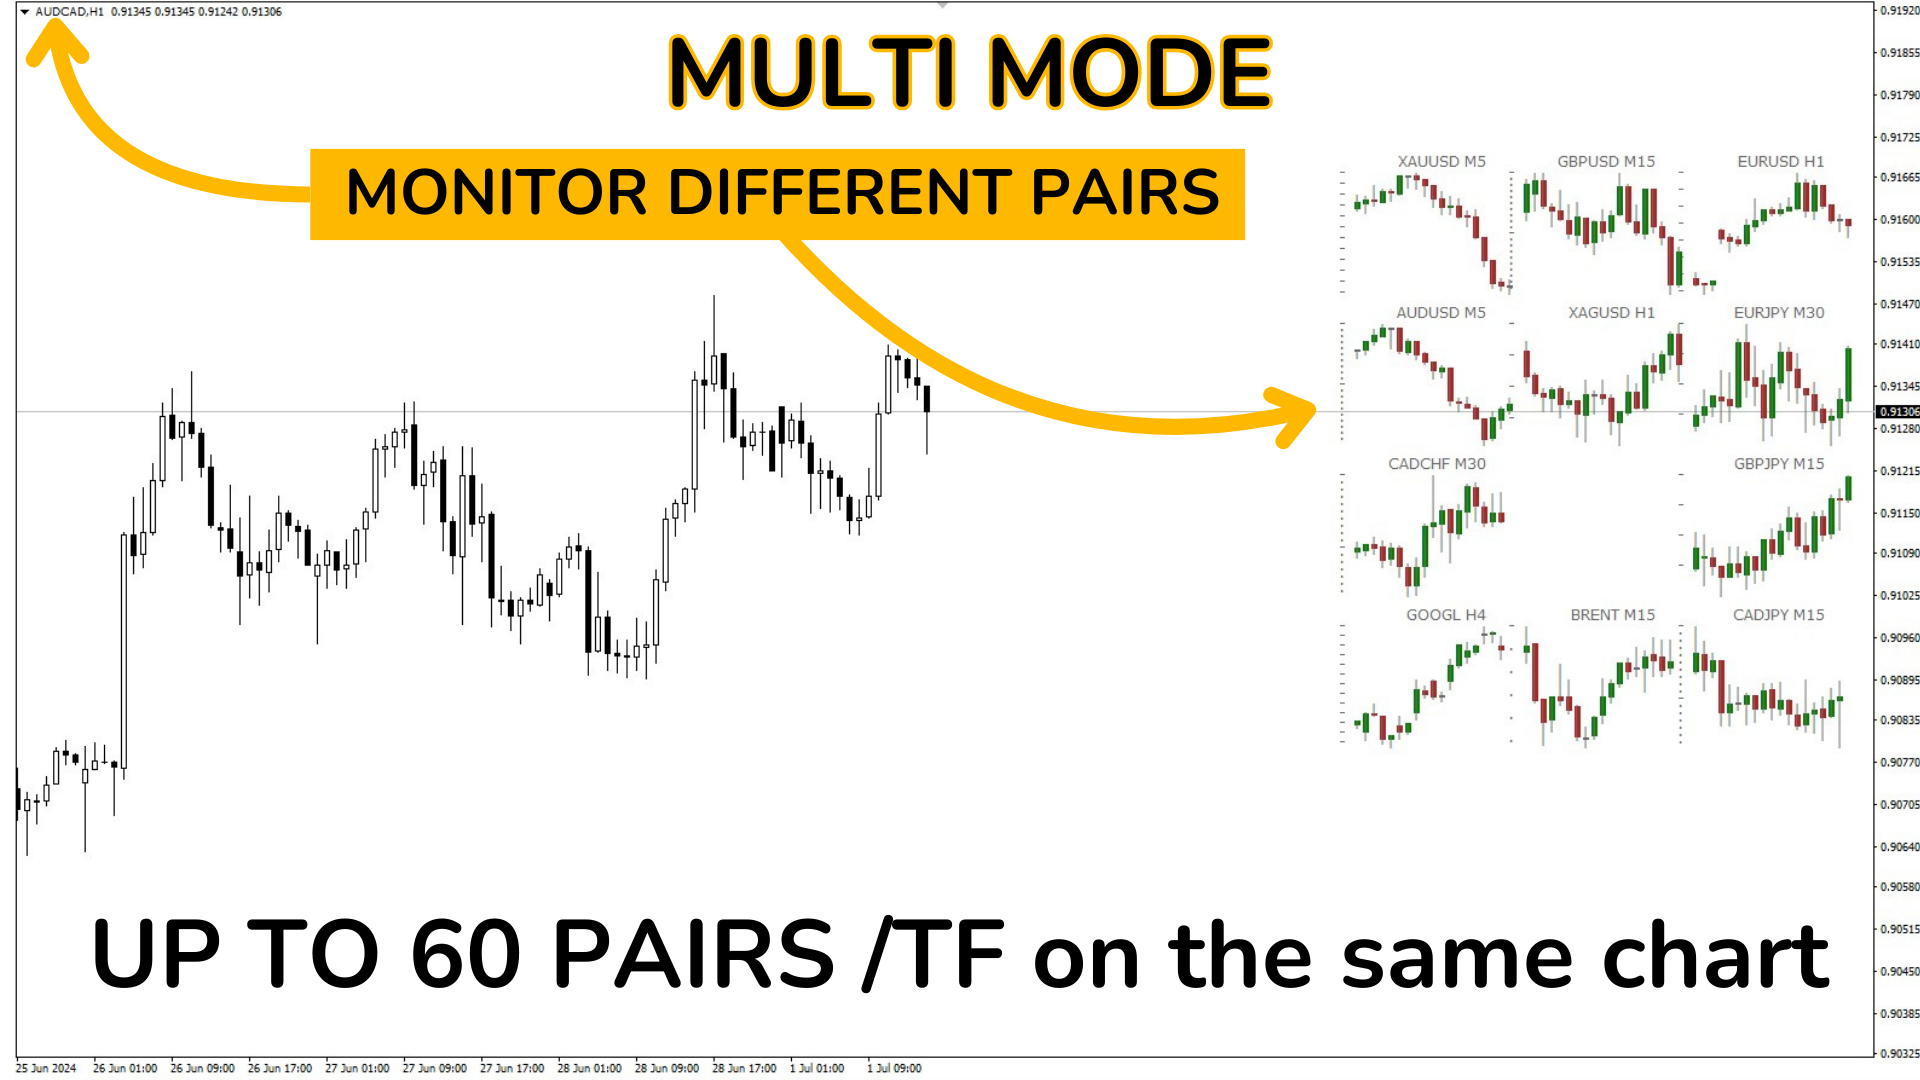
L'indicateur "MultiSymbol & TF Chart Integrated" est conçu pour fournir rapidement une vue complète du marché, vous permettant de surveiller jusqu'à 60 paires de devises dans les délais de votre choix sur un seul graphique (mode multiple) ou de voir la paire que vous négociez sur tous les TF (mode simple).

Avantages Principaux:

Surveillance Complète: Permet la surveillance en temps réel de toutes les paires souhaitées sur un seul graphique en un coup d'œil.
Gain de Temps: Évite la nécessité de basculer entre les graphiques, en voyant le comportement de chaque paire en temps réel.
Analyse des Tendances: Parfait pour les traders suivant les tendances, vous permettant de voir les délais supérieurs pour confirmer les tendances avant de prendre des décisions.
Personnalisation Extrême: Ajustez chaque aspect de l'indicateur à vos besoins spécifiques.

Personnalisation Extrême:

Paramètres de l'Indicateur Hautement Configurables:
Symboles et Délais:

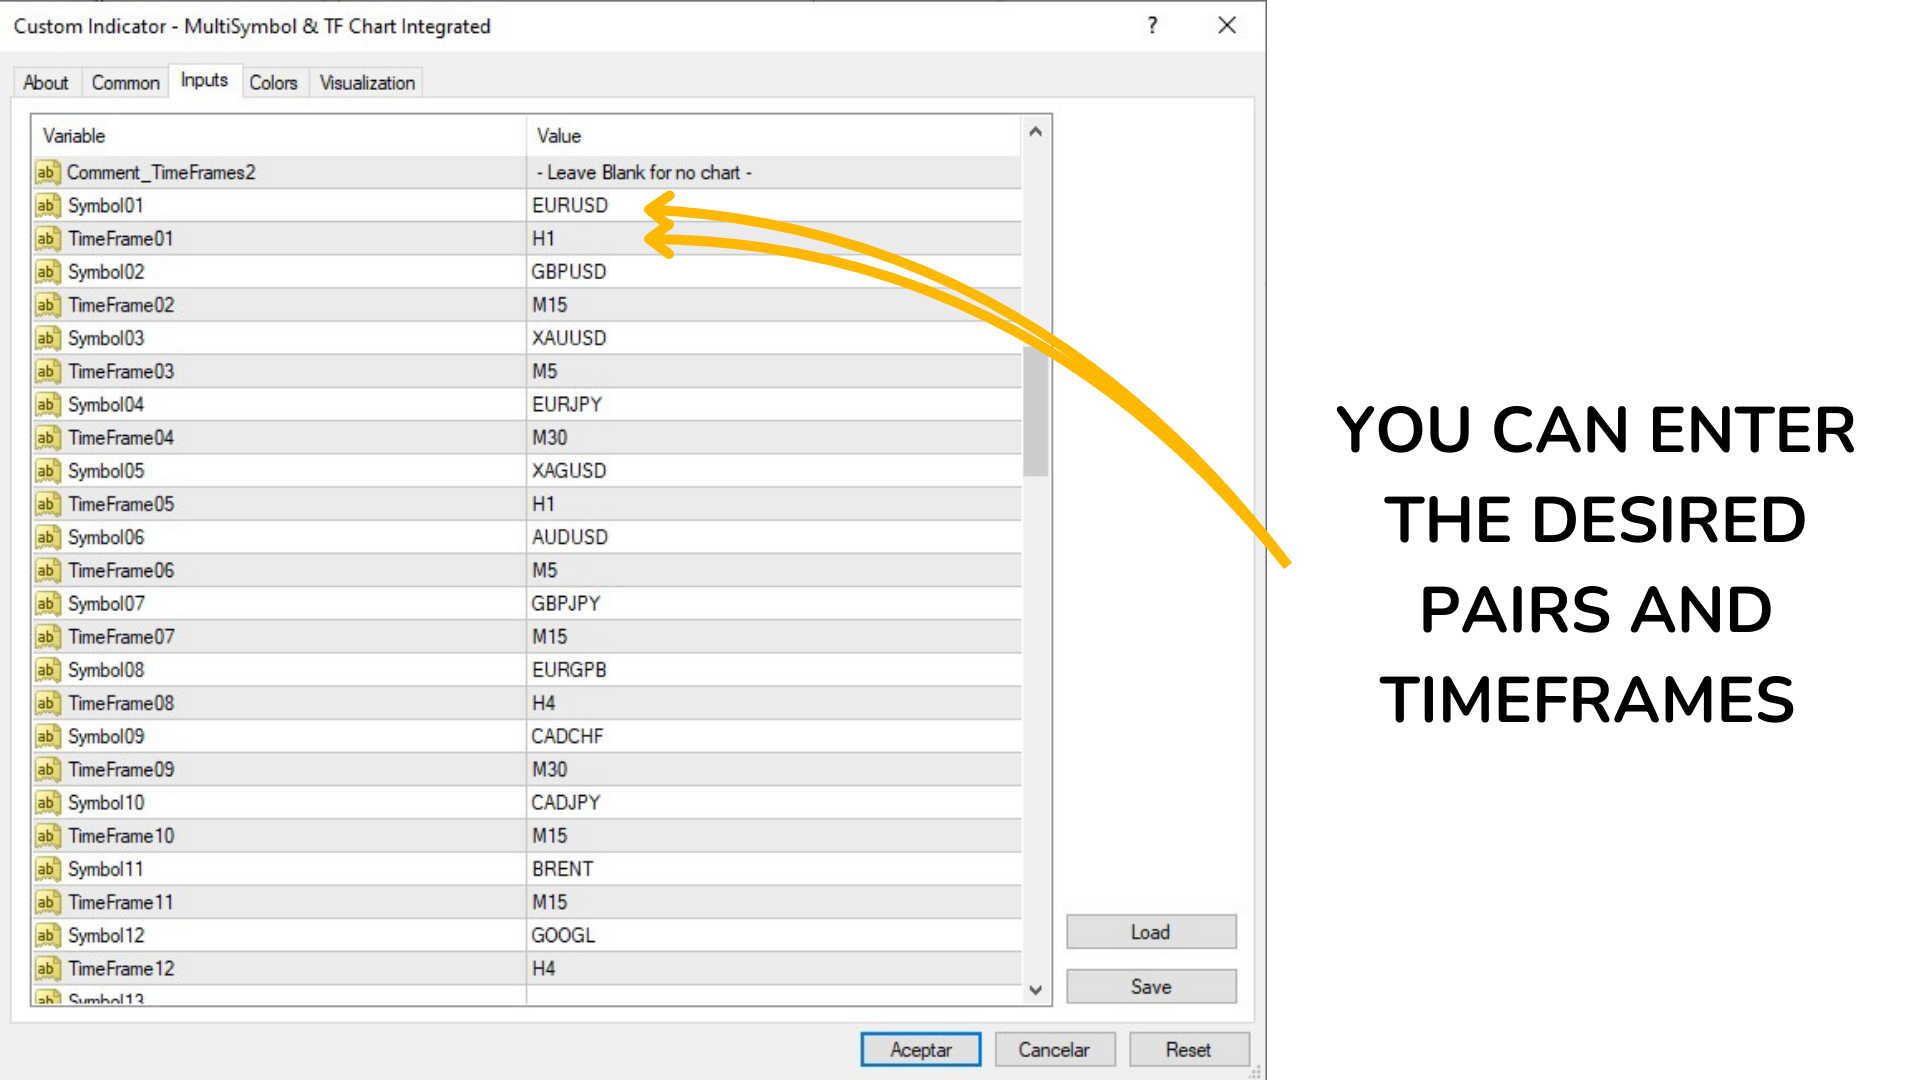
  • Permet de configurer jusqu'à 60 symboles différents.
  • Chaque symbole peut avoir son propre délai (par exemple, M1, M5, M15, M30, H1, H4, D1, W1, MN1).

Mode d'Affichage:

  • Mode Simple: Configurez un seul graphique avec un délai spécifique.
  • Mode Multiple: Configurez plusieurs graphiques avec différents symboles et délais.

Configuration des Couleurs:

  • Couleurs personnalisables pour les bougies haussières et baissières.
  • Couleurs des mèches des bougies.
  • Couleur de l'échelle des prix.

Échelle et Positionnement:

  • Mise à l'échelle automatique des graphiques en fonction de la plage de prix et de l'ATR.
  • Positionnement des graphiques à l'aide de paramètres en pixels.
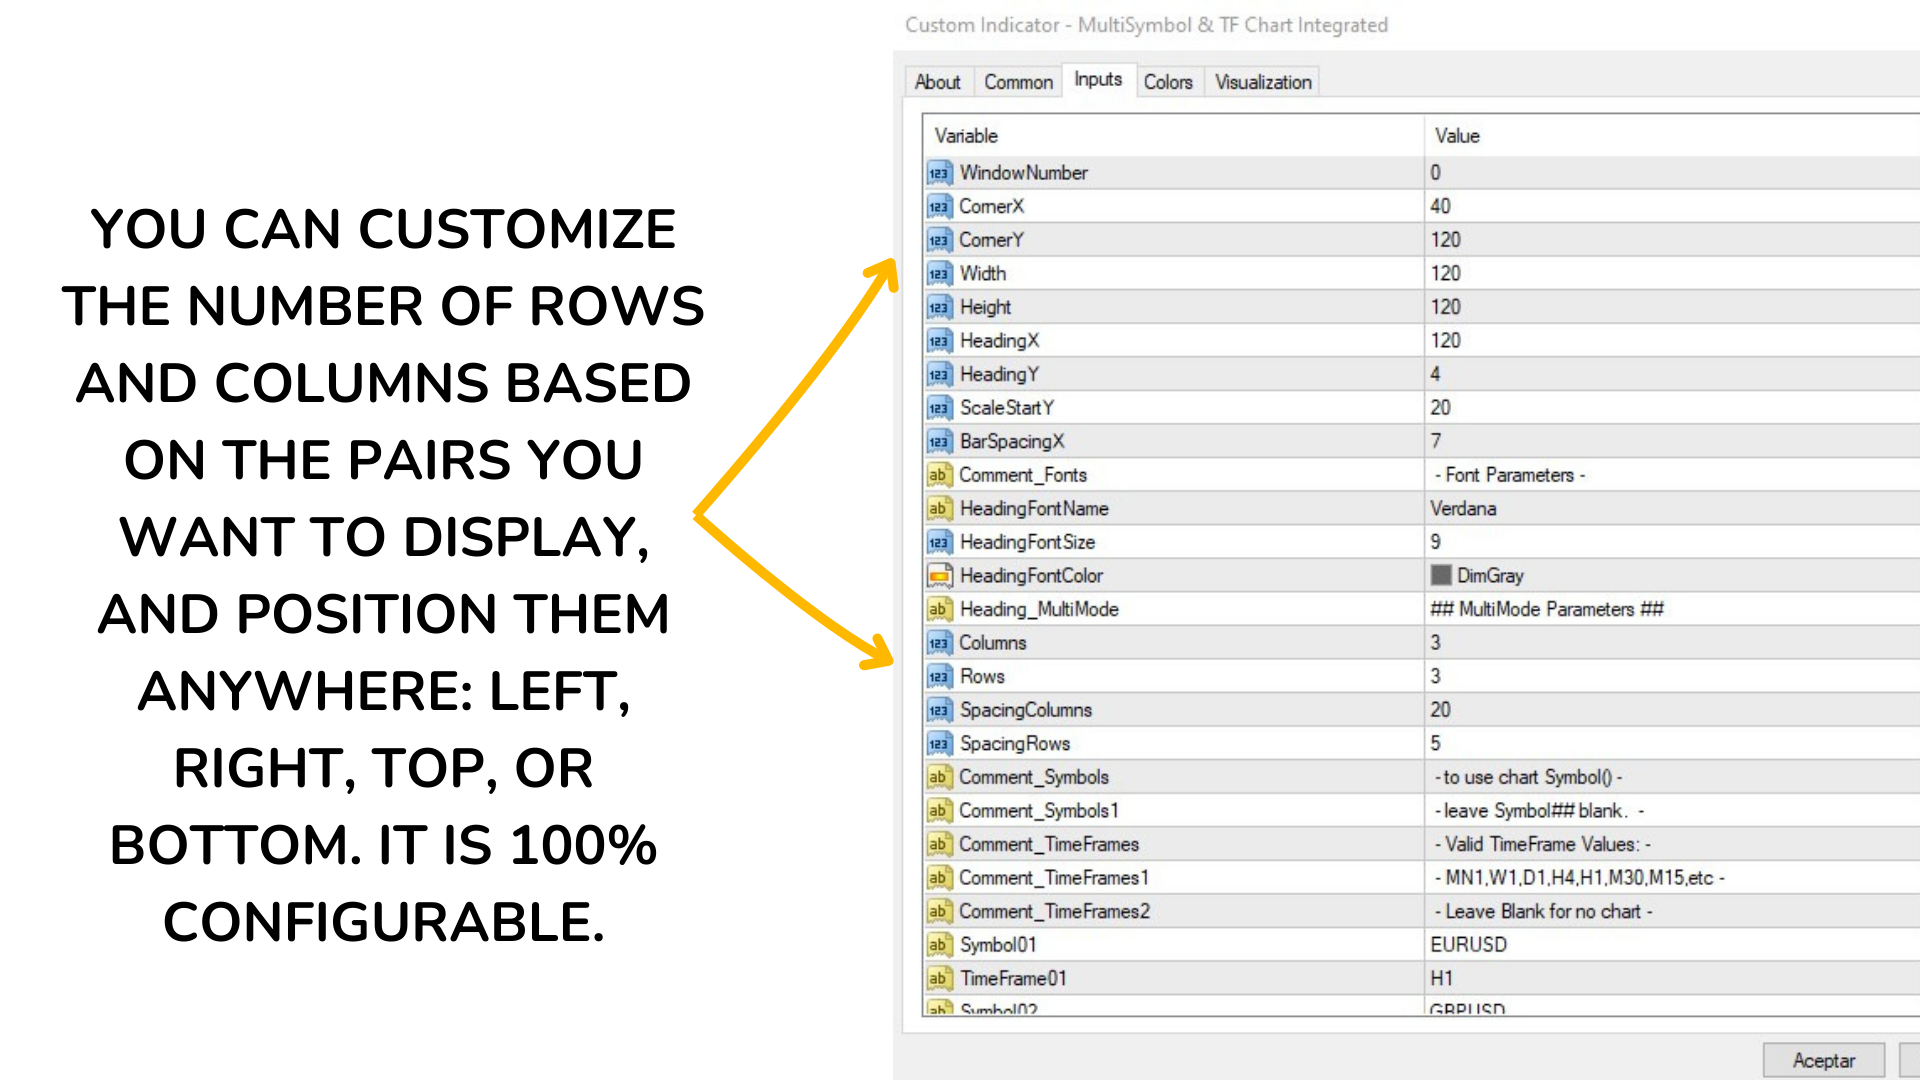
  • Nombre de lignes et de colonnes pour la disposition du graphique.
  • Espacement entre les colonnes et les lignes.
  • Position initiale (X, Y) dans la fenêtre du graphique.
  • Taille du graphique en pixels (largeur et hauteur).

Configuration des Polices:

  • Nom et taille de la police pour les titres et les étiquettes.
  • Couleur de la police pour les titres.

Configuration des Barres:

  • Nombre de barres à afficher sur chaque graphique.
  • Distance en pixels entre les barres.

L'indicateur "MultiSymbol & TF Chart Integrated" est un outil essentiel pour tout trader cherchant à maximiser son temps, en jetant rapidement un coup d'œil à toutes les paires souhaitées et en négociant sur celle qui convient le mieux à sa stratégie. Sa haute personnalisation et sa facilité d'utilisation en font un choix idéal pour les traders de tous niveaux.

Utilisez le guide pour ajuster les paramètres en fonction de vos besoins spécifiques:

Description Détaillée des Paramètres Externes de l'Indicateur:
Mode Simple
Heading_SingleMode: ## Paramètres du Mode Simple ##

Description: Titre pour les paramètres du mode simple (un seul graphique).

Comment_TimeFrame: - MN1,W1,D1,H4,H1,M30,M15,etc -

Description: Commentaire indiquant les délais valides.

TimeFrame: H4

Description: Définit le délai pour le graphique en mode simple. Vous pouvez utiliser des valeurs telles que MN1 (mensuel), W1 (hebdomadaire), D1 (quotidien), H4 (4 heures), etc.

Comment_Corner: - TopLeft=0,TR=1,BL=2,BR=3 -

Description: Commentaire expliquant les valeurs pour la position du graphique dans la fenêtre.

Corner: 1

Description: Définit le coin de la fenêtre où le graphique sera situé. Valeurs possibles: 0 (coin supérieur gauche), 1 (coin supérieur droit), 2 (coin inférieur gauche), 3 (coin inférieur droit).

Mode Multiple
Heading_ChartParam: ## Paramètres du Graphique ##

Description: Titre pour les paramètres du mode multiple (plusieurs graphiques).

MultiMode: true

Description: Active (true) ou désactive (false) le mode multiple.

CandleMode: false

Description: Définit si les bougies (true) ou les barres (false) sont affichées.

BarsToDisplay: 18

Description: Nombre de barres ou de bougies à afficher sur chaque graphique.

AutoScale: true

Description: Active (true) ou désactive (false) la mise à l'échelle automatique des graphiques en fonction de la plage de prix et de l'ATR (Average True Range).

ATRBars: 20

Description: Nombre de barres à prendre en compte pour le calcul de l'ATR.

ATRPixelsY: 30

Description: Nombre de pixels verticaux attribués à l'ATR pour la mise à l'échelle.

Configuration des Couleurs
WickColor: DimGray

Description: Couleur des mèches des bougies.

BullBarColor: Green

Description: Couleur des bougies ou des barres haussières.

BearBarColor: FireBrick

Description: Couleur des bougies ou des barres baissières.

ScaleColor: DimGray

Description: Couleur de l'échelle des prix.

Positionnement
Comment_Positioning: - Positionnement (en Pixels) -

Description: Commentaire indiquant que les paramètres suivants sont destinés au positionnement en pixels.

WindowNumber: 0

Description: Numéro de la fenêtre où le graphique sera affiché. Généralement, 0 est la fenêtre principale.

CornerX: 40

Description: Position X initiale du graphique en pixels.

CornerY: 120

Description: Position Y initiale du graphique en pixels.

Width: 120

Description: Largeur du graphique en pixels.

Height: 120

Description: Hauteur du graphique en pixels.

Configuration des Polices
HeadingFontName: Verdana

Description: Nom de la police utilisée pour les titres et les étiquettes.

HeadingFontSize: 9

Description: Taille de la police pour les titres et les étiquettes.

HeadingFontColor: DimGray

Description: Couleur de la police pour les titres.

Configuration du Mode Multiple

Heading_MultiMode: ## Paramètres du Mode Multiple ##

Description: Titre pour les paramètres spécifiques du mode multiple.

Columns: 3

Description: Nombre de colonnes pour les graphiques.

Rows: 3

Description: Nombre de lignes pour les graphiques.

SpacingColumns: 20

Description: Espacement en pixels entre les colonnes de graphiques.

SpacingRows: 5

Description: Espacement en pixels entre les lignes de graphiques.

Symboles et Délais (60 au total)
Symbol01: EURUSD

Description: Symbole pour le premier graphique. Vous pouvez configurer jusqu'à 60 symboles différents.

TimeFrame01: H1

Description: Délai pour le premier graphique. Chaque symbole peut avoir son propre délai.

Ces paramètres se répètent jusqu'à Symbol60 et TimeFrame60, qui seront par défaut vides, et chaque trader peut les configurer selon ses besoins.

L'indicateur "MultiSymbol & TF Chart Integrated" est hautement configurable et permet aux traders de personnaliser complètement l'affichage de plusieurs symboles et délais sur un seul graphique, facilitant l'analyse technique et améliorant l'efficacité de la prise de décision.


Produits recommandés
Gold Venamax   - c'est le meilleur indicateur technique boursier. L'algorithme de l'indicateur analyse l'évolution des prix d'un actif et reflète la volatilité et les zones d'entrée potentielles. Caractéristiques de l'indicateur: Il s'agit d'un super indicateur avec Magic et deux blocs de flèches de tendance pour un trading confortable et rentable. Le bouton rouge pour changer de bloc est affiché sur le graphique. La magie est définie dans les paramètres de l'indicateur, afin que vous puiss
L'indicateur construit un sémaphore à trois périodes et une figure de renversement 123 à partir de l'extremum. Le signal est donné à l'ouverture de la deuxième bougie. Cette figure peut être négociée de différentes manières (point de test 3, cassure et autres). La sortie du canal ou la rupture de la ligne de tendance est le principal déclencheur pour trouver un point d'entrée. Les icônes sont colorées en fonction des niveaux de Fibonacci. Les icônes jaunes indiquent le test d'un niveau à partir
Very Accurate Market Trend Indicator! Advantages easy, nice visual and effective trend detection given Always opportunities works on all pairs Forex, Crypto, Commodities, Stocks, Indicies works on all timeframes, but higher TF 1-4Hr is more effective !!!! WARNING !!!! This is trend indicator, it searching for trends in the market! You need patience and you may see loosing trades in a row but that is normal! Do not panick! Once you detect the trends and its confirmed there will be plenty of pi
The Netsrac Correlation Trade Indicator (NCTI) was created to trade correlations between different assets. NCTI offers five different strategies to do this. Five different correlation trading strategies with two or three assets Fast access your assets with one click via asset buttons Your profit/loss at a glance Configurable alerts via screen or mobile You can use the indicator with every timeframe. Higher timeframes give fewer but better signals. If you have some questions or suggestions - ple
RSI Currency Strength Meter uses RSI (Relative Strength Index) to monitor how strong a currency is, or in other words, if it's being bought or sold by the majority compared to the other currencies. It displays the strength-lines of the currencies of the pair (base and counter currency of the chart) with changeable solid lines. Also, you can add up to five additional currencies to the "comparison pool". If you want to look and compare, for example, EUR, USD and JPY, it will only look at the EURUS
Actuellement 20% de réduction ! La meilleure solution pour tout débutant ou trader expert ! Ce logiciel de tableau de bord fonctionne sur 28 paires de devises. Il est basé sur 2 de nos principaux indicateurs (Advanced Currency Strength 28 et Advanced Currency Impulse). Il donne un excellent aperçu de l'ensemble du marché Forex. Il montre les valeurs de l'Advanced Currency Strength, la vitesse de mouvement des devises et les signaux pour 28 paires de devises dans tous les (9) délais. Imagine
MA Alignment Scanner
Benedict Jamora
5 (1)
This indicator scans and displays currency pairs that have recently aligned moving averages on a given timeframe. You can configure which pairs the indicator will scan. It also includes all types of alert options. Bullish MA Alignment =  MA1>MA2>MA3>MA4>MA5 Bearish MA Alignment =  MA1<MA2<MA3<MA4<MA5 Features Attach to one chart and scans all the currency pairs configured and visible in the Market Watch Window It can monitor all the available timeframes from M1 to MN1 and sends alerts on ever
Market Meeter
Hapu Arachchilage Tharindu Lakmal
Market Meter is designed for explore various trends in current trading symbol.  with Market Meter  you can get a clear idea about the trends running on different time frames of current symbol. This indicator uses separate window to display its data. Every time when a new trend occurred, Indicator shows it with displaying an arrow on related text area. It's very important to identify the trends of higher time frames when you trading lower time frames. Let the Market Meter  to do the work for you.
BinaryPRO- is a multi-currency and multi-timeframe signal indicator, created according to the author's algorithm. It produces high-quality and timely trading signals in the form of arrows on any financial assets traded on Meta Trader 4. It is a good alternative to paid signal services. The indicator can be used with any broker (with 4/5-digit quotes). The received trading signals can and should be used when trading binary options and cryptocurrency. Advantages of BinaryPRO: accurately shows th
Master Scalping M1 est un indicateur innovant qui utilise un algorithme pour déterminer rapidement et avec précision la tendance. L'indicateur calcule le temps d'ouverture et de fermeture des positions, les algorithmes de l'indicateur vous permettent de trouver les moments idéaux pour entrer dans une transaction (acheter ou vendre un actif), ce qui augmente le succès des transactions pour la plupart des commerçants. Avantages de l'indicateur : Facile à utiliser, ne surcharge pas le graphique ave
Forex Gump
Andrey Kozak
2.83 (6)
Forex Gump is a fully finished semi-automatic trading system. In the form of arrows, signals are displayed on the screen for opening and closing deals. All you need is to follow the instructions of the indicator. When the indicator shows a blue arrow, you need to open a buy order. When the indicator shows a red arrow, you need to open a sell order. Close orders when the indicator draws a yellow cross. In order to get the most effective result, we recommend using the timeframes H1, H4, D1. There
Multiple Indicators for Major Currencies The purpose of this indicator is to save time to detect more good trading opportunities by scanning all 28 cross currency pairs of AUD, CAD, CHF, EUR, GBP, JPY, NZD and USD in the same time. There are 5 indicators included in this indicator which are CCI, RSI, Stochastic, MACD and the different between plusDI and minusDI of ADX (PlusDI-MinusDI). The indicator can help in determining the following properties of each currency depending on which indicator
PZ Trend Trading
PZ TRADING SLU
4.8 (5)
Trend Trading is an indicator designed to profit as much as possible from trends taking place in the market, by timing pullbacks and breakouts. It finds trading opportunities by analyzing what the price is doing during established trends. [ Installation Guide | Update Guide | Troubleshooting | FAQ | All Products ] Trade financial markets with confidence and efficiency Profit from established trends without getting whipsawed Recognize profitable pullbacks, breakouts and early reversals The ind
Indicator MTF Qristalium Arrows is a semi - automatic trading system. It works on all currency pairs.  The indicator uses three rules: 1) we trade only on the trend, 2)"buy when everyone sells and sell when everyone buys", 3) the Price always goes against the crowd.  Indicator MTF Arrows Qristalium filter rules across multiple time frames using the built-in indicators. If the trend matches on the selected time intervals, the indicator will give an arrow to enter the market. Then you mak
Blahtech Market Profile
Blahtech Limited
4.61 (18)
Was: $249  Now: $99   Market Profile defines a number of day types that can help the trader to determine market behaviour. A key feature is the Value Area, representing the range of price action where 70% of trading took place. Understanding the Value Area can give traders valuable insight into market direction and establish the higher odds trade. It is an excellent addition to any system you may be using. Blahtech Limited presents their Market Profile indicator for the MetaTrader community. Ins
Think of the rarest pair you can think of. And I assure you that this indicator can compute it's strength. This Currency Meter will literally calculate any currency pairs, either it is the Major Pairs, Metals, CFD's, Commodities, Crypto Currency like Bitcoin/BTC or Ethereum/ETH and even stocks. Just name it and you will get it! There is no currency pair this Currency Meter can solve. No matter how rare or exotic is that currency, it will always be solved by this Currency meter which on a real-ti
Currency Power Meter
Vu Trung Kien
4.74 (19)
Currency Power Meter shows the power of major currencies against each other. The indicator shows the relative strength of currency/pair at the current moment in a period of time (H4, daily, weekly, monthly). It is useful for day traders, swing traders and position traders with suitable period options. Currency power is the true reason of market trend: The strongest currency against the weakest currency will combine into a most trending pair. As we know, trend makes money and all traders love tre
Gann Square of 144
Taras Slobodyanik
4.33 (6)
The Gann Box (or Gann Square) is a market analysis method based on the "Mathematical formula for market predictions" article by W.D. Gann. This indicator can plot three models of Squares: 90, 52(104), 144. There are six variants of grids and two variants of arcs. You can plot multiple squares on one chart simultaneously. Parameters Square — selection of a square model: 90 — square of 90 (or square of nine); 52 (104) — square of 52 (or 104); 144 — universal square of 144; 144 (full) — "full"
Cloud Eyes is an advanced moving average alert that   will easily monitor the price action based on set moving averages to multiple open charts.  Objective: To monitor multiple open charts and notify traders conveniently in a single display panel when using the moving averages to enter/exit a trades. Features: Monitor price action in two timeframes at the same time Supports simple, exponential, smoothed, linear weighted moving averages Trigger an alert based on candle size (full/body length) Ca
CCI Currency Strength Meter uses CCI (Commodity Channel Index) to monitor how strong a currency is, or in other words, if it's being bought or sold by the majority compared to the other currencies. If you load this indicator on a chart, it will first display the strength-lines of the currencies (base and counter currency of the chart) with changeable solid lines. Also, you can add up to five additional currencies to the "comparison pool," that already has the base and the profit (counter) curren
Marketfx Profile
Mahmoud Helmy Sedik Mohamed Mansour
A   Market Profile   is an intra-day charting technique (price vertical, time/activity horizontal) devised by J. Peter Steidlmayer, a trader at the   Chicago Board of Trade   (CBOT), ca 1959-1985. Steidlmayer was seeking a way to determine and to evaluate   market value   as it developed in the day time frame. The concept was to display price on a vertical axis against time on the horizontal, and the ensuing graphic generally is a bell shape--fatter at the middle prices, with activity trailing o
L'indicateur construit les cotations actuelles, qui peuvent être comparées aux cotations historiques et, sur cette base, faire une prévision de l'évolution des prix. L'indicateur dispose d'un champ de texte pour une navigation rapide jusqu'à la date souhaitée. Option : Symbole - sélection du symbole que l'indicateur affichera ; SymbolPeriod - sélection de la période à partir de laquelle l'indicateur prendra des données ; IndicatorColor - couleur de l'indicateur ; HorisontalShift -
Daily Average Retracement Dashboard is an indicator that allows you to monitor multiple currency pairs at one time. This indicator is mainly for strategies that trade price retracement based on Resistance 3/4 or Support 3/4. After applying this indicator to the chart window, it will hide the chart and display the currency pairs in a table form. There are several data shown on the table that will help trader know when to analyze the currency and do trade using retracement. The indicator will show
This multicurrency indicator is the Lite version of the Cosmic Diviner Reversal Zone Pro indicator. The indicator is based on original formulas for analyzing the volatility and price movement strength. This allows determining the overbought and oversold states of instruments with great flexibility, as well as setting custom levels for opening buy or sell orders when the overbought or oversold values of the instruments reach a user-defined percentage. A huge advantage of Reversal Zone Lite is the
Currency Strength Meter is the easiest way to identify strong and weak currencies. This indicator shows the relative strength of 8 major currencies + Gold: AUD, CAD, CHF, EUR, GBP, JPY, NZD, USD, XAU. Gold symbol can be changed to other symbols like XAG, XAU etc. By default the strength value is normalised to the range from 0 to 100 for RSI algorithm: The value above 60 means strong currency; The value below 40 means weak currency; This indicator needs the data of all 28 major currency pairs
Trendiness Index
Libertas LLC
5 (3)
"The trend is your friend" is one of the best known sayings in investing, because capturing large trendy price movements can be extremely profitable. However, trading with the trend is often easier said than done, because many indicators are based on price reversals not trends. These aren't very effective at identifying trendy periods, or predicting whether trends will continue. We developed the Trendiness Index to help address this problem by indicating the strength and direction of price trend
Signal Strength Meter
Naim El Hajj
4.17 (6)
The Signal Strength Meter is a Multi-Currency, Dual Timeframe Interactive Indicator, which calculates the strength of buy and sell signals, and displays a score for each symbol on a display board. Get a 7-Day Free Trial Version:  Click  Here  (Full Access to The Indicator for 7 Days) Check Video Below For Complete Demonstration, and User Manual here . Key Features: Allows you to see multiple currency signals from one chart Analyses the signals from more than a dozen classic indicators Identi
Fisher Yur4ik Indicator - Unlock Precise Trading Insights Explore a world of precision in trading with the "Fisher Yur4ik Indicator." This advanced tool is designed to provide traders with accurate insights into price trends, allowing for well-informed decisions and enhanced profitability. Basic Details : Indicator Type : Fisher Yur4ik Indicator Key Metrics : Real-time analysis of price trends and potential turning points. Customization : Fully customizable settings to align with your unique tra
The indicator displays the data of the Stochastic oscillator from a higher timeframe on the chart. The main and signal lines are displayed in a separate window. The stepped response is not smoothed. The indicator is useful for practicing "manual" forex trading strategies, which use the data from several screens with different timeframes of a single symbol. The indicator uses the settings that are identical to the standard ones, and a drop-down list for selecting the timeframe. Indicator Parame
About testing Mode: 1.To get the best usage experience please use the tick data to test and adjust the test speed to proper speed (tick price jump quickly but K bars scroll slowly)!!! 2.Click "Indicator Properties"-> Click "Reset" before testing the indicator to restore the default parameters of the indicator. 1. Compound Drawings (1) Line segment with arrow (2) Continuous line segment (broken line) (3) Parallelogram (4) Polygon (5) Profit and loss ratio measurement tools 2.     Backtracking
Les acheteurs de ce produit ont également acheté
TPSpro RFI Levels
Roman Podpora
4.85 (20)
Reversal First Impulse levels (RFI)    INSTRUCTIONS        RUS       -       ENG              R ecommended to use with an indicator   -   TREND PRO -  Version MT5 A key element in trading is zones or levels from which decisions to buy or sell a trading instrument are made. Despite attempts by major players to conceal their presence in the market, they inevitably leave traces. Our task was to learn how to identify these traces and interpret them correctly. Main functions: Displaying active zones
Atomic Analyst
Issam Kassas
5 (3)
Tout d'abord, il convient de souligner que cet indicateur de trading n'est ni repainting, ni redrawing et ne présente aucun délai, ce qui le rend idéal à la fois pour le trading manuel et automatisé. Manuel de l'utilisateur : réglages, entrées et stratégie. L'Analyste Atomique est un indicateur d'action sur les prix PA qui utilise la force et le momentum du prix pour trouver un meilleur avantage sur le marché. Équipé de filtres avancés qui aident à éliminer les bruits et les faux signaux, et à
Enigmera
Ivan Stefanov
5 (3)
ENIGMERA : Le cœur du marché https://www.enigmera.com Introduction Cet indicateur et ce système de trading constituent une approche remarquable des marchés financiers. ENIGMERA utilise les cycles fractals pour calculer avec précision les niveaux de support et de résistance. Il indique la phase d'accumulation authentique et donne une direction et des objectifs.  Un système qui fonctionne que nous soyons dans une tendance ou une correction.  Comment fonctionne-t-il ? ENIGMERA comprend trois l
Please send me Direct message on MQL5 CHAT after purchasing the Indicator for Training and Installation Support There are some additional files that is important to use with the Indicator . So be sure to contact me after purchasing the Indicator So that I can add you for training and support . If you find any difficulty with installation then send me Direct message here So that I can connect with you via Anydesk or Teamview for the product installation. " Smart Order Block Indicator " to find
ECM Channel MT4
Paulo Rocha
5 (1)
ECM Elite Channel is a volatility-based indicator, developed with a specific time algorithm, which consists of finding possible corrections in the market. This indicator shows two outer lines, an inner line (retracement line) and an arrow sign, where the channel theory is to help identify overbought and oversold conditions in the market. The market price will generally fall between the boundaries of the channel. If prices touch or move outside the channel, it's a trading opportunity. The
Indicator : RealValueIndicator Description : RealValueIndicator is a powerful tool designed specifically for trading on the EURUSD pair. This indicator analyzes all EUR and USD pairs, calculates their real currency strength values, and displays them as a single realistic value to give you a head start on price. This indicator will tell you moves before they happen if you use it right. RealValueIndicator allows you to get a quick and accurate overview of the EURUSD currency pair tops and bottoms,
Gold Channel is a volatility-based indicator, developed with a specific timing algorithm for the XAUUSD pair, which consists of finding possible corrections in the market. This indicator shows two outer lines, an inner line (retracement line) and an arrow sign, where the theory of the channel is to help identify overbought and oversold conditions in the market. The market price will generally fall between the boundaries of the channel. If prices touch or move outside the channel it is a tra
Introduction to X3 Chart Pattern Scanner X3 Cherart Pattern Scanner is the non-repainting and non-lagging indicator detecting X3 chart patterns including Harmonic pattern, Elliott Wave pattern, X3 patterns, and Japanese Candlestick patterns. Historical patterns match with signal patterns. Hence, you can readily develop the solid trading strategy in your chart. More importantly, this superb pattern scanner can detect the optimal pattern of its kind. In addition, you can switch on and off individu
TrendMaestro
Stefano Frisetti
5 (3)
note: this indicator is for METATRADER4, if you want the version for METATRADER5 this is the link:  https://www.mql5.com/it/market/product/108106 TRENDMAESTRO ver 2.4 TRENDMAESTRO recognizes a new TREND in the bud, he never makes mistakes. The certainty of identifying a new TREND is priceless. DESCRIPTION TRENDMAESTRO identifies a new TREND in the bud, this indicator examines the volatility, volumes and momentum to identify the moment in which there is an explosion of one or more of these data a
SNR LEVEL INDICATOR Accurate Snr level indicator will only display Fresh Levels that are close to the Current Market Price. This indicator is very accurate in mapping Support & resistance levels. there is an alert feature when the price TOUCHES the SNR LEVEL, WHEN CLOSE CANDLE BREAK/REJECT SNR LEVEL. INDICATOR MARKING :: - SUPPORT LEVEL == V SHAPE - RESISTANCE LEVEL == APEX LEVEL - GAP RESISTANCE & GAP SUPPORT == OPEN CLOSE CANDLE - SUPPORT BECAME RESISTANCE & RESISTANCE BECAME SUPPORT INDIC
Présentation de l'indicateur astronomique pour MT4 : Votre compagnon de trading céleste ultime Êtes-vous prêt à élever votre expérience de trading à des hauteurs célestes ? Ne cherchez pas plus loin que notre indicateur astronomique révolutionnaire pour MT4. Cet outil innovant transcende les indicateurs de trading traditionnels en exploitant des algorithmes complexes pour vous fournir des aperçus astronomiques inégalés et des calculs de précision. Un univers d'informations à portée de main : Con
Beast Super Signal
Dustin Vlok
4.76 (101)
Vous recherchez un puissant indicateur de trading forex qui peut vous aider à identifier facilement des opportunités de trading rentables ? Ne cherchez pas plus loin que le Beast Super Signal. Cet indicateur basé sur les tendances facile à utiliser surveille en permanence les conditions du marché, en recherchant de nouvelles tendances en développement ou en sautant sur celles existantes. Le Beast Super Signal donne un signal d'achat ou de vente lorsque toutes les stratégies internes s'alignent e
Volatility Trend System - un système de trading qui donne des signaux pour les entrées. Le système de volatilité donne des signaux linéaires et ponctuels dans le sens de la tendance, ainsi que des signaux pour en sortir, sans redessiner ni retarder. L'indicateur de tendance surveille la direction de la tendance à moyen terme, montre la direction et son changement. L'indicateur de signal est basé sur les changements de volatilité et montre les entrées sur le marché. L'indicateur est équipé de
NAM Order Blocks
NAM TECH GROUP, CORP.
5 (1)
MT4 Multi-timeframe Order Blocks detection indicator. Features - Fully customizable on chart control panel, provides complete interaction. - Hide and show control panel wherever you want. - Detect OBs on multiple timeframes. - Select OBs quantity to display. - Different OBs user interface. - Different filters on OBs. - OB proximity alert. - ADR High and Low lines. - Notification service (Screen alerts | Push notifications). Summary Order block is a market behavior that indicates order collection
How to use Pair Trading Station Pair Trading Station is recommended for H1 time frame and you can use it for any currency pairs. To generate buy and sell signal, follow few steps below to apply Pair Trading Station to your MetaTrader terminal. When you load Pair Trading Station on your chart, Pair Trading station will assess available historical data in your MetaTrader platforms for each currency pair. On your chart, the amount of historical data available will be displayed for each currency pai
L'indicateur " ZigZag on Trend " est un assistant pour déterminer la direction du mouvement des prix, ainsi qu'un calculateur de barres et de pips. Il se compose d'un indicateur de tendance qui surveille la direction du prix avec une ligne de tendance présentée sous la forme d'un zigzag et d'un compteur qui calcule le nombre de barres passées dans le sens de la tendance et le nombre de points sur une échelle verticale. (Les calculs sont effectués par l'ouverture de la barre) L'indicateur n'est p
Currently Price 20% OFF ( for unlimited use )   BONUS  AUX VIP Club 2024 : Include  EA Airbag  and  Load Data History  to enhance the performance of this tool to its maximum potential  Click Here to Download Files   ( for users only )   Hello World! Introducing.. SMCpro VIP tool and Indicator for MetaTrader 4, designed to revolutionize your trading experience with the ICT Smart Money Concept. This system is meticulously crafted to empower traders with advanced insights and precision in
XQ Indicator MetaTrader 4
Marzena Maria Szmit
3.67 (3)
Step into the realm of Forex trading with confidence and precision using XQ, a cutting-edge Forex indicator designed to elevate your trading game to unprecedented heights. Whether you're a seasoned trader or just stepping into the world of currency exchange,   XQ Forex Indicator   empowers you with the insights and signals needed to make informed trading decisions. The signal conditions are a combination of three indicators, and XQ Forex Indicator only display  medium and long-term trends . The
Cycle Sniper
Elmira Memish
4.39 (36)
NEW YEAR SALE PRICE FOR LIMITED TIME!!! Please contact us after your purchase and we will send you the complimentary indicators to complete the system Cycle Sniper is not a holy grail but when you use it in a system which is explained in the videos, you will feel the difference. If you are not willing to focus on the charts designed with Cycle Sniper and other free tools we provide, we recommend not buying this indicator. We recommend watching the videos about the indiactor and system before pu
Full Forex Market View Dashboard
Opengates Success International
5 (2)
Indicateur de tableau de bord FULL FOREX MARKET VIEW Il s'agit d'un indicateur personnalisé créé pour donner aux commerçants une vue complète de ce qui se passe sur le marché. Il utilise des données en temps réel pour accéder au marché et afficher toutes les informations nécessaires pour effectuer des transactions réussies. INSTALLATION: Avant de joindre cet indicateur à votre graphique de fenêtre, accédez au panneau Market Watch de votre MT4 et MASQUEZ toutes les paires de devises dont
Cyclical indicator for trading and predicting the direction of the market. Shows the cyclical behavior of the price in the form of an oscillator. Gives signals for opening deals when rebounding from the upper and lower boundaries of the oscillator. In the form of a histogram, it shows the smoothed strength of the trend. Will complement any trading strategy, from scalping to intraday. The indicator does not redraw. Suitable for use on all symbols/instruments. Suitable time frames for short-term
PZ Mean Reversion MT4
PZ TRADING SLU
2.33 (3)
Indicateur unique qui met en œuvre une approche professionnelle et quantitative pour signifier le trading de réversion. Il capitalise sur le fait que le prix dévie et revient à la moyenne de manière prévisible et mesurable, ce qui permet des règles d'entrée et de sortie claires qui surpassent largement les stratégies de trading non quantitatives. [ Installation Guide | Update Guide | Troubleshooting | FAQ | All Products ] Des signaux de trading clairs Étonnamment facile à échanger Couleurs et
Volume by Price MT4
Brian Collard
4.71 (14)
The Volume by Price Indicator for MetaTrader 4 features Volume Profile and Market Profile TPO (Time Price Opportunity). Volume and TPO histogram bar and line charts. Volume Footprint charts. TPO letter and block marker collapsed and split structure charts. Session filtering and grouping. Static, dynamic and flexible range segmentation and compositing methods with relative and absolute visualizations. Graphical layering, positioning and styling options to suit the user's analytic and aesthetic n
MOTANO indicator
Teofil Creanga
1 (1)
Indicatorul MOTANO Bună ziua! 24 de ore - REDUCERE PREȚ! Profita! Tocmai am terminat indicatorul MOTANO după multă muncă. Este un indicator de săgeată. Merge perfect pe M15, aproape orice pereche. Săgețile indică intrările de cumpărare și vânzare, iar o țintă de profit de 5,10 sâmburi asigură un profit sigur. Un profit și mai mare poate fi stabilit, în funcție de situație. Dar cuvintele sunt de prisos. Testați-l și trageți propriile concluzii. Notă Este posibil ca acești ind
Présentation de l'indicateur miraculeux Forex : Libérez la puissance du trading précis En avez-vous assez de chercher le meilleur indicateur Forex qui fournisse réellement des résultats exceptionnels sur tous les délais ? Ne cherchez plus ! L'indicateur miraculeux Forex est là pour révolutionner votre expérience de trading et propulser vos gains vers de nouveaux sommets. Basé sur une technologie de pointe et des années de développement minutieux, l'indicateur miraculeux Forex se positionne comme
Backtesting Simulator MT4
Diego Arribas Lopez
3.5 (2)
[ MT5 Version ] Only the next 10 units at current price! Final price: $299 Are you tired of spending months on demo or live accounts to test your trading strategies? The Backtesting Simulator is the ultimate tool designed to elevate your backtesting experience to new heights. Utilizing Metatrader historical symbol information, it offers an unparalleled simulation of real market conditions. Take control of your testing speed, test ideas quickly or at a slower pace, and witness remarkable improvem
Dragon Multi Indicator MT4
Mansour Babasafary
5 (4)
3 Indicators in 1 indicator Strategy based on price action Made specifically for the best forex currency pairs Can be used in the best time frame of the market at a very reasonable price This indicator is basically 3 different indicatos . But we have combined these 3 indicators in 1 indicator so that you can use 3 indicators at the lowest price. All three strategies are based on price action. But based on different trends. Long term, medium term and short term Attributes : No repaintin
Supply and Demand Dashboard PRO
Bernhard Schweigert
4.82 (22)
Actuellement 20% de réduction ! Ce tableau de bord est un logiciel très puissant qui fonctionne sur plusieurs symboles et jusqu'à 9 horizons temporels. Il est basé sur notre indicateur principal (Best reviews : Advanced Supply Demand ).   Le tableau de bord donne une excellente vue d'ensemble. Il montre :  Les valeurs d'offre et de demande filtrées, y compris l'évaluation de la force de la zone, Les distances en pips vers/et dans les zones, Il met en évidence les zones imbriquées, Il donne
Backtest with good trend detection results from January 2023 EURUSD Time frame: m15, m30, H1 AUDUSD Time frame: m15, m30 NASDAQ Time frame: m15 S&P 500 Time frame: m15, m30 XAUUSD Time frame: m30 BTCUSD Time frame: H4 These are just some of the assets tested (Please note that past results are no guarantee of future results). Note that this is not a complete strategy, you can use this indicator as an entry trigger after your analysis by setting stop loss and take profit values ​​that you d
Max Paynex
Abdulkarim Karazon
Max Payne은 화살표 형태로 신호를 제공하는 반전/추세 신호 지표입니다. 이 지표는 동일한 막대 종가에 신호를 제공하며, 이 지표는 신호의 이중/삼중 확인을 위해 다양한 기간으로 차트에서 여러 번 떨어질 수 있습니다. 표시기는 다시 칠하거나 다시 칠하지 않는 동안 모든 거래 스타일에 맞게 고도로 조정 가능합니다. 사용된 템플릿과 함께 구매 후 스크린샷에 표시된 전체 시스템을 얻을 수 있습니다. ----------------- 거래 방법: 트렌드 필터(구매 후 얻을 수 있는 Payne 트렌드)가 방향에 동의하는 동안 동일한 바에서 세 번의 확인을 받을 때까지 기다리세요. 거래를 개시하고 매수 거래의 경우 황금색 화살표(템플릿) 아래에 정지 손실을 설정하고 매도 거래의 경우 황금색 화살표(템플릿) 위에 설정하면 종료 신호는 반대쪽 첫 번째 흰색 점 신호(템플릿)입니다. ----------------- 매개변수: 신호주기 : 화살표주기 필터: 신호 필터 거리 : 양초로부터의 화살표
Plus de l'auteur
Aurum Apex Mt4 EA
Martin Alejandro Bamonte
Description de Aurum Apex EA Aurum Apex EA est un puissant outil de trading automatique à 100 % conçu pour la plateforme MT4. Il analyse le marché en temps réel et détecte diverses opportunités de trading. Adapté à tous les niveaux de traders, Aurum Apex EA propose trois modes de risque ajustables via le paramètre de Risque : Risque = 0.1 (Risque Faible) : Idéal pour les nouveaux traders peu familiers avec les mouvements de l'or. Ce paramètre minimise les surprises tout en renforçant la confian
BullsEye Signal NoRepaint
Martin Alejandro Bamonte
BullseyeSignal – NoRepaint est un signal qui, comme son nom l'indique, ne se repeint jamais en aucune circonstance. Le signal est émis sur la même bougie observée dans l'image. Il est idéal pour les marchés hautement volatils tels que le forex, les cryptomonnaies, les actions, les indices et les futures. Vous ne verrez qu'une flèche verte pour l'achat et une flèche rouge pour la vente, mais il y a de nombreux indicateurs qui travaillent ensemble en arrière-plan pour fournir une expérience de tra
Indicateur NextCandlePredictor NextCandlePredictor, un indicateur de signal avec alerte qui ne repeint pas, ne change pas de couleur, ne bouge pas, ne disparaît pas et n'a pas de retard. Il vous aidera à identifier la direction des prochaines bougies dans n'importe quelle période. Hautement recommandé pour les marchés à forte volatilité comme New York, Londres ou même le chevauchement des deux. Caractéristiques Principales: Polyvalence dans les Périodes de Temps: Fournit des signaux rapides et p
Scalping Signal NO Repaint NO Lag
Martin Alejandro Bamonte
5 (1)
"Scalping Signal No Repaint No Lag" est le seul indicateur sur le marché qui, lorsqu'il est glissé sur n'importe quel graphique, charge automatiquement tous les indicateurs nécessaires sans avoir besoin de charger un modèle ou d'autres indicateurs. Il configure automatiquement le graphique pour qu'il ressemble exactement à l'image fournie. Cet indicateur garantit des signaux sans redessiner ni retard, ce qui le rend idéal pour les stratégies de scalping sur toutes les paires de devises et toute
Clear Breakout
Martin Alejandro Bamonte
L'indicateur "Breakout Buy-Sell" est conçu pour identifier et mettre en évidence des opportunités d'achat et de vente potentielles basées sur les ruptures de prix pendant différentes sessions de marché (Tokyo, Londres et New York). Cet indicateur aide les traders à visualiser clairement les zones d'achat et de vente, ainsi que les niveaux de take-profit (TP) et de stop-loss (SL). Stratégie d'utilisation L'indicateur peut être utilisé comme suit : Configuration initiale : Sélectionnez la session
GbpUsd Pip Hunter EA
Martin Alejandro Bamonte
GBPUSD Pip Hunter EA Caractéristiques principales : Optimisé pour GBPUSD sur le timeframe M15 : Spécifiquement conçu et testé pour la paire GBPUSD sur un graphique de 15 minutes. Taille de compte minimum recommandée : Nécessite un solde de compte minimum de $1000 pour assurer de faibles tirages. Compatibilité des spreads : Mieux utilisé avec des comptes à faible spread ou ECN pour maximiser la rentabilité. Gestion des risques : Inclut une option pour désactiver la fonction de lot exponentiel en
L'indicateur MTFMA (Moyennes Mobiles Multi-Temps) utilise plusieurs moyennes mobiles (MA) dans différentes unités de temps pour fournir des signaux d'achat et de vente (qui ne repeignent pas) dans une fenêtre séparée du graphique principal. Il est polyvalent et facile à interpréter, adapté à la fois au scalping sur des unités de temps plus petites et au trading à plus long terme sur des unités de temps plus grandes. Pourquoi est-il Multiframe ? Le terme multiframe fait référence à la capacité de
Filtrer:
Aucun avis
Répondre à l'avis